BHARAT HEAVY ELECTRICALS Ltd - Initiating Coverage
←
→
Page content transcription
If your browser does not render page correctly, please read the page content below

BHARAT HEAVY ELECTRICALS Ltd.
Lorem ipsum dolor sit amet, consectetuer adipiscing elit, sed diam
nonummy nibh euismod tincidunt ut laoreet dolore magna aliquam
erat volutpat. Ut wisi enim ad minim veniam, quis nostrud exerci
tation ullamcorper suscipit lobortis nisl ut aliquip ex ea commodo
consequat. Duis autem vel eum iriure dolor in hendrerit in
Initiating Coverage vulputate velit esse molestie consequat, vel illum dolore eu feugiat
nulla
BHARAT HEAVY ELECTRICALS Ltd.
Lorem ipsum dolor sit amet, consectetuer adipiscing elit, sed diam nonummy
nibh euismod tincidunt ut laoreet dolore magna aliquam erat volutpat. Ut wisi
enim ad minim veniam,
21-October-2020
quis nostrud exerci tation ullamcorper suscipit lobortis nisl ut aliquip ex ea
commodo consequat. Duis autem vel eum iriure dolor in hendrerit in vulputate
velit esse molestie consequat,
vel illum dolore eu feugiat nulla facilisis at vero eros et accumsan et iusto odio
dignissim qui blandit praesent luptatum zzril delenit augue duis dolore te feugait
nulla facilisi. et iusto odio dignissim qui blandit praesent luptatum zzril delenit
augue duis dolore te feugait nulla facilisLorem ipsum dolor sit amet,
1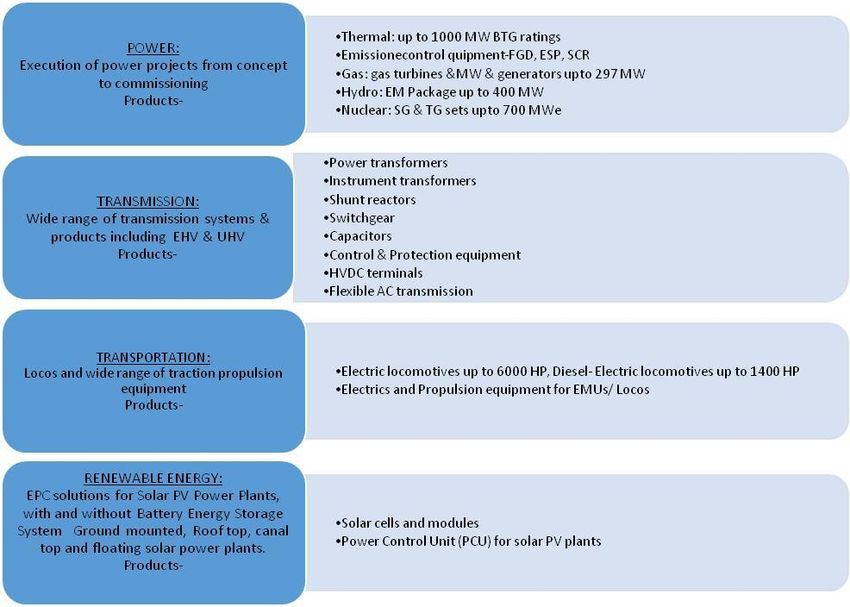
BHARAT HEAVY ELECTRICALS Ltd.
                   Industry                                      LTP                                        Fair Value                                  Time Horizon
          Heavy Electrical Equipment                           Rs.28.7                                       Rs.29.5                                      2 quarters
 HDFC Scrip Code          BHELTDEQNR      Our Take:
 BSE Code                      500103     Bharat Heavy Electricals Ltd (BHEL) is an integrated power plant equipment manufacturer with a strong market share of 53% in installed
 NSE Code                        BHEL     capacity of conventional power (BTG: Boilers, Turbines and Generators) segment within India and presence in 84 countries around the
 Bloomberg                    BHEL IN     globe. Till date, BHEL has installed around 11 GW power generating capacity in overseas markets. BHEL is one of the few companies in the
 CMP 20th Oct, 2020               28.7    world manufacturing the entire range of power plant equipment. It caters to all fuel types viz. Thermal, Hydro, Oil & Gas, Solar, and
 Equity Capital (Rs cr)          696.4    Transmission. Its business diversity in industries such as transportation, defence and emission control helps the company to mitigate
 Face Value (Rs)                     2    segment associated risk.
 Equity Share O/S (cr)           348.2
                                          Although, working capital needs are putting pressure over the net cash availability, BHEL’s focus on controlling material cost, focus on cash
 Market Cap (Rs cr)             9976.1
                                          collection, and efforts on exploring new opportunities to diversify revenue streams should improve the situation. Order book remained
 Book Value (Rs)                  83.8
                                          unchanged (due to a tendency to postpone investment on COVID 19 related demand contraction) at Rs 1,09,000cr during FY20, same as
 Avg. 52 Wk Volumes         43821198.8
                                          FY19 with 81% being executable.
 52 Week High                     61.3
 52 Week Low                      19.2
                                          BHEL started to suffer from 2015 due to competition from China, overcapacity in power industry, slowdown in addition of power
                           th
 Share holding Pattern % (30 June, 20)    capacities and shift in focus to renewable source of energy. Even now most of these negatives continue to impact BHELs’ operations
 Promoters                         63.2   though threat of China competition has significantly reduced.
 Institutions                      19.8
                                          Policy support from government for Aatmnirbhar Bharat is encouraging as it has led to increased interest among various local
 Non Institutions                  17.0
                                          manufacturers to indigenise critical components, which will in turn be beneficial for the company. Company’s prudence in taking strategic
 Total                           100.0    financial decisions, various initiatives taken in recent times, including “Make In India”, Collaborative Manufacturing, improvement in
                                          operational and execution efficiencies through implementation of IT based solutions for project monitoring, together will help in offsetting
Fundamental Research Analyst              the adversities to come. However, given the ongoing challenges in the operating environment, timely execution of orders and realisation
Debanjana Chatterjee                      of receivables will be key monitorables.
Debanjana.chatterjee@hdfcsec.com

                                                                                                                                                                                     2
BHARAT HEAVY ELECTRICALS Ltd.
                Valuations & Recommendation:
                High receivables had been a persistent problem for BHEL. In current environment, cash-flow of its major clients are weak and that will not
                help in solving the perennial problem. BHEL continues to trade at lower multiples than other engineering majors on account of this issue
                as well as lack of sufficient order acquisition visibility post execution of current order-book. The demand scenario in the BTG/EPC market is
                unlikely to materially improve in the next 1-2 years.

                Reduced competitive intensity due to exit/reduced operations of a few players over the past few years may lead to better margin profile
                of new orders. With more retirements out of existing employee base over the next few years we expect EBITDA margin can improve but
                not dramatically.

                BHEL earns low single-digit ROE for many years and has limited scope to meaningfully reduce its Net Working Capital in the near term. Its
                new initiatives in terms of contract manufacturing with global OEM will take time to show up in its financials.

                We expect BHEL to stage a turnaround in FY22. We assign a P/E multiple of 14x FY22E EPS for calculating its fair value resulting in price of
                Rs.29.5 over the next two quarters.
                Financial Summary (Standalone):
                 Particulars (Rs cr)              Q1FY21      Q1FY20       YoY-%      Q4FY20       QoQ-%          FY19        FY20         FY21E           FY22E
                 Total Operating Income            1990.9      4531.7     -56.1%       5049.3      -60.6%      30349.0     21486.1       20709.2         25013.0
                 EBITDA                           -1058.9      -266.7     297.0%       -561.7       88.5%       2142.0      -232.9          16.6          1425.7
                 Depreciation                       118.5       114.8       3.2%        154.3      -23.2%        474.8       502.9         530.2           567.3
                 Other Income                        95.5       145.5     -34.4%        148.2      -35.5%        677.6       580.6         505.3           525.3
                 Interest Cost                      114.6       108.0       6.1%        141.2      -18.8%        286.9       507.0         518.3           417.4
                 Tax                               -299.3      -127.7     134.3%        825.2     -136.3%        842.5       810.9        -213.0           231.9
                 APAT                              -897.2      -216.3     314.9%      -1534.1      -41.5%       1215.4     -1473.0        -313.7           734.4
                 Diluted EPS (Rs)                   -24.4        -5.9     314.9%        -41.8      -41.5%           3.5        -4.2          -0.9            2.1
                                                                                                                                 Source: Company, HDFC sec Research

                                                                                                                                                                 3
BHARAT HEAVY ELECTRICALS Ltd.
                Recent Developments
                Unchanged order book along with projects bagged in power and other sectors provides medium term visibility:
                The current situation has not impacted much on the order book of BHEL, despite a sharp decline of nearly 64% in the IIP (Index for
                Industrial Production) of capital goods. The total order book as on 30th June 2020 stood at Rs 1,08,126cr, out of which power sector is Rs
                86,603cr, industry sector Rs 13,447cr and, Rs 8,076cr is for International Operations. Up to Q1FY21, BHEL booked orders worth Rs 1,485cr,
                out of which power segment is Rs 982cr, industry segment Rs 444cr and remaining forming up the exports.

                BHEL is well placed with orders received in the power segment. The company had received 2x660 MW NTPC Talcher main plant package
                Fleet Mode Procurement of 12 nos. Steam Generators and reactor headers for 700 MWe PHWR Reactors by NPCIL, and many orders for
                FGD and boiler modifications. Tendering is in progress for 2x800 MW NTPC Singrauli; 2x800 MW NTPC Lara and 1x800 MW SCCL Adilabad
                extension and 2x660 MW Pench, MP. Tenders for FGD for around 34 GW, mostly from government utilities are also in advanced stage.
                Recently, the company has also tendered for the operation and maintenance (O&M) of NTPC’s 50 MW solar power plant at Ananthapur,
                Andhra Pradesh for a period of 11 months with an estimated cost of Rs 64.4lakh, the last date for submission of which is October 26,
                2020.

                In addition to domestic orders the company has also received orders from Bangladesh and Nepal. BHEL has received an export order of 2
                x 660 MW Maitree Super Thermal Power Project, Bangladesh, and a (4x225) MW Arun-3 Hydroelectric project, and a 40MW of Rahughat
                Hydro project in Nepal.

                Apart from power the company has bagged projects in other sectors as well. Amidst stiff competitive bidding, BHEL has won its first
                commercial order for state-of-the-art Battery Energy Storage Systems from The Energy and Resource Institute (TERI) where it is required
                to set up cumulative 410 kWh Battery Energy Storage Systems (BESS) in the National Capital Territory (NCT) of Delhi. BHEL’s scope of work
                in the contract includes design, supply, testing, installation & commissioning along with a comprehensive five-year AMC of the systems at
                three different locations.

                                                                                                                                                        4
BHARAT HEAVY ELECTRICALS Ltd.
                               102500

                                82500

                                62500

                                42500

                                22500

                                 2500
                                            FY15        FY16       FY17       FY18       FY19        FY20

                                        Total Order book in hand (Rs in cr)    Orders Receipts (Rs in cr)

                Cash focused operations leading to better cash collection, and cost reduction efforts will be a breather to the margins during the
                coming quarters:
                The company during FY20 worked with financial prudence, where it achieved its highest cash collection to billing ratio at 114% in the last
                10 years. It further increased to 133% during Q1FY21. It also brought down its total debtors at Rs 35,332cr from Rs 37,850cr Y-o-Y as on
                30th June 2020, with consolidated receivables coming down from Rs 12,011.9cr to Rs 7,108.6cr during the same time period. In an
                industry where receivable management is a concern, BHEL has managed to bring them down. The net provision creation during the year
                has been only Rs 255cr against Rs 1,836cr in the last year.

                BHEL is committed to generate better returns through institutionalized cost reduction efforts in a competitive environment. Mapping of
                operations to cash flows especially for top line has enabled the company to sustain its operations and end the year with positive cash
                balance of Rs 6,418cr during FY20. BHEL had been able to trim down its cash deficit at Rs 2,875cr during FY20 from Rs 3,855cr in FY19, and
                to Rs 523cr in Q1FY21 as against Rs 2175cr Y-o-Y. Loss generating from standalone operating cash flow has fallen by 25.5% during FY20
                from a loss of Rs 3881.5cr to a loss of Rs 2891cr Y-o-Y.
                Cash focused operations ultimately has helped the company retain its debt free status (0.2 D/E in FY20 standalone) in the times of overall
                liquidity crunch especially when the company is also channelizing timely liquidity for MSME and other vendors. At the end of Q1FY21,
                from total receivables, 48% are from state Govts, 33% from central Govt, 12% are from private players and 7% are from exports
                customers.
                                                                                                                                                        5
BHARAT HEAVY ELECTRICALS Ltd.
BHEL has taken various initiatives under the Atmanirbhar Bharat Abhiyan which will raise its competitive spree in the future and help
in creating comparative advantage over its peers:
Under the make in India plan the company has taken a three-pronged approach for maximum utilization of the current opportunities and
ensuring significant contribution to the national objective. These are a) In-house development and manufacture of items currently being
bought out/imported by the company b) In-house development and manufacture of major items in the country’s engineering imports
basket c) Working with global OEMs for manufacturing items for India as well as for exports, i.e., ‘Make in India, Make for the World’.
For e.g the company has taken up various initiatives for in-house development and manufacture of FGD and ACC items which was
previously being bought from China (~Rs 1000cr of raw material were sourced from China during FY19). The company has also turned
towards the domestic solar manufacturers for domestic procurement of panels for solar power plants. This will help the company combat
foreign dependency keeping FOREX related issues under check as well.
BHEL has formed a new business group – the “Make in India Business Development Group”. BHEL has also organized a workshop under
the aegis of Department of Heavy Industry, for promoting collaborations between PSUs- private industry as well as R&D institutions &
academia for development and manufacture of critical items for helping manufacturers to disentangle their supply chains from imports. In
a follow up to this workshop, BHEL is already engaged with interested parties/industry associations for taking this forward. All these
activities will boost the capacity utilisation of the company.
Long term Triggers
Strong market presence and diversification in other sectors bodes well for the company:
BHEL is the leading player in India's power and industrial/electrical equipment market and accounts for 53% of the country's installed
capacity of conventional power projects. It also contributes around 57% to the country’s thermal power generation. Cost competitiveness
and superior execution capability, support its dominant market presence and it is well poised to benefit from structural recovery in the
power sector.
Apart from power (~73% revenue contribution as of FY20, standalone), BHEL has over the years diversified into a range of engineering and
manufacturing activities for the core sectors of the economy which include transportation, defence, aerospace, water, oil & gas, etc., and
has been a leader in indigenous manufacturing in the country. To minimize power segment dominance the company is constantly looking
6BHARAT HEAVY ELECTRICALS Ltd.
for opportunities in other industries as well. BHEL & ICF jointly offered the first air-conditioned local train of Central Railway in passenger
service from Thane to Panvel, Mumbai, in January 2020. It has so far successfully commissioned nine Air-Conditioned ACEMU local trains
for Western Railway & Central Railway to provide metro like comfort for local commuters of Mumbai.
More than half of the traction equipment in locomotives & EMUs of Indian Railways has been supplied by BHEL. BHEL has commissioned
200+ electric substations and 5 major HVDC projects in the country. BHEL’s solar portfolio of more than 1.2 GW, spread across the country
includes ground mounted, rooftop, canal top and floating PV plants. BHEL is also one of the largest manufacturers and suppliers of power
transformers and electrical AC machines in the country. BHEL has been a major reliable supplier of critical equipment and services in
defence & aerospace sector for over three decades. Most of the satellites launched by ISRO are powered by BHEL manufactured solar
panels and lithium ion batteries.
BHEL has signed major international projects which once rolled out will help the company in diversifying its business in the long-run:
During FY20, BHEL floated Expression of Interest (EOI) in inviting Global OEMs to leverage on BHEL facilities & capabilities for setting up
manufacturing base in India where talks are majorly over technology, and few forming up JVs as well. Under this EOI, BHEL has signed
three MoUs with international majors in the fields of Maglev Train projects, Marine gas turbines for defence applications and Armoured
Trucks equipped with smart technologies.
Additionally to augment BHEL’s range and competitiveness, it has floated second stage of EOIs as well. It has floated EOIs on areas like
Metro Propulsion System, Railways Signaling, Track Machines for Railways as well as Air Defence Guns for collaborating for specific
technologies.
These projects are related to defense and transportation segment. Although, these MOUs are at their preliminary stages but, once these
fructify it will have great influence over its top-line and help in diversifying the company’s business.
What could go wrong :
Top-line & margins during FY21 are expected to remain subdued owing to the current COVID situation, and various projects still
remaining stalled, and execution being pushed afar creating a trickle-down effect on the company’s revenues. Margins in the power
7BHARAT HEAVY ELECTRICALS Ltd.
sector remain challenging, as the sector is characterised with defaults from SEBs especially Tamil Nadu Generation and Distribution
Corporation Limited (TANGEDCO) and Telangana State Power Generation Corporation Limited (TSGENCO).
Availability of labour is still an ongoing concern even though the company’s sites have started their operations from the month of
May.
Intense competition especially in the bidding process could lead to project loss.
Falling GDP, slow pick-up in demand, slower IIP figures have a direct impact on the power sector which is already impacting the
company as well.
Huge working capital requirement/intensity might deplete the company’s cash levels in the coming quarters. BHEL’s consolidated net
cash level has already dwindled down in recent years.
Dismal top-line (both consolidated & standalone) performance over the past five quarters with sales and margins dropping and low
project execution performance over the years are a few other concerns.
BHEL reported operational loss for second straight quarter in Q1FY21. Revenue growth stood red (expected on account of lockdowns)
for a 5th straight quarter. Order inflows recorded close to or more than 50% fall in inflows.
8.0% 16000
14000
6.0%
12000 10.0% 40000
4.0% 10000
5.0% 30000
2.0% 8000
0.0% 6000 0.0% 20000
FY15 FY16 FY17 FY18 FY19 FY20 4000 FY15 FY16 FY17 FY18 FY19 FY20
-2.0%
2000 -5.0% 10000
-4.0% 0
FY16 FY17 FY18 FY19 FY20 -10.0% 0
-6.0%
Standalone Sales (RHS; Rs in cr)
Standalone ROCE (%) Standalone ROE (%) Commissioning/Synchronization (MW) OPM (%)
S
Source: Company, HDFC sec Research
8BHARAT HEAVY ELECTRICALS Ltd.
About the company
Bharat Heavy Electricals Limited (BHEL) is an engineering and manufacturing company, with 190+ GW installed capacity globally. The
company is an integrated power plant equipment manufacturer, which is engaged in the designing, engineering, manufacturing,
constructing, testing, commissioning and servicing a range of products and services for various sectors, such as power, transmission,
industry, transportation, renewable energy, oil and gas, and defense. It operates in two segments: Power and Industry. In its Industry
segment, BHEL provides a portfolio of products, systems and services for power plants, power utilities, Oil and gas, metallurgical and
mining, and process industries, such as cement, fertilizers, sugar and paper.
In its Power segment, BHEL supplies steam turbines, generators, boilers and its auxiliaries approximately 1,000 Megawatt (MW); Gas
turbines and generators upto 299 MW unit size; Supplies hydro turbines and generators of approximately 400MW, and Manufactures
220/235/500/540/700MW nuclear turbine generator sets. It has 16 manufacturing units + 2 repair units + 8 service centres with
infrastructure to deal with 150+ project sites (across India and abroad).
Segmental Performance:
Particulars (Rs cr) Q1FY21 Q1FY20 YoY (%) Q4FY20 QoQ (%) FY20 FY19 YoY (%)
Segment Revenue
Power 1,119.4 3,491.5 -67.9% 3,174.7 -64.7% 14,960.4 23,405.0 -36.1%
Industrial 777.2 918.8 -15.4% 1,418.9 -45.2% 5,530.2 5,944.3 -7.0%
EBT
Power (568.0) (54.1) -949.2% (7.9) -7099.5% 804.3 2,812.2 -71.4%
Industrial (253.0) 34.9 -825.0% (371.2) 31.9% (205.8) 437.2 -147.1%
EBTM
Power -50.7% -1.6% -3172.6% -0.2% -20318.3% 5.4% 12.0% -55.3%
Industrial -32.5% 3.8% -957.1% -26.2% -24.4% -3.7% 7.4% -150.6%
Source: Company, HDFC sec Research
9BHARAT HEAVY ELECTRICALS Ltd.
Single Source with multiple solutions for Infrastructure & Industrial Segments:
Source: Company, HDFC sec Research
10BHARAT HEAVY ELECTRICALS Ltd.
Financials (Standalone):
Income Statement Balance Sheet
(Rs Cr) FY18 FY19 FY20 FY21E FY22E (Rs Cr) FY18 FY19 FY20 FY21E FY22E
Net Revenues 28925.7 30349.0 21486.1 20709.2 25013.0 SOURCE OF FUNDS
Growth (%) 4.9% -29.2% -3.6% 20.8% Share Capital - Equity 734.3 696.4 696.4 696.4 696.4
Operating Expenses 26992.8 28207.0 21718.9 20692.6 23587.3 Reserves 31866.8 30703.5 28484.8 27836.8 28069.8
EBITDA 1932.9 2142.0 -232.9 16.6 1425.7 Total Share-holders Funds 32601.1 31399.9 29181.2 28533.2 28766.2
Growth (%) 10.8% -110.9% -107.1% 8505.7% Long Term Debt 57.2 95.5 75.4 64.1 54.5
EBITDA Margin (%) 0.1 7.1% -1.1% 0.1% 5.7% Short Term Debt 0.0 2457.3 4933.4 5426.7 4070.0
Depreciation 786.4 474.8 502.9 530.2 567.3 Total Debt 57.2 2552.7 5008.8 5490.8 4124.5
EBIT 1146.5 1667.2 -735.7 -513.6 858.4 Non-Current Liabilities 8880.7 9864.9 9367.4 5772.7 6349.9
Other Income 693.1 677.6 580.6 505.3 525.3 TOTAL SOURCES OF FUNDS 41538.9 43817.5 43557.4 39796.7 39240.7
Interest expenses 254.6 286.9 507.0 518.3 417.4 APPLICATION OF FUNDS
PBT 1585.0 2057.9 -662.1 -526.7 966.3 Fixed Assets 3271.6 3202.4 3128.1 3534.7 3782.2
Tax 778.4 842.5 810.9 -213.0 231.9 LT Loans & Advances 84.3 82.8 83.2 158.1 192.2
RPAT 806.6 1215.4 -1473.0 -313.7 734.4 Other Non-Current Assets 17244.9 22790.9 25356.6 21687.0 17105.7
Growth (%) 50.7% -221.2% -78.7% -334.1% Total Non-current Assets 20600.8 26076.1 28567.9 25379.9 21080.0
EPS 2.2 3.5 -4.2 -0.9 2.1 Inventories 6258.8 8113.5 8905.5 12704.6 13267.5
Debtors 22771.5 12009.6 7107.6 7687.1 8201.7
Other Current Assets 2867.0 10713.5 10271.9 11299.1 12429.0
Cash & Equivalents 11291.2 7503.3 6418.6 4464.3 5122.6
Total Current Assets 43188.4 38339.9 32703.5 36155.1 39020.7
Creditors 10586.9 11375.1 8892.0 13267.5 11659.3
Current Liabilities 11663.4 9223.4 8822.0 8470.8 9200.8
Total Current Liabilities 22250.2 20598.5 17714.0 21738.2 20860.1
Net Current Assets 20938.2 17741.4 14989.5 14416.8 18160.6
TOTAL APPLICATION OF FUNDS 41538.9 43817.5 43557.4 39796.7 39240.7
Source: Company, HDFC sec Research
11BHARAT HEAVY ELECTRICALS Ltd.
Cash Flow Statement Key Ratios
(Rs Cr) FY18 FY19 FY20 FY21E FY22E FY18 FY19 FY20 FY21E FY22E
EBT 1585.0 2057.9 -662.1 -526.7 966.3 EBITDA Margin 6.7% 7.1% -1.1% 0.1% 5.7%
Depreciation 786.4 474.8 502.9 0.0 0.0 EBIT Margin 4.0% 5.5% -3.4% -2.5% 3.4%
Interest & Others 1849.8 1306.7 209.8 505.3 525.3 APAT Margin 2.8% 4.0% -6.9% -1.5% 2.9%
Change in working capital -3270.3 -7300.1 -2619.5 -1381.6 -3085.5 RoE 2.5% 3.9% -5.0% -1.1% 2.6%
Tax expenses 43.1 -420.7 -321.9 213.0 -231.9 RoCE 5.6% 6.9% -0.5% 0.0% 4.2%
CF from Operating activities 994.1 -3881.5 -2891.0 -1190.0 -1825.9 Solvency Ratio
Net Capex -281.3 -425.0 -434.5 -936.9 -814.8 Net Debt/EBITDA (x) 2.6 2.6 -17.8 3.9 0.0
Purchase/sale of inv 573.4 1735.3 1716.0 -0.1 5124.6 Net D/E (x) 0.0 0.1 0.2 0.2 0.1
Div & interest received 668.6 604.6 555.0 582.8 611.9 PER SHARE DATA
CF from Investing activities 960.7 1914.9 1836.5 -354.2 4921.7 EPS 2.2 3.5 -4.2 -0.9 2.1
Borrowings/repayments -50.4 875.1 2476.7 482.0 -1366.3 CEPS 4.3 4.9 -2.8 0.6 3.7
Interest Exp -583.3 -787.0 -504.6 -334.3 -501.4 BVPS 88.8 90.2 83.8 81.9 82.6
Dividends paid -37.3 -94.6 -310.4 -518.3 -417.4 DPS 1.8 2.0 0.0 0.8 1.2
CF from Financing activities -671.0 -6.5 1661.7 -370.6 -2285.1 Turnover Ratios (days)
Net Cash Flow 1283.8 -1973.1 607.3 -1914.7 810.8 Debtors (days) 298.4 149.4 126.6 95.6 102.0
Inventory (days) 82.0 100.9 158.6 158.0 165.0
One Year Price Chart Payables (days) 138.7 141.5 158.4 165.0 145.0
65
VALUATION
55
P/E (x) 13.0 8.2 -6.8 -31.8 13.6
45
35
P/BV (x) 0.3 0.3 0.3 0.3 0.3
25 EV/EBITDA (x) -0.4 2.3 -36.8 664.1 6.3
15 EV/Revenues (x) -0.0 0.2 0.4 0.6 0.4
Dividend Yield 6.4% 7.0% 0.0% 2.8% 4.2%
20-Jan-20
20-Oct-19
20-May-20
20-Oct-20
20-Nov-19
20-Dec-19
20-Feb-20
20-Mar-20
20-Apr-20
20-Jun-20
20-Aug-20
20-Jul-20
20-Sep-20
Source: Company, HDFC sec Research
Disclosure:
12BHARAT HEAVY ELECTRICALS Ltd.
I, Debanjana Chatterjee (Msc in Economics) (PGDM in Finance), authors and the names subscribed to this report, hereby certify that all of the views expressed in this research report accurately reflect our views about the subject issuer(s) or securities. HSL has no material adverse
disciplinary history as on the date of publication of this report. We also certify that no part of our compensation was, is, or will be directly or indirectly related to the specific recommendation(s) or view(s) in this report.
Research Analyst or her relative or HDFC Securities Ltd. does not have any financial interest in the subject company. Also Research Analyst or her relative or HDFC Securities Ltd. or its Associate may have beneficial ownership of 1% or more in the subject company at the end of the
month immediately preceding the date of publication of the Research Report. Further Research Analyst or her relative or HDFC Securities Ltd. or its associate does not have any material conflict of interest.
Any holding in stock – No
HDFC Securities Limited (HSL) is a SEBI Registered Research Analyst having registration no. INH000002475.
Disclaimer:
This report has been prepared by HDFC Securities Ltd and is meant for sole use by the recipient and not for circulation. The information and opinions contained herein have been compiled or arrived at, based upon information obtained in good faith from sources believed to be
reliable. Such information has not been independently verified and no guaranty, representation of warranty, express or implied, is made as to its accuracy, completeness or correctness. All such information and opinions are subject to change without notice. This document is for
information purposes only. Descriptions of any company or companies or their securities mentioned herein are not intended to be complete and this document is not, and should not be construed as an offer or solicitation of an offer, to buy or sell any securities or other financial
instruments.
This report is not directed to, or intended for display, downloading, printing, reproducing or for distribution to or use by, any person or entity who is a citizen or resident or located in any locality, state, country or other jurisdiction where such distribution, publication, reproduction,
availability or use would be contrary to law or regulation or what would subject HSL or its affiliates to any registration or licensing requirement within such jurisdiction.
If this report is inadvertently sent or has reached any person in such country, especially, United States of America, the same should be ignored and brought to the attention of the sender. This document may not be reproduced, distributed or published in whole or in part, directly or
indirectly, for any purposes or in any manner.
Foreign currencies denominated securities, wherever mentioned, are subject to exchange rate fluctuations, which could have an adverse effect on their value or price, or the income derived from them. In addition, investors in securities such as ADRs, the values of which are influenced
by foreign currencies effectively assume currency risk.
It should not be considered to be taken as an offer to sell or a solicitation to buy any security. HSL may from time to time solicit from, or perform broking, or other services for, any company mentioned in this mail and/or its attachments.
HSL and its affiliated company(ies), their directors and employees may; (a) from time to time, have a long or short position in, and buy or sell the securities of the company(ies) mentioned herein or (b) be engaged in any other transaction involving such securities and earn brokerage or
other compensation or act as a market maker in the financial instruments of the company(ies) discussed herein or act as an advisor or lender/borrower to such company(ies) or may have any other potential conflict of interests with respect to any recommendation and other related
information and opinions.
HSL, its directors, analysts or employees do not take any responsibility, financial or otherwise, of the losses or the damages sustained due to the investments made or any action taken on basis of this report, including but not restricted to, fluctuation in the prices of shares and bonds,
changes in the currency rates, diminution in the NAVs, reduction in the dividend or income, etc.
HSL and other group companies, its directors, associates, employees may have various positions in any of the stocks, securities and financial instruments dealt in the report, or may make sell or purchase or other deals in these securities from time to time or may deal in other securities
of the companies / organizations described in this report.
HSL or its associates might have managed or co-managed public offering of securities for the subject company or might have been mandated by the subject company for any other assignment in the past twelve months.
HSL or its associates might have received any compensation from the companies mentioned in the report during the period preceding twelve months from t date of this report for services in respect of managing or co-managing public offerings, corporate finance, investment banking
or merchant banking, brokerage services or other advisory service in a merger or specific transaction in the normal course of business.
HSL or its analysts did not receive any compensation or other benefits from the companies mentioned in the report or third pa rty in connection with preparation of the research report. Accordingly, neither HSL nor Research Analysts have any material conflict of interest at the time of
publication of this report. Compensation of our Research Analysts is not based on any specific merchant banking, investment banking or brokerage service transactions. HSL may have issued other reports that are inconsistent with and reach different conclusion from the information
presented in this report.
Research entity has not been engaged in market making activity for the subject company. Research analyst has not served as an officer, director or employee of the subject company. We have not received any compensation/benefits from the subject company or third party in
connection with the Research Report.
HDFC securities Limited, I Think Techno Campus, Building - B, "Alpha", Office Floor 8, Near Kanjurmarg Station, Opp. Crompton Greaves, Kanjurmarg (East), Mumbai 400 042 Phone: (022) 3075 3400 Fax: (022) 2496 5066
Compliance Officer: Binkle R. Oza Email: complianceofficer@hdfcsec.com Phone: (022) 3045 3600
HDFC Securities Limited, SEBI Reg. No.: NSE, BSE, MSEI, MCX: INZ000186937; AMFI Reg. No. ARN: 13549; PFRDA Reg. No. POP: 11092018; IRDA Corporate Agent License No.: CA0062; SEBI Research Analyst Reg. No.: INH000002475; SEBI Investment Adviser Reg. No.: INA000011538; CIN
- U67120MH2000PLC152193
Mutual Funds Investments are subject to market risk. Please read the offer and scheme related documents carefully before investing.
13You can also read