Investor Presentation - Alerion Clean Power

Page created by Laurie George
 
CONTINUE READING
Investor Presentation - Alerion Clean Power
0

Investor Presentation
March 2021
Investor Presentation - Alerion Clean Power
1
DISCLAIMER (1/2)

THIS PRESENTATION AND ANY OTHER INFORMATION DISCUSSED AT THE PRESENTATION (THE “PRESENTATION”) IS STRICTLY CONFIDENTIAL AND IS BEING PROVIDED TO YOU SOLELY FOR YOUR INFORMATION. THIS
PRESENTATION, WHICH HAS BEEN PREPARED BY ALERION CLEAN POWER S.P.A. (THE “COMPANY”), IS PRELIMINARY IN NATURE AND IS SUBJECT TO UPDATING, REVISION AND AMENDMENT. THIS PRESENTATION MAY NOT BE
REPRODUCED IN ANY FORM, FURTHER DISTRIBUTED OR PASSED ON, DIRECTLY OR INDIRECTLY, TO ANY OTHER PERSON, OR PUBLISHED, IN WHOLE OR IN PART, FOR ANY PURPOSE. ANY FAILURE TO COMPLY WITH THESE
RESTRICTIONS MAY CONSTITUTE A VIOLATION OF APPLICABLE LAWS AND VIOLATE THE COMPANY’S RIGHTS.

This Presentation is being made available to a limited number of recipients solely for the purpose of introducing the Company. This Presentation does not, and is not intended to, constitute or form part of, and should not be construed as, an offer to sell, or a
solicitation of an offer to purchase, subscribe for or otherwise acquire, any securities of the Company, nor shall it or any part of it form the basis of or be relied upon in connection with or act as any inducement or recommendation to enter into any contract or
commitment or investment decision whatsoever. Neither this Presentation nor any copy of it nor the information contained herein is being issued or may be distributed or redistributed directly or indirectly to or into any jurisdiction where such distribution would
be unlawful, including but not limited to, the United States, Canada, Australia and Japan. Any decision to invest in the Company should be made solely on the basis of information contained in any prospectus or offering circular or offering document of any
kind (if any is published by the Company), which would supersede this Presentation in its entirety.

None of the Company or any of its partners, directors, officers, employees, agents, other representatives, consultants, legal counsel, accountants, financial or other advisors, auditors, direct or indirect shareholders, subsidiaries or other affiliates or any other
person acting on behalf of any of the foregoing (collectively, the “Representatives”) makes any representation or warranty, expressed or implied, as to the fairness, quality, accuracy, relevance, completeness or sufficiency for any purpose whatsoever of any
information contained in this Presentation.

By attending or otherwise accessing this Presentation, you acknowledge and agree not to be entitled to rely on the fairness, quality, accuracy, relevance, completeness or sufficiency for any purpose whatsoever of the information contained herein and that
none of the Company or any of its Representatives will have any liability relating to, or resulting from, this Presentation, its inaccuracy or incompleteness, or the use of, or reliance upon, this Presentation.

By attending or otherwise accessing the Presentation, you acknowledge and agree that you will be solely responsible for your own independent evaluation and assessment of the Company and of the information contained in this Presentation and will rely
solely on your own judgment and that of your qualified advisors in evaluating the Company and in determining the desirability of the possible acquisition of an interest in the Company.

To the extent applicable, the industry and market data contained in this Presentation has come from official or third-party sources. Third-party industry publications, studies and surveys generally state that the data contained therein have been obtained from
sources believed to be reliable, but that there is no guarantee of the fairness, quality, accuracy, relevance, completeness or sufficiency of such data. The Company has not independently verified the data contained therein. In addition, certain of the industry
and market data contained in this Presentation come from the Company’s own internal research and estimates based on the knowledge and experience of the Company’s management in the market in which the Company operates. Such research and
estimates, and their underlying methodology and assumptions, have not been verified by any independent source for accuracy or completeness and are subject to change without notice. Accordingly, undue reliance should not be placed on any of the
industry or market data contained in this Presentation.

The highlights of the Company and the outlook presented in this Presentation represent the subjective views of the management of the Company and are based on significant assumptions and subjective judgments which may or may not prove to be correct.
Industry experts, business analysts or other persons may disagree with these views, assumptions and judgments, including without limitation the management’s view of the market and the prospects for the Company.

This Presentation may include statements that are, or may be deemed to be, forward-looking statements. Forward-looking statements typically use terms such as “believes”, “projects”, “anticipates”, “expects”, “intends”, “plans”, “may”, “will”, “would”, “could” or
“should” or similar terminology. Any forward-looking statements in this Presentation are based on the Company’s current expectations and, by their nature, forward-looking statements are subject to a number of risks and uncertainties, many of which are
beyond the Company’s control, that could cause the Company’s actual results and performance to differ materially from any expected future results or performance expressed or implied by any forward-looking statements. The Company undertakes no
obligation to release the results of any revisions to any forward-looking statements in this Presentation that may occur due to any change in its expectations or to reflect events or circumstances after the date of this Presentation and the Company and its
Representatives disclaim any such obligation.
Investor Presentation - Alerion Clean Power
2
DISCLAIMER (2/2)

Except where otherwise indicated, this Presentation speaks as of the date hereof and the information and opinions contained in this Presentation are subject to change without notice and do not purport to contain all information that may be required to
evaluate the Company. The information in this Presentation is in preliminary form and has not been independently verified. The Company and its Representatives undertake no obligation to provide the recipients with access to any additional information or to
update or revise this Presentation or to correct any inaccuracies or omissions contained herein that may become apparent. To the fullest extent permissible by law, such persons disclaim all and any responsibility or liability, whether arising in tort, contract or
otherwise, which they might otherwise have in respect of this Presentation. Recipients should not construe the contents of this Presentation as legal, tax, regulatory, financial or accounting advice and are urged to consult with their own advisers in relation to
such matters.

These materials are not an offer for sale of securities in the United States. The Company does not intend to register under the US Securities Act of 1933, as amended (the “Securities Act”), or with any securities regulatory authority of any state or other
jurisdiction of the United States, and securities of the Company may not be offered, sold, resold, pledged, delivered, distributed or transferred, directly or indirectly, into or within the United States except pursuant to an exemption from, or in a transaction not
subject to, the registration requirements of the Securities Act and in compliance with any applicable securities laws of any state or other jurisdiction of the United States.

The Company does not intend to make any public offering of its securities in the United States. Any securities shall not be offered and sold within the United States and it is intended that any offering will comprise only an institutional offering outside the
United States in reliance on Regulation S under the Securities Act (“Regulation S”).

This Presentation is only addressed to and is only directed at: (a) in the European Economic Area, persons who are “qualified investors” within the meaning of the Prospectus Regulation (2017/1129/EU) as amended and to other categories of investors so
that exemptions from the provisions on public offering of financial instruments apply, whether due to the amount of such offering or to the qualification of the recipients, (b) in Italy, “qualified investors”, as defined by Article 34-ter, paragraph 1(b), of CONSOB’s
Regulation No. 11971/1999 and integrated by Article 35, paragraph 1(d) of CONSOB Regulation No. 20307/2018, as amended, and other persons to whom it may lawfully communicated, and (c) in the United Kingdom, (i) “investment professionals” as
defined in Article 19(5) of the Financial Services and Markets Act 2000 (Financial Promotion) Order 2005 (as amended, the “Order”), (ii) persons falling within Article 49(2)(a) to (d) (“high net worth companies, unincorporated associations etc.”) of the Order or
(iii) persons to whom an invitation or inducement to engage in investment activity (within the meaning of section 21 of the Financial Services and Markets Act 2000) in connection with the issue or sale of any securities may otherwise lawfully be communicated
or caused to be communicated (all such persons together being referred to as “relevant persons”). This Presentation is directed only at relevant persons and must not be acted on or relied on by persons who are not relevant persons. Any potential investment
or investment activity to which this Presentation relates is only available to relevant persons and will be engaged in only with relevant persons.

By attending or otherwise accessing this Presentation, you warrant, represent, undertake and acknowledge to the Company that (a) you have read and agree to comply with the foregoing limitations and restrictions including, without limitation, the obligation
to keep this Presentation and its contents confidential, (b) you agree to treat this Presentation and its content as strictly private and confidential and to take all necessary steps to preserve such confidentiality, (c) you are able to receive this Presentation
without contravention of any applicable legal or regulatory restrictions.

By attending or otherwise accessing this Presentation, you agree to be bound by the foregoing limitations. Any failure to comply with these restrictions may constitute a violation of the laws of any such other jurisdiction. Any potential investment or investment
activity to which this Presentation relates is available only to persons eligible to invest in securities and will be engaged in only with such persons.
Investor Presentation - Alerion Clean Power
3
AGENDA FOR TODAY

    1   Introduction to Alerion Clean Power

         2    Alerion Today: 750MW Italian Wind Player

               3   FY2020 Highlights and Review of Alerion Historical Performance

                     4   Strategy 2021-2023: Growing to a 1.5GW European RES Player

                           5    Closing Remarks
Investor Presentation - Alerion Clean Power
4
TODAY’S SPEAKERS

           JOSEF GOSTNER                 GEORG VAJA                      PATRICK PIRCHER              STEFANO FRANCAVILLA

           ◼   Chairman and CEO of       ◼   Deputy Chairman,            ◼   Executive Director of    ◼   CFO of Alerion
               Alerion and CEO and           Executive Director of           Alerion and Head of      ◼   Joined Alerion in 2007
               Vice-Chairman of Fri-El       Alerion and CFO of Fri-El       Finance of Fri-El
                                                                                                      ◼   Graduated in Business
           ◼   Previous experience in    ◼   Graduated in Business       ◼   Graduated in Business        Administration at Bocconi
               several Energy and Real       Administration at               Administration at            University
               Estate companies              University of Innsbruck         Bocconi University
                                                                                                      ◼   Previous experience in
                                         ◼   Previously CEO of           ◼   Previous experience in       London and Milan in
                                             Röchling Automotive             GE Capital and SEB           PwC, Enel and ERG
                                             Leifers                         Merchant Banking             Renew
Investor Presentation - Alerion Clean Power
1   Introduction
    to Alerion Clean Power
Investor Presentation - Alerion Clean Power
6
ALERION AT-A-GLANCE
LEADING RENEWABLE ENERGY PLAYER, OWNER AND OPERATOR IN ITALY

                                         COMPANY OVERVIEW                                                            KEY FIGURES
◼     Established in 2003, Alerion Clean Power S.p.A. (“Alerion”) is one of the main
      independent players, owners and operators active on onshore wind in Italy and other
      European markets                                                                           €   109.3M     +52%
                                                                                                                vs.2019A
                                                                                                                           €   81.1M        +50%
                                                                                                                                            vs.2019A
                                                                                                 REVENUES                  EBITDA
    – The company is headquartered in Milan and is listed on the Milan Stock Exchange
                                                                                                 2020A                     2020A
◼     Alerion currently owns an onshore wind farm portfolio of 751 MW gross capacity
      composed of:
    – 21 SPVs in Italy with a gross capacity of 703 MW                                           €71.8M                    €   53.9M
    – 1 SPV in Spain with a gross capacity of 36 MW                                              REVENUES                  EBITDA
                                                                                                 2019A                     2019A
    – 1 SPV in Bulgaria with a gross capacity of 12 MW
◼     Visible growth opportunity with 3.8 GW of Pipeline, of which 835 MW considered in
      the Plan 2021-2023
◼     Group activities mainly include operation and management of onshore wind farms and         21
                                                                                                 Italian SPVs
                                                                                                                           2
                                                                                                                           Other EU SPVs1
      sale of electricity produced by those wind farms on the free market or through bilateral
      contracts
◼     Alerion is majority owned by Fri-El Green Power S.p.A. (“Fri-El”) with an 88.4% stake
◼     Alerion employed 33 people as of 31st December 2020
    – Highly qualified and dynamic team with relevant experience in the renewable energy
                                                                                                 703MW
                                                                                                 GROSS
                                                                                                                           48MW
                                                                                                                           GROSS
      sector                                                                                     CAPACITY                  CAPACITY

Note: 1 Exclude 1 SPV in Romania that currently does not own assets
Investor Presentation - Alerion Clean Power
7
MORE THAN 25 YEARS OF SUCCESS IN THE RENEWABLE INDUSTRY

                                                                                                                                              Alerion Clean Power Stock Price (€)

       1994                 2002-2008                 2010-2011

  Gostner brothers          Fri-El Green       Construction of the
  founded Ener.CO        Power signs a joint   first solid biomass
  S.r.l., specializing         venture            site in Sicily, in
    in production,       partnership with        collaboration with
    purchase and           EDF Énergies            RWE (2010);
    distribution of      Nouvelles (2002);         GAR Group              2016
       electricity         Fri-El Green         acquires a 50%         Fri-El acquires         2017               2018                      2019                        2020                      2021
                         Power signs a joint    stake of the liquid    a 29% stake in
                              venture            biomass plant in      Alerion at €2.6
                         partnership with      Acerra, granting raw       per share
                         RWE Innogy Italia       material supply
                              (2008)                  (2011)                             Fri-El acquires    Capital increase of      Acquisition of 36MW         Acquisition of 120MW        Agreement for the
                                                                                             control of         €25M with the         Spanish wind farm            Italian wind farms         development of
                                                                                         Alerion through        contribution of      Comiolica (June 2019);      Ricigliano, Grottole and   200MW PV plants in
                                    2003                                                  a tender offer,   3 project companies    Acquisition of 70MW Italian           Anglona             Romania (of which
                                                                                         reaching a 84%      (102 MW) by Fri-El,     wind farm Campidano            (February 2020);         33MW will come in
                                                                                               stake        which reached a 86%          (August 2019);                                      operation in 1H21);
                                                                                                               stake in Alerion;                                 Acquisition of 49% of
                                                                                                                                   Acquisition of 50MW Italian     67MW Italian wind            Wind farm in
                                                                                                              Repayment of the        wind farm Regalbuto         farms Ururi, Anzi and     Cerignola (12.6MW)
                                                                                                              existing bond and        (November 2019);          San Basilio from Fri-el,    awarded incentive
                            Alerion was established                                                         issuance of a €150M                                  that reached a stake of    tariff of 68.5€/MWh
                                                                                                                 retail bond       Issuance of a €200M green                                for 20 years in GSE
                                                                                                                                     bond (December 2019)             88% in Alerion
                                                                                                                                                                    (December 2020)                 auction
Investor Presentation - Alerion Clean Power
8
FRI-EL GROUP OVERVIEW
LEADING ITALIAN OPERATOR SPECIALIZED IN THE PRODUCTION OF RENEWABLE ENERGIES

                                                                                                                           Gross Installed Capacity:
                                                                                                                                  1,074 MW
 Administrative services

                                                                        RENEWABLE TECHNOLOGIES
                                                                    Number of SPVs and gross installed capacity
                                                                                                                                                           OTHER

                                WIND ONSHORE                                          BIOGAS AND BIOMASS                               HYDRO

                                                          23 SPVs                     23 SPVs         Liquid       1 SPV                        2 SPVs      O&M
                                                          751 MW           Biogas                                             Hydro
                                                                                       23 MW          Biomass     75 MW                           7 MW

                                                                                                                                                           ENERGY
                                                                                                                                                            TRADE
                                                           5 SPVs                                     Solid        1 SPV
                                                          200 MW                                      Biomass     19 MW                                    WIND & PV
                                                                                                                                                         DEVELOPMENT

                                                28 SPVs                                              25 SPVs                                2 SPVs        WASTE TO
                              Total                                                     Total                                      Total                   ENERGY
                                                951 MW                                               116 MW                                  7 MW

        Main Intercompany services1
Note:1 Please   see appendix for more information
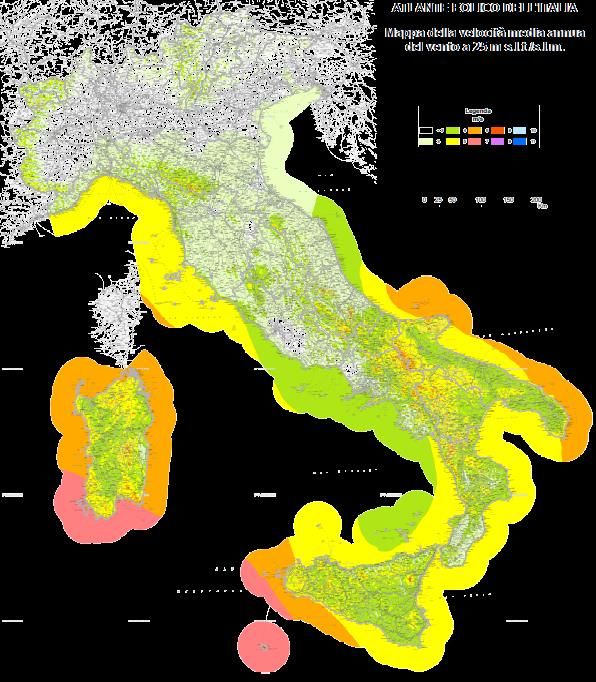
Investor Presentation - Alerion Clean Power
9
WIND FARM PORTFOLIO OVERVIEW
HIGH-QUALITY ASSET PORTFOLIO LOCATED IN 7 ITALIAN REGIONS AND 2 OTHER EUROPEAN COUNTRIES

                          ITALIAN AND OTHER EU WIND FARMS                                                                              GEOGRAPHICAL OVERVIEW
                                    Number of                Gross
                                                                       Net Capacity   Avg prod.                                                                                      SPAIN
 Plant Location                     Operating               Capacity                                  ITALY
                                                                           (MW)       L3Y (GWh)                                                                                      Comiolica
                                      SPVs                   (MW)
 Apulia                                    2                     78        78            125                                                   EMILIA ROMAGNA
                                                                                                                                               Albareto

 Basilicata                                2                     70        62            138                                                 MOLISE
                                                                                                                                             San Martino in Pensillis
 Campania                                  5                    131        124           167                                                 ‘Ururi

 Emilia Romagna                            1                     20        20            18                                                                 APULIA
                                                                                                       SARDINIA                                             Ordona
                                                                                                        Villacidro                                          San Marco in Lamis
 Molise                                    2                     84        42            155          Campidano
                                                                                                                               CAMPANIA
                                                                                                                               Ciorlano
                                                                                                      Nulvi-Tergu              Albanella
 Sardinia                                  4                    155        140           259          San Basilio                                                BASILICATA          BULGARIA
                                                                                                                               Lacedonia                                             Krupen
                                                                                                                                                                 Grottole
                                                                                                                               Ricigliano
                                                                                                                                                                 Anzi
 Sicily                                    5                    164        160           234                                   Morcone-Pontelandolfo

                                                                                                                                                          SICILY
      Italy                               21                    703        625          1,096                                                             Agrigento
                                                                                                                                                          Callari
                                                                                                                                                          Castel di Lucio
      Spain                                1                     36        36            92                                                               Licodia
                                                                                                                                                          Regalbuto

      Bulgaria                             1                     12         6            24                          ITALIAN                                                     OTHER EU
                                                                                                                                                  GROSS                                                 GROSS
                                                                                                       21            WIND            703MW        CAPACITY
                                                                                                                                                                        21       WIND            48MW   CAPACITY
                                               1                                                                     SPVs                                                        SPVs
 Total                                    23                    751        667          1,212
                                                                                                1   Italian Wind SPVs            Other EU Wind SPVs

Note: 1 Exclude 1 SPV in Romania that currently does not own assets
10
SOLID REFERENCE SHAREHOLDERS, EXPERIENCED INDUSTRIAL PARTNER AND
MANAGEMENT TEAM

  FRI-EL SHAREHOLDING STRUCTURE                                            FRI-EL KPIs                           ALERION’S MANAGEMENT TEAM

                                                                              Wind 951MW
                                                                                                                                                          STEFANO
                                                                                                             JOSEF GOSTNER          GEORG VAJA          FRANCAVILLA

                                                                Biogas 23MW                  Hydro 7MW       President & CEO      Executive Director         CFO
                                                                                                                                   & Vice President

                                                             Liquid Biomass 75MW        Solid Biomass 19MW                                                 PIETRO
                                                                                                             PATRICK PIRCHER
                                                                                                                                                         MAURIELLO
                                                                                                                                   LORENZO LODI              Wind
                                                                              1,074 MW                       Executive Director       RIZZINI          Development Italy
                                                                       Gross Installed Capacity1                                         COO

Note: 1 Includes full consolidation of Alerion Clean Power
11
ALERION ESG SUSTAINABILITY FRAMEWORK
COMMITMENT TO SOCIAL AND GOVERNANCE SUSTAINABLE TARGETS1

                                                                                                                                                    SOCIAL
                                                                                                                          ◼    Strong support of local communities thanks to:

                               ENVIRONMENT                                                                                     —   Investment into projects related to social issues
                                                                                                                               —   Employment of local people and promotion of local
   ◼      Total emissions avoided every year thanks to                                                                             young talent
          Alerion’s wind generation fleet equal to 750,314
                                                                                                                                   ◼   Focus on development and promotion of diversity
          Tons of CO2, 1,667 Tons of NOx and 1,556 of SO2
                                                                                                                                       and work-life balance amongst employees
   ◼      The CO2 emissions avoided are equivalent to the
          reforestation of 135,192 hectares every year

   ◼      1.1TWh of renewable energy produced in 2020
          equal to the consumption of 411,695 families2                                                                                            GOVERNANCE
                                                                                                                                       ◼   Increased number of independent directors from 4
                                                                                                                                           to 6

                                                                                                                                       ◼   Increased board gender equality from 80%-20% to
                                                                                                                                           50%-50%

Notes:1 Represented in the labels the United Nations Sustainable Development Goals which Alerion committed to
implement within its strategy. 2 Assuming an average of 3 people per family and a consumption of 2,700kWh / year per
family, the number is equivalent to reaching the annual domestic energy needs of a city with more than 1 million inhabitants
2
    Alerion Today:
    750MW Italian Wind
    Player
13
ALERION TODAY: 750MW ITALIAN WIND PLAYER

             Leading Renewable Player with a Focused Strategy
             in a Growing Market

       Growth and Operational Excellence Underpin
       Strong Profitability

     835MW of Visible Near-Term Growth

       Solid Reference Shareholders, Experienced
       Industrial Partner and Management Team

             Platform to Deliver Next Stage of Value Creating Growth
14
LEADING RENEWABLE PLAYER WITH A CLEAR AND FOCUSED STRATEGY

                                                                                 ITALIAN WIND GROSS INSTALLED CAPACITY (MW)

        1.093        1.093
                                              971                                Capacity CAGR
                                                                                2017–2020: +34%
                                   854
                                                             772      771
                                                                                               703

                                                                                                                       475
                                                                                                                                                393
                                                                                                             362                      345
                                                                                     294                                                                                 307            292      292            282       282              272   272
                                                                                                                                                               238

                                                    1                                                                      2

                                                                                                          2017          Latest Public Information

 ◼    Leading industrial player in Italy with disciplined investment approach and focused geographical exposure
 ◼    Ambitous growth plan to enhance its leading positioning in the Italian onshore wind market with further country and technology diversification
Source: ANEV, Public information.
Notes:. 1 Edison adjusted data to consider the recent transaction of buy-back of E2i’s 70% stake and the assets acquired from EDF Energies Nouvelles. 2 RWE adjusted data to consider the acquisition of E-ON wind generation activities
15
OPERATIONAL EXCELLENCE IN ITALY DRIVES CONTINUOUSLY IMPROVING
PERFORMANCE

    AVERAGE ANNUAL WIND SPEED MAP                                                               ALERION’S O&M COSTS/MW LOWER
     AT 25 METERS ABOVE SEA LEVEL                ALERION’S TURBINE SUPPLIERS (2020)                THAN NATIONAL AVERAGE

                                                                                               €k/MW
                                                                         1          1
                                                                         4%         4%
                                                            2
                                                            9%

                                                      2
                                                      9%

                                                                                                ◼   Alerion leverages on FRI-EL deep
                                                                                         17         industrial experience to perform in-
                                                                                         74%        house O&M services
   Legend (m/s)                                      Number of SPVs                             ◼   Main benefits include lower costs, direct
                                                                                                    control over maintenance and higher
                                                 %   Share of the total portfolio                   performance and availability

Source: RSE and independent market consultants
16
STRONG GROWTH OUTLOOK FOR RENEWABLES IN EUROPE AND ITALY
SUSTAINED BY REDUCING LEVELIZED COST OF ENERGY (LCOE)
                               GROSS INSTALLED CAPACITY IN ITALY – GW                                                                EUROPEAN AND ITALIAN REGULATORY FRAMEWORK

                                                                              Wind power representing a                              ◼   In December 2018, the new revised Renewables energy
300                                                                           great opportunity for future                               directive (2018/2001) entered into force – establishing a new
                                                                               Italian energy landscape                                  binding renewable energy target for the EU for 2030 of at least
                                                                                                                           16 GW         32%
250
                                                                                                                                     ◼   In January 2020, the Integrated National Energy and Climate
                                                                                                                           43 GW
                                                                                                                                         Plan defined the Italian targets to be reached by 2030: 30% of total
200                                                                                                                                      energy demand and 55% of electricity demand from renewable
                                                                                                                                         sources - Clause for a possible upwards revision by 2023
                                                                           26 GW
                                                                                                                                     EMEA LCOE FOR DIFFERENT TECHNOLOGIES (€/MWH)
150
                                                                                                                       149 GW
                                                                           46 GW

100                                                                                                                                                                                     Italy LCOE range
        86 GW                            53 GW
                                                                           64 GW
                                         10 GW
 50     7 GW                                                                                                               23 GW
        16 GW                            21 GW
                                                                           20 GW
        17 GW                            19 GW                                                                             40 GW
        12 GW                            14 GW                             21 GW
  0                                                                                                                                                                                   Expected
      2010          2015             2020             2025             2030             2035      2040          2045          2050                                                   LCOE Trend

                           Other Renewables                  Hydro              Solar          Wind          Traditional

Source: Bloomberg New Energy Finance, Terna statistical report, Company Information
17
TECHNOLOGICAL IMPROVEMENTS LEAD TO SUPERIOR FUTURE PERFORMANCE

                                      2010                                                                                      Today

                Turbine Size (MW)       2.0                           3.0                          4.0                           5.5      +2.5x

                Diameter (m)            ~80                          ~100                          ~125                         ~160      +2.0x

                Swept Air (sqm)       ~5,000                        ~8,000                       ~12.000                       ~20,000    +4.0x

                Capex / MW (€k)       ~1,000                         ~900                          ~800                         ~650      -35%

                Capex / MW (€k)       ~5,000                                                                                    ~600      -88%

 Pipeline set to deliver superior production performance by leveraging best in class technology available while progressively reducing Capex / MW
Source: Company Information
18
PLATFORM TO DELIVER NEXT STAGE OF VALUE CREATING GROWTH

                                                                                                                                                                                                   INSTALLED CAPACITY GROWTH (MW)
                                                                             PIPELINE: Leveraging on Alerion’s platform exceeding
                                                                                                                                                                                                                                                          >2GW
                                                                             1.5GW in 2023 to pursue further growth opportunities
                                                                                                                                                                                                                                         ~

                                                                                                                                                                                                                          ~

                                                                                                 PARTNERSHIPS: Support of third-party
                                                                                                 capital to optimise balance sheet and returns

                                                                                                                                                                                        ENVIRONMENTAL IMPACT OF REPOWERED PLANTS

                                                                                                 REPOWERING AND REVAMPING:                                                              A 11MW wind park made up of only 2 turbines of 5.5 MW
                                                                                                 Untapped and visible growth to be derived from                                         (instead of 17 turbines of 0.66MW) reduces the dimension
                                                                                                                                                                                        of the field up to 88%1
                                                                                                 repowering and revamping of its current fleet –
                                                                                                 strategy to be implemented post 2023

                                                                             BATTERIES: Production optimization through
                                                                             installation of batteries in order to store production
                                                                             and achieve better pricing - strategy to be
                                                                             implemented post 2023
Notes: 1 The reduction of the dimension of a field has consequently additional positive consequences (on top of the overall increased production): (i) Lower environmental constraints in terms of lower land usage, basement installations, cable connections, visual
impact; (ii) Lower operating costs, due to lower rental fees (in land) lower transport costs (also on the maintenance for each turbine), lower insurance costs
19
LEADING RENEWABLE PLAYER WITH A CLEAR AND FOCUSED STRATEGY
                                                          2021-2023 BP PILLARS

                          Growth: Target 1.5GW by 2023, with average additions p.a. >250MW

                          Diversification: Access to selected attractive markets and technologies (solar)

                          Returns Discipline: Selective approach to potential projects targeting 8% to 12% Project IRR

      >2x Installed       Industrial know-how: Proven development capabilities coupled with in-house O&M expertise
      RES Capacity
       in 3 years         Opportunistic M&A: Selective M&A growth to take advantage of market opportunities

                          Yield to shareholders: up to 50% target dividend pay-out ratio to be decided year by year

                                           LONG TERM VISION: PATH TO 2030 AND BEYOND

                          Continued Growth: Accelerate growth targeting 400MW additions per year
                          Further Diversification: Selective approach to new opportunities to retain a clear and
                          focused strategy
                          Partnerships: Support of third party capital to optimise balance sheet and returns

                          Significant Improvement in Fleet Production: Through repowering and revamping of
                          existing fleet and installation of batteries
3
    FY2020 Highlights
    and Review of Alerion
    Historical Performance
21
2020 BUSINESS HIGHLIGHTS

                              STEADY GROWTH IN 2020 UNDERPINNED BY A SOUND OPERATIONAL PERFORMANCE

                                   OPERATIONAL HIGHLIGHTS
                                   Installed capacity: ~751 MW (564 MW as of 31st December 2019), +33%
                                   Annual production: >1 TWh (0.7 TWh in 2019), +60%

                                   FINANCIAL HIGHLIGHTS
                                   Revenues: € 109.3 M (€ 71.8 M in 2019), +52% | EBITDA: € 81.1 M (€ 53.9 M in 2019), +50%
                                   Net Profit: € 31.6 M(€ 21.4 M in 2019), +48% | Net Financial Debt: € 491.0 M (€ 407.2 M in 2019)

Source: Company Information
22
PROVEN TRACK-RECORD OF GROWTH

                                                                                                                                                                                                     ▪   Anzi (16)
    Wind Parks                                                                                                                                                                                       ▪   Grottole (54)
                                                        ▪ Villacidro (31)                                                    ▪ Fri-El Campidano (70)
     Additions                                                                                                                                                                                       ▪   Nulvi-Tergu (30)
                                                        ▪ Morcone-Pontelandolfo (52)                                         ▪ Regalbuto (50)
  (Gross Installed                                                                                                                                                                                   ▪   S. Basilio (25)
                                                        ▪ Albareto (20)                                                      ▪ Comiolica (36)
   Capacity - MW)                                                                                                                                                                                    ▪   Ururi (26)
                                                                                                                                                                                                     ▪   Ricigliano (36)

  SPVs (#)                                               11                                                                  14                                                                  17                         23

Investment
Capex1 (€M)
                                                        0.5                                                                70.8                                                               143.6                         77.9

Source: Company Information
Notes: 1 Including both development and M&A Capex, net of cash and debt acquired. Calculated as Cash Flows used in investing activities, net of dividends from companies measured at equity method
23
HISTORICAL KEY FINANCIALS HIGHLIGHTS IN CONTEXT
(€M)

                                                      TOTAL REVENUES                                                               EBITDA1
                                                                                                       EBITDA
                                                                                                                  76.5%      76.9%           75.1%   74.2%
                                                                                                       Margin

                                                                                                109
                                                                                          72                                                          81
                        55                               59                                                                                   54
                                                                                                                   42         45

                     2017A                           2018A                            2019A    2020A              2017A      2018A           2019A   2020A

                                           NET RESULT FOR THE YEAR                                                        NET FINANCIAL POSITION
                                                                                                       Leverage    4.1x       5.0x            7.6x    6.1x

                                                                                                32
                                                                                                                                                      491
                                                                                          21                                                  407

                                                                                                                   174         227
                          5                               3

                     2017A                           2018A                            2019A    2020A              2017A       2018A          2019A   2020A
Source: Company Information.
Notes: 1 Includes consolidated EBITDA and income from JVs accounted using the equity method
24
GROSS FINANCIAL DEBT COMPOSITION

                    Gross Financial Debt Breakdown                      Gross Financial Debt Maturity (€M)

                              Bank Debt   Other Financial
                                 3%          Debt 2%                                                     482
                Leases 8%

                                  Gross Debt:
                                    €625M
                                                                   87
       Project
                                                                                  32          25
      Financing                                       Bonds 56%
         31%
                                                                  2021           2022        2023     Beyond 2023

Source: Company Information
4
    Strategy 2021-2023:
    Growing to a 1.5GW
    European RES Player
26
835MW OF VISIBLE NEAR-TERM GROWTH

                                                             ALERION HAS IDENTIFIED A HIGH-QUALITY PIPELINE OF RES PROJECTS

                                                                                                                 Operating in Acquisition 9%

                                                                                       Early Stage Development                 Under Construction    ◼   835MW of high-quality near-term
                                                                                                 26%                                  7%                 projects identified across wind and
                                                                                                                                                         solar in Europe
                                                                                                                                    Ready to Build
                                                                         Near-Term Projects                                             12%
                                                                          to 2023: 835MW
                                                                                                                                                     ◼   Alerion is committed to projects with
                                                                                                                                                         premium positioning both in terms
                                                                                                                              Advanced Stage             of project returns and resource
                                                                                                                             Development 47%
                                                                                                                                                         availability

                                                                                   Excess Pipeline in
                                                                                  Development: >3GW              Selective approach based on         ◼   New additions consist of best-in-
                                                                                                                  minimum level of operating             class equipment to provide
                                                                                                                    hours and project IRR                superior profitability and asset
                                                                                                                                                         duration

Notes: Please refer to page 27 for detailed definitions of the various stages of development.
27
FROM AN ITALIAN ONSHORE WIND TO A EUROPEAN RES PLAYER (WIND + PV)

                                                                                                                                                                               >3GW
                                                                                                                                                                              Excess pipeline
                    2020                                                                                    +835 MW                                                2023
                                                                                                      Cumulative 21-23 Capacity
                                                                                                             Additions

                                  100%                                                                                                                     19%                    81%
                                                                                                                                                                      ~1.5        Wind
                                    Wind                                                                                                                   Solar          1
                                                                                                                                                                      GW
                     ~751                                                                                                                      +255MW
                     MW
                                                                                                   +221MW                                      +200MW
                                                              +59MW                                                                                                1%
                                                                                                   +100MW                                                      6% Bulgaria
                                                                                                                                                              Spain
                                                                                                                                                                              64%
                                                                                                                                                                              Italy

                                                                                                                                                         29%
              5%          2%                                                                                                                            Romania
                       Bulgaria
             Spain
                                      94%
                                       Italy

                                                                                                                                                         54%                     46%
                                                                                                                                                        Pipeline      ~1.5      Existing
                                                   Annual                     +169MW                                       +266MW              +400MW                     1

                                                  Additions
                                                                                                                                                                      GW        Assets
                                                                                  2021                                         2022             2023

Note: 1 Assuming reduction of c.40MW in the existing Gross Installed Capacity following reorganization of minority stakes in certain assets.
28
FULL VISIBILITY OF NEAR TERM PROJECTS

                                                                      +535 MW                                                                                                                                                          +300 MW
                                                                      2021-2023                                                                                                                                                        2021-2023
                                                                      Additions                                                                                                                                                        Additions

                         ITALY                                                                                                           ROMANIA
                        221 MW                                                                                                            255 MW                                                                            ITALY                                                        ROMANIA
                                                                                   SPAIN                                                                                                                                   100 MW                                                         200 MW
                                                                                      k
                                                                                   59 MW
                                                 33%
                                              Operating in
                                              Acquisition                                                                                 40%
    39%                                                                                                                      60%        Advanced
 Advanced       28%                                                                                                       Early Stage    Stage                                                                                                                                                        49%
   Stage       Under                                                                                                                  4
                                                                                                                         Development Development
                                                                                                                                                 5
                                                                                                                                                                                                   100%                                              51%                                            Ready to
           1
Development Construction
                         2                                                                                                                                                                       Advanced                                         Advanced                                           Build 8
                                                                                                                                                                                                   Stage                                            Stage
                                                                                                                                                                                                            6
                                                                                100%                                                                                                            Development                                      Development 7
                                                                             Early Stage
                                                                            Development 3
Notes: 1 Environmental permitting started. 2 Authorization procedure completed or TSA agreement signed or “comunicazione inizio lavori” has been officially sent to the authorities   Notes: 6 Environmental permitting started. 7 Technical and economical evaluation completed, land negotiation in progress and start of
(includes the Projects Enermac and Naonis). 3 Preliminary studies and documentation for the grid connection request in progress. 4 Development agreement signed, permitting           construction foreseen in 2022. 8 Permitting procedures started or grid connection authorization “ATR” obtained or land agreements
procedures to be started. 5 Permitting procedures and grid connection request started.                                                                                                signature in progress and start of construction foreseen in 2021.
29
CAPEX FOR GROWTH 2021 – 2023

(€M)

                                                                             CUMULATIVE CAPEX FOR
                                                                              THE 2021-2023 PERIOD

                                                                  ~115              ~694m

                                                                                     17%
                                                      ~62
                                              ~65                                     9%
                                   ~240                                               9%

                                                                                     35%

                    ~213

                                                                                     31%

                    Italy      Other Europe   Spain   Italy   Other Europe         2021-2023
                    Wind           Wind       Wind     PV          PV
Source: Company Information.
30
SOURCES AND USES 2021 – 2023

(€M)
                                       CASH OUT                      CASH IN

                                                  ~37         ~803
                                         ~72

                               ~694

                                                                             New
                                                              ~400
                                                                           Funding

                                                                          Available
                                                              ~95         Cash on
                                                                          Balance

                                                                          Operating
                                                              ~308       Cash Flow
                                                                         pre-interest

                               Capex     Net      Dividends
                                       Interest
Source: Company Information.
31
FOCUS ON CAPITAL INCREASE

Capital increase with exclusion of pre-emptive rights

Listing market               Mercato Telematico Azionario (“MTA”) of Borsa Italiana

Indicative Offer size        Up to €300m

Use of Proceeds              Capital increase is aimed at supporting the growth plan whilst maintaining a strong capital structure

Targeted timetable           By the end of 2021
32
    SUSTAINED TOP-LINE GROWTH COUPLED WITH ACTIVE STRATEGY TO MANAGE
    MARKET PRICE VOLATILITY
                            REVENUES (€M)                     POWER PRICES CURVES (NOMINAL)            HEDGING STRATEGY
Gross Installed
Capacity (MW)        306      564       920       1,544

                                                                        € / MWh
Of which             298      523       673        558
Incentivised (MW)
                                                                                  53.2   56.3   55.3   ◼   Limited exposure
Gross Production
(TWh)                0.3       0.7      ~1.4      ~3.0      Italy                                          to market prices as
                                                            (PUN)
                                                                                  2021   2022   2023       a significant
                                                 ~217                                                      portion of 2021
                                                                                                           production has
                                                                                                           pricing secured via

                                                                        € / MWh
                                                                                                           incentives / hedging
                                        ~137                                                               contracts
                                                                                         43.9   44.2
                                                           Spain                  38.3
                                                          (Wholesale)                                  ◼   Future strategy
                                                                                  2021   2022   2023       based on
                               72                                                                          continuous active
                     55                                                                                    management of
                                                                                                           price risk through

                                                                        € / MWh
                                                                                                           hedging but also
                                                                                  43.3   48.6   55.0       new PPA initiatives
                                                          Romania
                    2017A    2019A      2021      2023    (Wholesale)
                                      Guidance   Target                           2021   2022   2023
33
ALERION’S JOURNEY TO 2023

                    GROSS INSTALLED CAPACITY (MW)                                  EBITDA (€M)                 2020 - 2023T KPIs

    Net Installed                                            EBITDA
                                                                          80%                        74%
    Capacity (MW)              ~836               ~1,494     Margin
                                                                                                                  ~800 MW+
                                                                                                                     vs.2020
                                                 ~1,544                                             ~160
                                                                          ~108
                               ~920
                                                                                                                      25%
                                                                                                                     20-23T
                                                                                                                  EBITDA CAGR
                                                                      2021 Guidance              2023 Target
                          2021 Guidance        2023 Target

                         NET FINANCIAL POSITION (€M)                            NET EARNINGS (€M)
                                                                                                                      13%
                                                                                                                      20-23T
    Net Financial
                               ~3.2x              ~4.3x                                                         Net Earnings CAGR
    Position /
    EBITDA

                                                  ~693
                               ~350                                                                 ~45          1.7 notches
                                                                          ~30
                                                                                                                   deleveraging
                                                                                                                      20-23T
                          2021 Guidance        2023 Target        2021 Guidance                  2023 Target
Source: Company Information.
34
CLEAR EBITDA TRAJECTORY TO 2023

(€M)

                        ~2x EBITDA                                                                  ~41
                               in 3 years                                                                                 ~€160m
                                                                                                                41%
                                            Expiry of incentives on
                                             133.5MW more than                                                Near Term             59%
                                          compensated in the overall                                           Projects            Existing
                                        existing portfolio by increased
                                         production, higher electricity     ~19          ~5                                        Assets
                                        prices and incentives vs. 2020                                                     2023
                                                                                                  Near Term
                                                                                      Near Term    Projects
                                                                                       Projects
                                                    ~14
                                                                          Near Term
                                                                           Projects
                 ~€81m
                                                 Existing
                                                 Assets
                    2020A

Source: Company Information.
5   Closing Remarks
36
FASTEST GROWING ASSET BASE IN EUROPEAN RENEWABLE SPACE

(%CAGR)

              ~1.5                             5                      2         3        30        68        60          32                      4
              GW                              GW                     GW        GW        GW        GW        GW          GW                     GW

             ~30%

                                              19%

                                                                     13%       12%       12%       12%       11%
                                                                                                                          10%

                                                                                                                                                 5%

            >0.3GW/Y                        0.7GW/Y                 0.2GW/Y   0.3GW/Y   2.0GW/Y   6.3GW/Y   4.7GW/Y      2.4GW/Y               0.2GW/Y

            Alerion                         Neoen                    Falck    Encavis   Orsted     Enel     Iberdola     EDPR                   ERG
           2021-23                         2019-22                  2020-25   2020-25   2020-30   2021-23    2020-25    2021-25               2018-22

                                                                                                                       Expected Capacity at the end of the BP

                                                                                                                       Annual Additions
Management elaborations based on public information
Source: Public Information, Companies Websites and Presentations.
37
LEADING RENEWABLE PLAYER WITH A CLEAR AND FOCUSED STRATEGY

                           Focused expansion into European wind and solar aiming to achieve
                           1.5GW by 2023

      >2x Installed
                           Target 400MW additions per year beyond 2023 while maintaining returns
      RES Capacity
       in 3 years          and balance sheet discipline

                           Leverage industrial capabilities to continue improving operational
                           efficiency
THANK YOU
A   Appendix
40
 WIND FARM PORTFOLIO DETAILS

 ITALIAN AND OTHER EU WIND FARMS
                                N um be r o f                     G ro s s C a pa c it y           N e t C a pa c it y     S t a rt o f    R e m a ining lif e         E nd o f                A v g pro d.
P la nt Lo c a t io n                           T e c hno lo gy                            Stake
                                   pla nt s                              ( M W)                          ( M W)          o pe ra t io ns        ( ye a rs )          inc e nt iv e s           L3 Y ( G Wh)
     A lbanella                       1           Vestas V52                9               100%            9               Feb-04                 8.2                  Feb-16                      9
     A lbareto                        1           Vestas V117              20               100%           20                Jul-19               23.5                   Jul-39                     18
     A nzi                            1           Vestas V90                16              49%             8                A ug-11              15.6                  A ug-26                     31
     A grigento                       1          Gamesa G58                33               100%           33               M ar-07                11.1                 M ar-19                     51
     Callari                          1           Vestas V90               36               100%           36                Jan-09                13.1                 Jan-24                      54
     Castel di Lucio                  1           Vestas V52               23               100%           23                A pr-10              14.3                  A pr-25                     37
     Cio rlano                        1           Vestas V80               20               100%           20               M ar-08               12.3                  M ar-23                     17
     Fri-El Campidano                 3           Vestas V90               70               100%           70                Oct-08               12.8                  Oct-23                      115
     Gro tto le                       2           Vestas V90               54               100%           54                Jan-09                13.1                 Jan-24                     107
     Lacedo nia                       1           Vestas V90                15              50%             8               Sep-08                12.8                  Sep-23                      23
     Lico dia                         2          Gamesa G58                22               80%            18                Sep-10               14.8                  Sep-25                      33
     M o rco ne-P o nteland.          1           Vestas V117              52               100%           52                Jul-19               23.5                   Jul-39                     58
     Nulvi-Tergu                      1           Vestas V52               30               90%            27                Jan-08                12.1                 Jan-23                      54
     Ordo na                          1         REpo wer M M 92            34               100%           34               M ar-09               13.2                  M ar-24                     60
     S.B asilio                       1           Vestas V52               25               49%            12                Jun-10               14.4                  Jun-25                      43
     S. M arco in Lamis               1         REpo wer 3XM               44               100%           44                Dec-11               16.0                  Dec-26                      65
     Ururi                            1           Vestas V90               26               49%            13                Jan-11               15.0                  Dec-25                      50
     Villlacidro                      1           Vestas V110               31              100%           31                Feb-19               18.0                  Feb-39                      47
     Regalbuto                        1         No rdex 90/2500            50               100%           50                Jan-10               14.0                  Oct-24                      59
     Ricigiliano                      1           Vestas V90               36               100%           36               A ug-07                11.6                  Jul-19                     59
     S. M artino in P ens.            1           Vestas V90               58               50%            29                Oct-10               14.8                  Oct-25                     106
     Co mio lica                      1         Sino vel SL3000            36               100%           36                Dec-12               16.9                  Dec-32                      92
     Krupen                           1           Vestas V90                12              51%             6                Oct-10               14.8                  Oct-25                      24
T o tal                              27                                   751                             667                                                             6 .0                    1,2 12
                                                                                                                                                            Weighted average years remaining
 Source: Company Information.
41
ALERION’S KEY REPORTED METRICS

                                                                            2017           2018           2019           2020
Operational Metrics
Installed Capacity (MW)                                                      306            335            564            751
Number of Plants                                                             11             14             17             27
Average Plant size (MW)                                                      28             24             33             33
Annual Production (MWh)                                                    413,609        433,789        695,236       1,111,576
Average Load Factor1                                                         15%            15%            14%            19%
P&L Metrics
Revenue                                                                     €55m           €59m           €72m          €109m
Revenue | o/w from incentive (%)                                         €33m | (60%)   €33m | (56%)   €39m | (54%)   €63m | (58%)
EBITDA | Margin (%)                                                      €42m | (76%)   €45m | (77%)   €54m | (75%)   €81m | (74%)
EBIT                                                                        €22m           €25m           €28m           €41m
Net Income                                                                   €5m            €3m           €21m           €32m
Cash Flow Metrics
Operating Cash Flow                                                         €31m           €35m           €65m           €67m
CAPEX | Investments in tangible assets + Investments in Property,
                                                                             €1m           €58m           €27m            €4m
Plant and Equipment
Change in Cash                                                               €8m           €21m          €174m          €(91)m
Net Debt                                                                   €174m          €227m          €407m          €491m
Net debt/EBITDA                                                              4x             5x             8x             6x

Source: Company Information

1. Average Load Factor = Annual Production / Capacity Installed 365*24
42
INCOME STATEMENT

(€ mn)
                                                                2017     2018    2019     2020
Electricity sales                                               19.2     22.6    31.5     37.2
Revenues from incentive tariff                                  32.9     33.3    38.5     63.4
Operating Revenue                                               52.2     55.9    70.0     100.6
Other revenues and income                                        2.7      3.2     1.8      8.7
Total revenue                                                   54.9     59.0    71.8     109.3
Staff costs                                                      2.6      2.4     2.2      2.5
Other operating costs                                           12.5     13.2    18.1     29.9
Provisions for risks                                             0.2      0.1      -       0.4
Total operating costs                                           15.3     15.7    20.3     32.8
Income from JVs accounted using the equity method                2.4      2.1     2.4      4.6
EBITDA                                                          42.1     45.4    53.9     81.1
D&A, Write-downs and value adjustments                          20.6     20.3    26.2     40.6
Operating Result (EBIT)                                         21.5     25.1    27.7     40.5
Financial Income (expenses)                                     (13.3)   18.5    (15.8)   (28.2)
Income (expenses) from equity investments and other financial
                                                                 0.0      0.0    13.6       -
assets
Profit Before Tax                                                8.2      6.6    25.5     12.3
Taxes for the year                                              (3.3)    (3.2)    4.1     19.3
Net result for the year                                          4.9      3.4    21.4     31.6
Of which:
Parent company shareholders                                      5.0      3.5    21.1     31.0
Non controlling interests                                       (0.1)    (0.1)    0.3      0.6

Source: Company Information
43
BALANCE SHEET (ASSETS)

(€ mn)
                                                                 2017    2018    2019    2020
Total intangible assets                                          62.7    83.2    148.5   198.1

Property, plant and equipments                                   191.4   276.6   415.3   455.6
Equity investments in joint ventures measured using the equity
                                                                 17.8    17.8    18.4    50.0
method
Financial receivables and other non-current financial assets      4.3     3.8     4.1     4.4

Other receivables and other non-current assets                     -       -       -      0.9

Deferred tax assets                                              15.7    16.1    19.9    43.8

Total Non-current Assets                                         291.9   397.5   606.3   752.8

Trade receivables                                                 3.4     3.3     4.8     9.1

Tax receivables                                                   0.7     0.7     2.4     5.1

Sundry receivables and other current assets                      22.9    32.1    28.6    28.5

Financial receivables and other current financial assets          0.0     0.5     0.5     1.0

Cash and cash equivalents                                        43.3    63.9    238.3   147.7

Total Current Assets                                             70.3    100.6   274.6   191.5

Total Assets                                                     362.2   498.1   880.9   944.3

Source: Company Information
44
BALANCE SHEET (LIABILITIES & SHAREHOLDER’S EQUITY )

(€ mn)
                                                                 2017    2018    2019    2020
Non-current financial liabilities                                157.9   221.4   578.8   534.9

Non-current payables for derivatives                              7.6     6.3     8.1     6.5

Post-employement benefits and other staff-related provisions      1.2     1.0     0.7     0.6

Provisions for future risks and charges                           7.9    10.2    16.5    22.0

Sundry payables and other non-current liabilities                 3.7     3.2     8.5    14.0

Deferred tax provision                                            8.4     8.2    29.5    38.7

Total Non-current Liabilities                                    186.8   250.4   642.1   616.5

Current trade payables                                            5.0    38.7     9.8     8.3

Tax payables                                                      0.5     0.6     4.0     4.6

Sundry receivables and other current liabilities                  3.6     3.5     5.0     9.5

Current financial liabilities                                    48.8    60.4    55.9    89.8

Current payables for derivatives                                  3.1     3.3     3.3     8.6

Total Current Liabilities                                        61.1    106.5   77.9    120.7

Total Liabilities                                                247.9   356.9   720.1   737.3

Shareholders' equity attributable to the Group                   111.8   138.8   158.1   202.5

Shareholders' equity attributable to non-controlling interests    2.5     2.5     2.8     4.5

Total shareholders' equity and liabilities                       362.2   498.1   880.9   944.3

Source: Company Information
45
CASH FLOW STATEMENT

(€ mn)
                                                                             2017     2018      2019      2020
Net profit (loss) for the period attributable to owners of the parent         5.0       3.5       21.1     30.9
Net profit (loss) for the period attributable to non-controlling interests   (0.1)     (0.1)       0.3      0.6
Depreciation, amortization and write-downs                                   20.6      20.3       26.2     40.7
Financial income (expenses) and equity investments                           13.3      18.5        2.2     28.2
Current taxes for the year                                                    2.6       4.1        5.7      9.8
Increase (decrease) in deferred taxes                                         0.7      (0.9)      (0.2)   (29.5)
Change in joint ventures measured using the equity method                    (2.4)     (2.1)      (2.4)    (4.6)
Increase (decrease) in post-employment benefit provision                      0.0      (0.1)      (0.3)    (0.1)
Increase (decrease) in provision for risk and charges                         0.2       0.5        1.3      1.5
(increase) decrease in trade receivables and other assets                    (4.2)     (3.8)      19.4      4.3
Increase (decrease) in trade payables and other liabilities                  (3.1)     (2.8)      (6.0)   (14.3)
Income taxes paid                                                            (1.3)     (2.4)      (2.4)    (0.7)
Total cash flows from operating activities                                   31.3      34.7       64.8     66.9
Cash acquired through business combination                                     -        0.7       23.7     16.6
Consideration paid for business combination                                    -         -      (108.8)   (90.7)
Acquisition of financial receivables from transferred companies                -      (13.2)        -        -
(Investments in) divestments of tangible assets                                -       (0.0)      (7.4)    (1.6)
(Investments in) divestments of property, plant and equipment                (0.5)    (58.2)     (19.6)    (2.1)
Dividends received from companies measured using the equity method             -        2.6        1.8      2.4
Change in debt related to investing activities                                                   (31.6)      -
Total cash flows from investing activities                                    (0.5)    (68.2)   (141.7)   (75.5)
Net change in financial payables/receivables and in lease liabilites         754.0       0.2       7.6     (9.1)
Increase (decrease) in payables to banks                                      (8.7)     58.8      62.6    (41.3)
Increase (decrease) in payables ti bondholders                                  -       17.2     197.3       -
Purchase of treasury shares                                                     -       (0.1)     (0.1)    (1.8)
Divided pais                                                                  (1.9)   .-2.269     (1.7)   (10.7)
Financial expenses paid                                                       12.5     (19.5)    (14.4)   (19.2)
Total cash flows from financing activities                                   (22.4)     54.2     251.3    (82.1)
Cash flows for the year                                                        8.3      20.7     174.4    (90.6)
Effects of the IFRS 9 Adoption as Jan 1, 2018                                   -       (0.1)       -        -
Available cash at start of year                                               35.0      43.3      63.9    238.3
Available cash at the end of year                                             43.3      63.9     238.3    147.7
Source: Company Information
46
OVERVIEW OF ON-SHORE WIND INCENTIVE FRAMEWORK IN ITALY

                                           Qualification                                                 Key Features                              Alerion Portfolio

                                                                            • Feed in Premium = (180 – PUN) x 0.78
     Feed in                                                                                                                             • 522.65 MW of gross installed capacity
  Premium (FIP)               Plants in operation before 2013               • Revenues = Electricity Sale Price + FIP
                                                                                                                                           as of December 2020
                                                                            • Duration of Incentives = 15 years

                                                                            • Tariffs allocated through auctions                         • 1 recently developed plant (30.8 MW) in
    Incentives                Plants in operation from 2013 that have                                                                      operation since February 2019 and 2
                                                                              -   Tariffs auction 2016 = 66 €/MWh
     through                  been awarded incentives through Dutch                                                                        recently developed plants (51.8+19.8
     Auctions                 Auctions                                        -   Price floor guaranteed by GSE (retain market upside)     MW) in operation since July 2019
                                                                            • Duration of Incentives = 20 years                            -   Awarded 66 €/MWh incentive

                              Plants in operation from 2013 that have not                                                                • 3 operating plants (77.65 MW)
    Grid Parity               been awarded incentives through Dutch         • Focus on corporate and/or merchant power PPAs
                              Auctions                                                                                                   • Potential new developments

Source: Company Information
47
SPANISH AND ROMANIAN RENEWABLES LANDSCAPE

                                                     SPAIN                                                                                       ROMANIA

           ◼     Spain’s 2030 National Energy Plan (PNIEC) targets                                              ◼   Romania’s National Integrated Plan for Energy and Climate Change
                                                                                                                    2021-30 targets a quota of 30.7% for renewable energy within the
                 — Deployment of c.60GW of renewables over the next 10 year                                         total energy mix by 2030 while it has reached a share of ~27% of
                 — >200% increase in energy (renewables + power grids) sectors                                      green energy in 2019
                   investments vs the current run rate
                                                                                                                ◼   The government has introduced a support scheme similar to
           ◼     Spain has the 6th largest Solar PV capacity additions; 5th largest                                 Contracts for Difference (CfD) scheme where they lock in the strike
                 wind power capacity1 and 4th largest wind power capacity                                           price to secure stable technology pricing and thereby encourage
                 additions in 2019 in the world                                                                     investments
           ◼     Committed to an economy-wide renewable energy target of 42% of                                 ◼   Greenfield investments are seeing an increased interest in the
                 final energy consumption by 2030 (~21% from solar & wind energy                                    wind power generation that can ensure premium returns vis-à-vis
                 in 2019)                                                                                           certain western European markets
           ◼     Passed new solar PV regulations that allow for self-consumption
                 from individually owned residential rooftop systems as well as from                            ◼   Romania plans to invest over €22.6bn in the transformation of its
                 shared installations                                                                               energy sector over the period of 2020-30. Romania will have the
                                                                                                                    possibility to access a number of EU funding initiatives to support its
           ◼     The Spanish government expected to action >20GW of renewables                                      investment plan:
                 capacity over the next 5 years with a 3GW an auction launched in
                 December 2020. Winning bids will be awarded 12-year power                                          — Up to €18bn under the Emission Trading Scheme (EU-ETS)
                 purchase agreements (PPAs) for PV, solar thermal, onshore and                                      — Possible up to €10bn mobilised under the Just Transition
                 offshore wind and hydropower                                                                         Mechanism

Source: REN21 Renewables 2020 Global Status Report, CMS Research and News, Spanish Boletín Oficial del Estado
Notes: 1 as of End-2019
48
CONTINUOUS SUPPORT FROM FRI-EL TO ALERION THROUGH INTERCOMPANY
SERVICES

                         FRI-EL Service                                                        FRI-EL Trading

Through FRI-EL Service:                   Directly:                                        Through FRI-EL Trading:
•   Operations & Maintenance              •   Administrative Services                      •   Energy Sales and Trading Services
•   Asset Management Activities           •   Project financing and planning services
•   Service Level Agreement               •   Technical support for pre-construction and
•   Weather forecasting and Vibration         construction phases in the new project
    Measurement                               initiatives
You can also read