INVESTOR PRESENTATION | Q2 2020
←
→
Page content transcription
If your browser does not render page correctly, please read the page content below
BUILDING FOR
            STRENGTHENING TODAY,

                       TOMORROW
INVESTOR PRESENTATION | Q2 2020
JULY 2020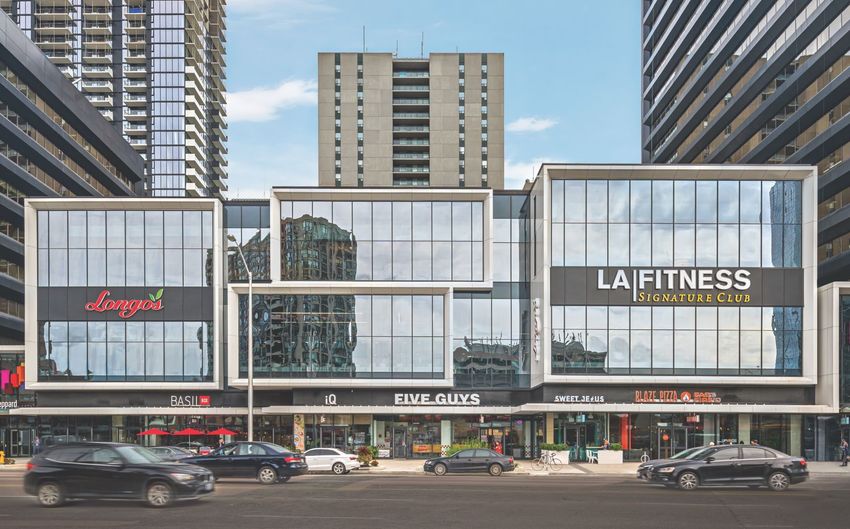
NON-GAAP MEASURES
RioCan’s consolidated financial statements are prepared in accordance with IFRS. Consistent with RioCan’s management framework, management uses certain financial
measures to assess RioCan’s financial performance, which are not generally accepted accounting principles (GAAP) under IFRS.
The following measures, Funds From Operations (“FFO”), Net Operating Income (“NOI”), Adjusted Earnings before interest, taxes, depreciation and amortization
(“Adjusted EBITDA”), Debt to Adjusted EBITDA, Same Property NOI, Interest Coverage, Debt Service Coverage, Fixed Charge Coverage, and Total Enterprise Value
as well as other measures discussed in this presentation, do not have a standardized definition prescribed by IFRS and are, therefore, unlikely to be comparable to similar
measures presented by other reporting issuers.
Non-GAAP measures should not be considered as alternatives to net earnings or comparable metrics determined in accordance with IFRS as indicators of RioCan’s
performance, liquidity, cash flow, and profitability. For a full definition of these measures, please refer to the “Non-GAAP Measures” in RioCan’s Second Quarter 2020
Management’s Discussion and Analysis (“MD&A”) for the three and six months ended June 30, 2020. RioCan uses these measures to better assess the Trust’s underlying
performance and provides these additional measures so that investors may do the same.

PEER DATA PRESENTATION
RioCan data and statistics are based on the period ended June 30, 2020 information, unless otherwise noted. Certain slides contain a peer comparison that is based on the
respective issuer’s reported information as at March 31, 2020, where available, otherwise the most recent reported figures were reflected. Peer group includes: First Capital
Realty Corp. (FCR), SmartCentres REIT (SRU), Choice Properties REIT (CHP), CT REIT (CRT), and Crombie REIT (CRR). All information presented is at RioCan’s interest
unless otherwise noted. CAGR refers to compound annual growth rate of a specific metric over a period of time.

FORWARD LOOKING INFORMATION
Certain information included in this presentation contains forward-looking statements within the meaning of applicable securities laws including, among others, statements
concerning our objectives, our strategies to achieve those objectives, as well as statements with respect to management's beliefs, plans, estimates, and intentions, and similar
statements concerning anticipated future events, results, circumstances, performance or expectations that are not historical facts. Certain material factors, estimates or
assumptions were applied in drawing a conclusion or making a forecast or projection as reflected in these statements and actual results could differ materially from such
conclusions, forecasts or projections.
Forward-looking information is not a guarantee of future events or performance and, by its nature, is based on RioCan’s current estimates and assumptions, which are subject to
numerous risks and uncertainties. Such risks and uncertainties include, but are not limited to, the effects of COVID-19 on the businesses, operations and financial positions of
RioCan and its tenants, as well as on consumer behaviors and the economy in general, including the length, spread and severity of the pandemic; the nature and length of the
restrictive measures implemented or to be implemented by various levels of governments in Canada; RioCan’s tenants' ability to pay rents as required under their leases; the
availability of various support programs that are or may be offered by the various levels of government in Canada and worldwide; domestic and global supply chains; timelines
and costs related to the Trust’s development projects; the pace of property lease up and rents and yields achieved upon development completion; potential changes in leasing
activities, market rents and property valuations; the availability and extent of rent deferrals offered or to be offered by the Trust; domestic and global credit and capital markets,
and the Trust’s ability to access capital on favourable terms or at all, and its ability to maintain its current credit ratings; total return and the dividend yield of the Trust’s Units; and
the health and safety of our employees, tenants and people in the communities that our properties serve. For more information on other risks, uncertainties and assumptions that
could cause the Trust's actual results to differ from current expectations, refer to the “Risks and Uncertainties” section in RioCan’s Second Quarter 2020 MD&A for the period
ended June 30, 2020 and in its most recent Annual Information Form, available at www.sedar.com and at www.riocan.com.
The forward looking information contained in this presentation is made as of the date hereof. Except as required by applicable law, RioCan undertakes no obligation to publicly
update or revise any forward-looking statement, whether as a result of new information, future events or otherwise.
                                                                                                                                                     Investor Presentation Q2 2020 | RioCan | 2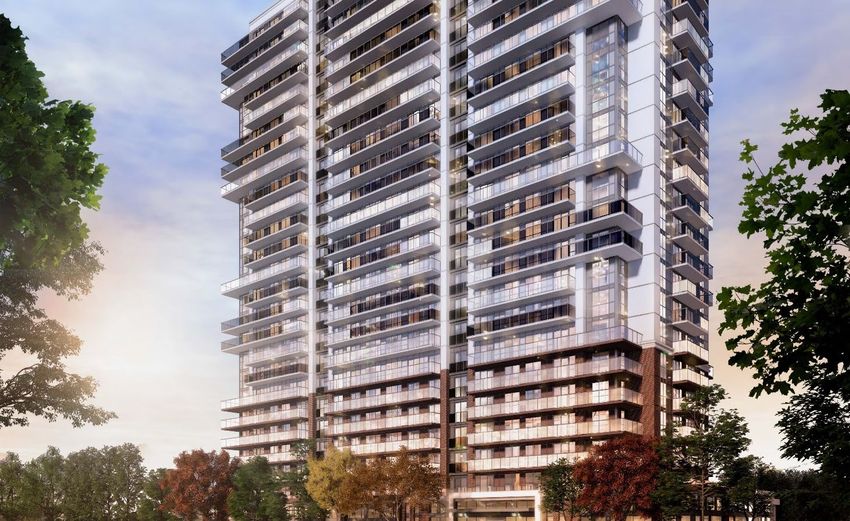
ABOUT RIOCAN
Diversified portfolio of quality assets in Canada’s most desirable urban centers

                                                                                                                     90.5%
                                                                                                                                                   1

                                                              221
                                                                                                           Retail:

                                                                                                                        7.8%
                                                                                                                                                   1
                                                               Properties                                  Office:

                                                                                                           Residential: 1.7%
                                                                                                                                                   1
                                                  Concentrated in
                                                   Canada’s Six                                               Increasingly
                                                  Major Markets                                            Mixed-Use Portfolio

                                                    ~43M Sq. Ft.                                                $15.2B
                                                      Development Pipeline                                              Total Assets

                                                  Embedded                                                     Scale and
                                               Long-term Value                                             26-Years of Building
                                               Creation Potential                                          Best-in-Class REIT

                                              1. Based on annualized rental revenues as of June 30, 2020

                                                                                                               Investor Presentation Q2 2020 | RioCan | 3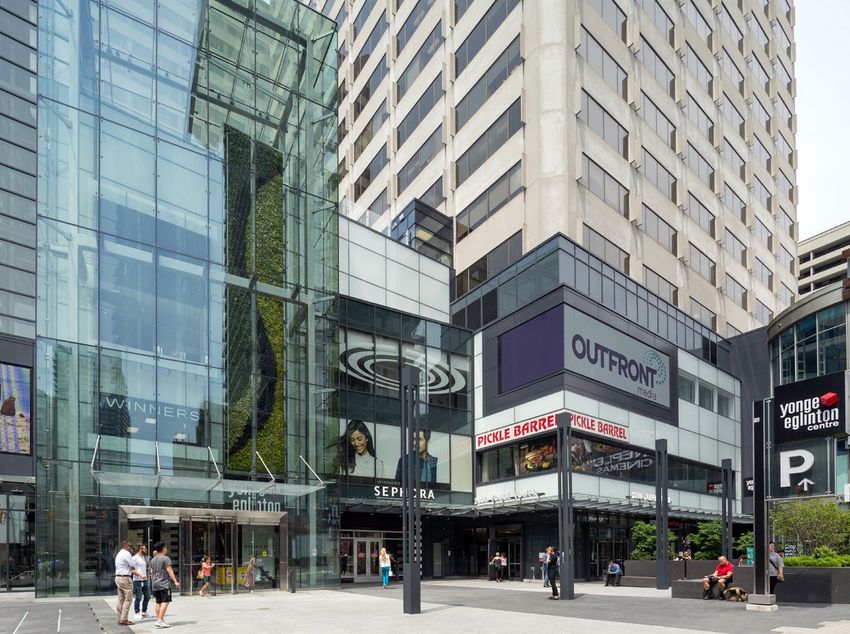
DEEP EXECUTIVE BENCH
  Extensive industry knowledge and unparalleled experience

Edward Sonshine O.Ont, Q.C   Jonathan Gitlin           Qi Tang                           John Ballantyne
Chief Executive Officer      President &               Senior Vice President             Senior Vice President,
                             Chief Operating Officer   & Chief Financial Officer         Asset Management

Andrew Duncan                Oliver Harrison           Jeff Ross                       Jennifer Suess
Senior Vice President,       Senior Vice President,    Senior Vice President,          Senior Vice President,
Development                  Operations                Leasing & Tenant Coordination   General Counsel & Corporate Secretary

                                                                                        Investor Presentation Q2 2020 | RioCan | 4
RIOCAN LOCATIONS HIGHLY DESIRABLE AND IN DEMAND
Concentrated in transit corridors of Canada’s fastest growing high density urban centers

          Strategically curated portfolio focused on Canada’s six major markets

     201,326
  Average Population
    within 5 km of
  RioCan Properties

      +32.8%
    Improvement in
 average population
within 5 km since 2016

      117,918
   Average Household
  Income within 5km of
    RioCan Properties

     +19.7%
   Improvement in                                                          1 Percentage   of annualized rental revenue as of Q2 2020
 average HH Income
  within 5 km since
        2016
Source: DemoStats – 2020 - Trends, ©2020 Environics Analytics

                                                                                      Investor Presentation Q2 2020 | RioCan | 5
RIOCAN PROPERTIES ATTRACT RESILIENT TENANTS
Well-positioned to meet current consumer needs with diversity providing consistency through cycles

                      Property Mix                                                                                Tenant Mix
     64.3% OF RENT FROM MIXED-USE / URBAN                                                                   75.2% OF RENT FROM NECESSITY-
        ASSETS AND GROCERY ANCHORED                                                                          BASED AND SERVICE-ORIENTED
                    CENTERS                                                                                            TENANTS

                                                 Largest tenant only represent 5.3% of
                                                      annualized rental revenue
 1. Excludes Home Outfitters (included in Home and Furniture), Saks Off 5th (included in Value Retailers)
                                                                                                                            Investor Presentation Q2 2020 | RioCan | 6
    and Lawrence Allen Centre’s HBC Office
RIOCAN KEEPING IN STEP WITH EVOLVING RETAIL LANDSCAPE
COVID-19 has fast-tracked the evolution and amplified emerging success factors for retail

  New Retail Reality                     RioCan Position                        RioCan Initiatives

                                         Portfolio strategically concentrated   Continually curate and prune
  Time and convenience - hyper           in Canada’s six major markets,         portfolio and diversify asset base
  focus on proximity to consumers        properties located in growing and      with mixed-used development
                                         highly populated areas                 combining residential and office
                                                                                with retail

                                         Enable retailers to adapt and          Programs such as RioCan
  Just-in-time inventory - Physical      provide customers flexible and         Curbside Collect™ making it
  stores provide “last-mile” logistics   relevant shopping environments         easier for merchants to serve their
                                         while improving logistics and          customers through multiple
                                         mitigating “last-mile” cost            channels

                                         Focus on necessity-based and           Strategic leasing to improve
  Sense of community and                 service-oriented retailers             merchandising mix replacing
  experiential gathering places          combining national brands with         vacancies with strong compelling
                                         diverse independent businesses         tenants
                                         to provide local perspective

                                                                                          Investor Presentation Q2 2020 | RioCan | 7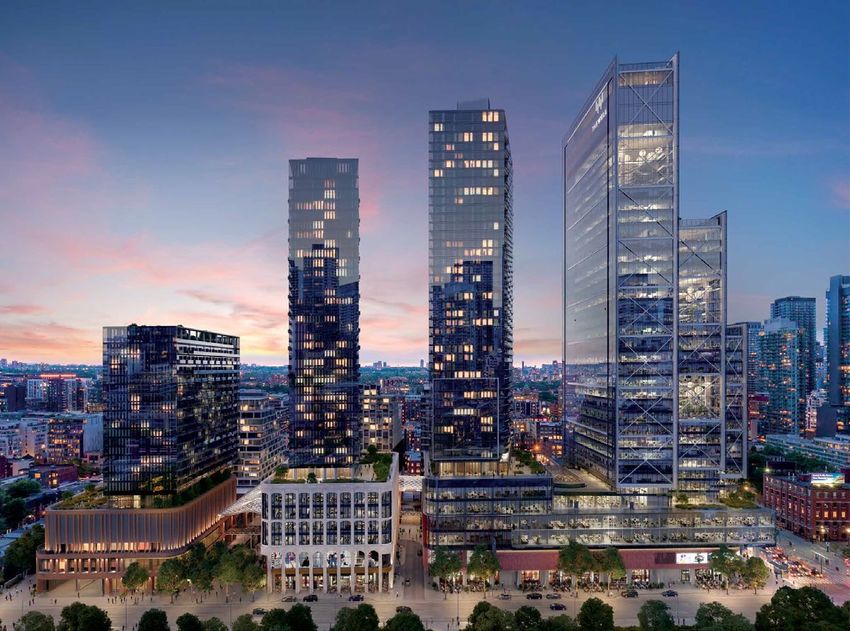
RENT COLLECTION DURING COVID-191
 Trending positively as businesses gradually re-open with 85%2 of tenants currently open

                     Rents Collected                                   Q2 2020 Rents Breakdown
                      (% billed gross rent)                                        (% billed gross rent)
                                                                 ~87% of rent
                                                               collected or with
                                                              definitive payment
                                                              schedule in place
                                                    85%
                                                                                                                Net CECRA
                                                                                                                 Funding,
                                                                                                                   5.8%
Q2 To-Date: 73.3%                                                                                                      Deferred,
                                                                             Cash Rent
                                                                             Collection,                                7.7%
                                                                              73.3%
                                                                                                                      Provision,*
                                                                                                                        6.8%
   73%                 71%                   76%
                                                                                                                  To be
                                                                                                                 Collected,
                                                                                                                   6.4%
   April               May                   June   July
                                2020                       *Provision reflects rent abatements including CECRA abatements and bad debts

  1.   As of July 28, 2020
  2.   Based on occupied net leasable area
                                                                                                                       Q2 2020 | RIOCAN | 8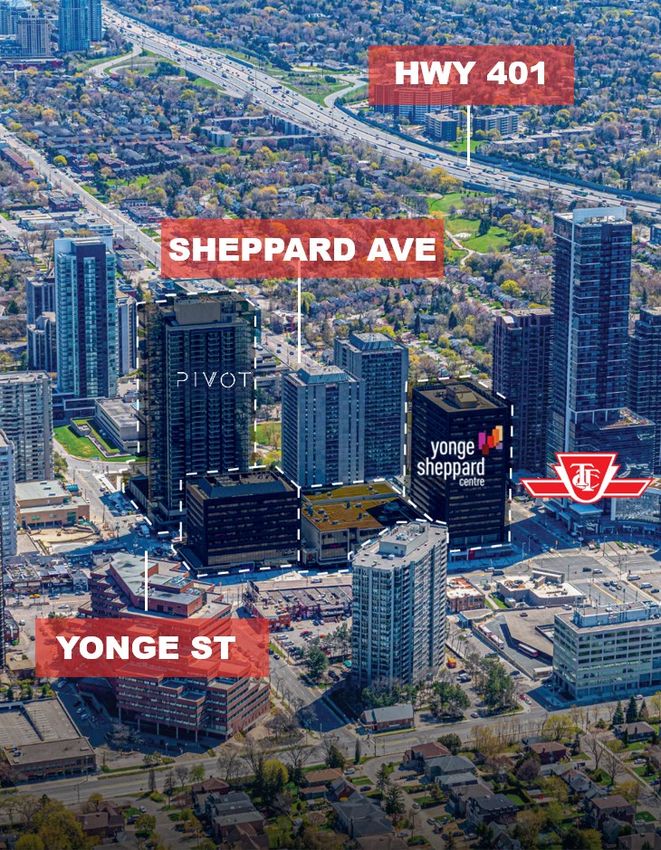
DISCIPLINED AND PRUDENT BALANCE SHEET MANAGEMENT
Ample liquidity bolstered by large pool of unencumbered assets

                                                        Capital Structure Metrics
                                                                                                           Target             Q2 20201
   Debt to Adjusted EBITDA                                                                                 3.0x                 3.30x
   Debt Service Coverage                                                                                  >2.25x                 2.78x
   Fixed Charge Coverage                                                                                   >1.10x                1.09x
   Unencumbered Assets                                                                                      N/A                  $8.7B
   Unencumbered Assets to Unsecured Debt                                                                    >2.0x                2.21x
   NOI % from Unencumbered Assets                                                                           >50%                 62.0%
   Unsecured vs. Secured Debt                                                                            60% / 40%           58% / 42%
   Ratio of Floating Rate Debt to Total Debt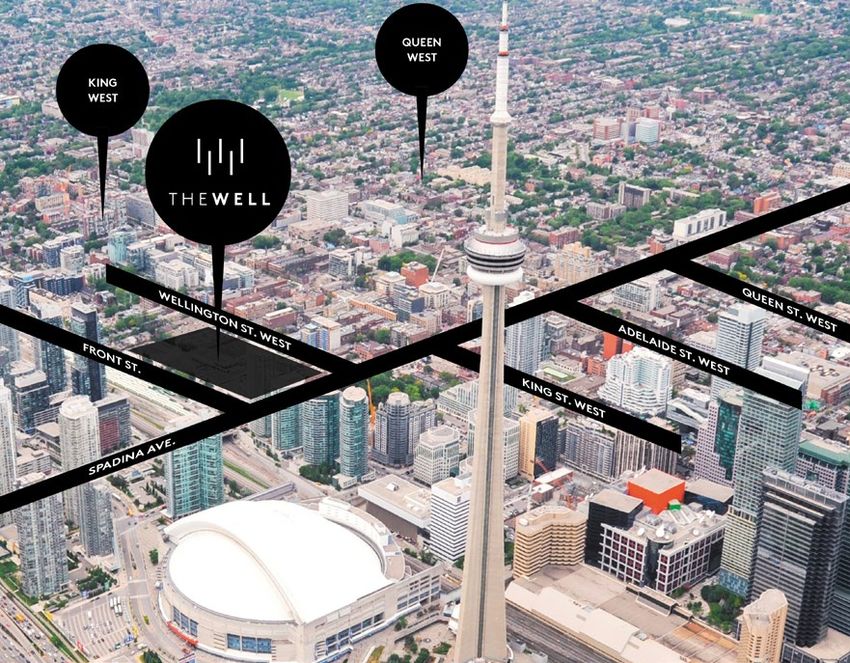
AMPLE LIQUIDITY AND LADDERED DEBT MATURITY
    Financial capacity and flexibility to navigate through Covid-19 pandemic

• As at June 30, 2020, RioCan had $1.0B of liquidity from the following sources:

        o   $82M from cash and cash equivalents

        o   $872M from undrawn revolving unsecured operating line of credit

        o   $91M from undrawn construction lines of credit and other bank loans

•     The Trust also had $8.7B unencumbered assets which could be utilized to enhance liquidity

                          Debt Maturity Schedule – As at June 30, 2020

                                                                                   Investor Presentation Q2 2020 | RioCan | 10
TRACK RECORD MATTERS – BUILDING A RESILIENT PORTFOLIO
Encouraging Results Despite COVID-19 Pandemic
Avg. Rents – Commercial Only Retention Ratio
89.4%
$19.77 $19.75 83.1%
Q1 2020 Q2 2020 Q1 2020 Q2 2020
Note: Despite the pandemic, RioCan entered into ~109k SF of Note: Despite the pandemic, the retention ratio increased to
new leases during the quarter at an average net rent per 89.4%, 630 basis points higher from Q1 2020
square foot of $25.83, well above its portfolio average net rent
of $19.75 per SF. The new leases are with a variety of tenants
ranging from grocery stores and specialty retailers to essential
and regular personal services
Renewal Leasing Spread (%) Blended Leasing Spread (%)
5.3% 5.6% 5.8%
4.6%
Q1 2020 Q2 2020 Q1 2020 Q2 2020
Note: 4.6% increase was primarily driven by a 5.9% renewal Note: The blended leasing spread exceeded the renewal
spread increase in major markets. The major market renewal leasing spread in Q2 as a result of strong new leasing,
spread remained on pace with the first quarter of 2020 despite particularly in the major markets. For major market properties,
the pandemic the blended leasing spread was 7.3%
Investor Presentation Q2 2020 | RioCan | 11LEADING PORTFOLIO IN HIGH GROWTH URBAN CENTRES
Outperforming our peers1
Leading Six Major Market Presence1 Leading Toronto Presence1
90.1% 91.0%
71.9%
52.1%
47.0% 38.0%
21.6%
N/A N/A N/A N/A N/A
1. Peer data as measured by % of revenues based on the respective issuer’s Q1 2020 report
2. Source: DemoStats – 2020 - Trends, ©2020 Environics Analytics
Investor Presentation Q2 2020 | RioCan | 12CONTINUALLY ADAPTING AND EXECUTING ON OPPORTUNITIES
Clear leasing strategy - targeting a more resilient tenant base
Low Exposure to Capitalizing on Vacancies
Declining Retail Concepts
% of Annualized Confirmed
Retailers restructuring
total rental closures as % of Case study: Target exits Canada
since March 31, 2020
revenue annualized total
Globo Shoes1 0.2% -% Vacancy to re-lease: 1.7M Sq. Ft.
L'Aubainerie 0.1% -%
2 0.3% Leasing strategy: Attracted stronger and more
Reitmans 0.9%
appealing replacement tenants; e.g. Costco, Dollarama,
Stern Group
3
0.2% 0.1% Winners, HomeSense and Canadian Tire
GNC 0.1% -%
4 0.1%
Annual net rent improvement: $3.4 Million or +32.1%
Others 0.2%
over former Target rent
Total RioCan Exposure 1.7% 0.5%
(as of Jul 28, 2020) Return on net capital investment: ~8% yield net of $88M
1) Globo Shoes includes Aldo, Call it Spring and Globo
settlement fees to repurpose former Target space
2) Reitmans includes Penningtons, RW&CO., Addition Elle and Thyme Maternity
3) Stern Group includes RICKI’S, Cleo and Bootlegger
4) Others include Anna Bella, Ascena Group Inc., Brooks Brothers, Chuck E.
Cheese’s, Davids Tea, Dr. Bernstein Health and Diet Clinic, Henry’s, Infinity
Dental, Jack & Jones, J. Crew, Lucky Brand, Mendocino and Swimco
Investor Presentation Q2 2020 | RioCan | 13VALUE CREATION THROUGH MIXED-USE DEVELOPMENT
With highest zoning entitlements among peers
~100% located in Canada’s ~99% of projects are Completed / Under Construction1
six major markets; mixed-use residential • ~2,700 residential rental units
~73% located in the GTA projects • ~3,500 condo/townhouse units
Total Pipeline by Zoning Status
(42.7M SF)
Application Submitted,
6.7M SF, 16%
Zoning Approved,
14.8M SF, 35%
Future estimated density,
21.1M SF, 49%
Investor Presentation Q2 2020 | RioCan | 14VALUE CREATION UNDERWAY
Staggered Development Delivery – Sample Projects
Delivering best-in-class purpose-built rental units and condos along Canada’s most prominent
transit corridors, RioCan LivingTM shapes the communities where Canadians shop, live and work
11 mixed-use residential projects, 5.4M SF1 of NLA to be delivered in near to mid-term
Brentwood Village College & Manning Gloucester – Phase Two
(Brio) (Strada) (Latitude)
Yonge Sheppard Elmvale Acres – Phase One The Well
Dupont Street
Centre Residential (Luma)
(Litho)
(Pivot)
2020 2021 2022+
1. At 100% of the project Investor Presentation Q2 2020 | RioCan | 15CANADA STILL A PLACE TO GROW
Canada outperforms G7 countries across key metrics – strong population and economic growth
Population Growth│G7 Countries │ 2019 - 2029 GDP Growth│G7 Countries │ 2019 - 2029
17.2%
16.1%
10.6%
13.1%
12.2%
2.7% 2.6%
5.4%
0.4% 8.2%
6.4%
-1.7% -4.2% 2.9%
Canada U.S. U.K. France Germany Italy Japan U.S. Canada U.K. France Germany Japan Italy
Employment Growth│G7 Countries │ 2019 - 2029 Benefits of Canada
5.4%
4.6%
3.6% Developed Educated
3.1% 0.5% Political
Economy Workforce
-0.9%
-2.1% Stability
Canada France U.K. U.S. Italy Germany Japan
Streamlined Clean
Source: CBRE Research, Q2 2020.
Immigration Environment
Investor Presentation Q2 2020 | RioCan | 16CANADA vs. U.S.
Key differences in REIT investment fundamentals
Stronger Retail Operating
Environment
• Lower retail space per capita
(CAN: 17.5 sf vs US: 24.6 sf)1
• Fewer competing tenants per
category
• Lower e-commerce penetration
given higher distribution cost due to
Canada’s geographic diversity
More Significant Barriers to
Entry
• Limited supply of land for
development in key urban centers
• Tighter zoning by-laws mitigating
oversupply of retail space
• More conservative lending practices
limiting over building and over risk-
taking
Higher Retail Investor
Ownership in Canada2
• CAN: ~65% vs US: ~10% resulting in
higher demand for yield which
impacts capital structure
1. Source: CBRE Research, July 2020 Investor Presentation Q2 2020 | RioCan | 17
2. Source: RBC Capital MarketFOCUS ON TORONTO – AN EVOLVING WORLD CLASS CITY
Recognized as one of the world’s most liveable cities with population growth far outpacing
key North American Cities
LOW-COST, HIGH-QUALITY BUSINESS ENVIRONMENT
Toronto offers the highest quality for the lowest cost, when compared to other
prominent cities1
New York City
190
170
Toronto
150
Quality
Chicago
130
San Francisco
Atlanta
110 Boston
Philadelphia Washington DC
90
Pittsburgh
70
70 80 90 100 110 120 130 140
Cost
POPULATION CHANGE, 2011-2016
Over the period, Toronto added 433,537 people, growing faster than others
400,000
300,000
200,000
100,000
-
1. Source: fDi Benchmark (2017) – based on a operation with 5,000 employees (across various positions) and 500K SF of office space
2. Source: StatsCan 2016 Census, US Census Bureau American Community Survey 2016 Investor Presentation Q2 2020 | RioCan | 18TORONTO FAVORABLE TO U.S. GATEWAY MARKETS
RioCan well positioned with strong property and tenant mix in highly desirable locations
♦Canada’s
Toronto stats
economic center
for various industries Highest population growth
Employment June 2020
~90% of Feb 2020 level
Attractive growth
prospects in office, retail
including finance, in Canada due to
despite pace of re-opening and residential rents
technology, education, immigration and migration
lags behind other regions relative to key U.S. cities
arts, and life sciences
“Technology companies are
hiring more workers in Toronto,
attracted by the region’s diverse
population of 6.4 million, a deep
pool of skilled labor and cultural
similarities to major U.S. cities
such as San Francisco, New
York and Chicago.”
- Wall Street Journal
San Washington,
Toronto New York Boston Chicago Los Angeles
Francisco D.C.
Office vacancy 2 2.0% 7.9% 7.5% 13.9% 15.2% 4.0% 14.5%
Retail 2,3
2.7% 8.5% 7.1% 11.7% 7.1% 4.6% 7.8%
vacancy / availability
Residential vacancy 1.5% 2.8% 3.6% 5.0% 3.9% 4.0% 4.1%
2,4
Population
1.8% 0.0% 0.5% -0.2% 0.1% 0.7% 0.8%
5-YR CAGR2
1. Source: StatsCan Labour Force Survey, Jun 2020
2. Source: CBRE Research , Q1 2020
3. Toronto data is based on vacancy rate; US data based on availability rate Investor Presentation Q2 2020 | RioCan | 19
4. Residential vacancy for Toronto is reported annually; value is as of 2019WHAT DRIVES TORONTO RESIDENTIAL RENTAL MARKET
POPULATION GROWTH RISING OWNERSHIP COSTS AND
PRIMARILY DRIVEN MORTGAGE STRESS TESTS SUPPLY / DEMAND IMBALANCE
BY IMMIGRATION PUSHING FAMILIES TO RENT
RENT GROWTH % OF POPULATION USING TRANSIT TO GET TO WORK
YoY Growth
60%
8.0% Annual Rent Growth
50%
Market '04 -'17 '18-'19
40%
6.0% Toronto +2.1% per year +7.0% per year
Vancouver +3.5% per year +6.1% per year 30%
20%
4.0%
10%
2.0% 0%
0.0%
2004 2006 2008 2010 2012 2014 2016 2018
YoY Rental Growth Rate
Source: CBRE Research, CMHC, October 2019 and Q1 2020 Source: Census 2016, StatsCan, US Census Bureau, American Community
Survey, 1-year Estimates, S0801, Commuting Characteristics by Sex Investor Presentation Q2 2020 | RioCan | 20UNLOCKING THE FULL POTENTIAL
OF HIGH DENSITY TRANSIT-ORIENTED LOCATIONS IN TORONTO
RioCan’s selected developments mapped to Toronto’s rapid transit system
Demographics, 5km radius
Toronto Pearson Average population1: ~320K
International Airport
Average household income1: ~$132K
Post-secondary education: ~62%
Legend
Under Construction: 2.3M sf
Completed Development: 0.8M sf
Future Development: 28.8M sf
Total (at RioCan’s Interest): 31.9M sf
TTC – Existing
Union
Station
TTC – Under Development
TTC – Station
CN Tower
Billy Bishop Planned Rapid Transit Line
Toronto City Airport
1. Demographic data within 5km radius of RioCan’s development pipeline in the GTA
Source: DemoStats – 2020 - Trends, ©2020 Environics Analytics Investor Presentation Q2 2020 | RioCan | 21WHAT DRIVES OTTAWA RESIDENTIAL RENTAL MARKET
CANADA’S CAPITAL WITH
GROWING TECHNOLOGY HUB LOW INVENTORY AND LAGGING
GROWING POPULATION AND CIVIL
(HOME OF SHOPIFY) SUPPLY
SERVICE SECTOR
LOW NEW RENTAL SUPPLY HIGH RENT GROWTH
New Supply as
Market New Supply Inventory
% of Inventory
Vancouver 2,668 113,421 2.4%
Calgary 558 41,247 1.4%
Edmonton 824 70,707 1.2%
Montreal 5,041 595,346 0.8%
Ottawa 1,235 65,003 1.9%
Toronto 1,075 316,704 0.3%
Source: CBRE Research, Canada Mortgage and Housing Corporation, June, 2020 Investor Presentation Q2 2020 | RioCan | 22VALUE CREATION IN TRANSIT-ORIENTED LOCATIONS IN OTTAWA
RioCan’s selected developments mapped to Ottawa’s transit system
Demographics, 5km radius
Average population1: ~166K
Average household income1: ~$103K
Post-secondary education: ~65%
Legend
Under Construction: 0.4M sf
Completed Development: 0.1M sf
Future Development: 2.2M sf
Total (at RioCan’s Interest): 2.7M sf
O Train System – Existing
O Train System Line Extension
Bus Rapid Transit
1. Demographic data within 5km radius of RioCan’s development pipeline in Ottawa
Source: DemoStats – 2019 - Trends, ©2020 Environics Analytics Investor Presentation Q2 2020 | RioCan | 23PROVEN MIXED-USED EXPERIENCE AND VALUE CREATON
Total estimates as of Q2 2020 for five recently completed development projects:
$574.9M $32.1M 5.6% $752.3M $203.6M
Total Estimated Estimated Yield on Estimated Total Estimated
Estimated Net Stabilized Total Costs Future Stabilized Incremental
Project Costs NOI Value 1 Value Creation2
Bathurst College Centre, Toronto
ePlace, Toronto King and Portland Centre, Toronto Frontier, Ottawa Sage Hills, Calgary
With direct links to two subway lines Top 10 most Influential Buildings
of the 2010s (Urban Toronto)
1. Excludes condo gains
2. Includes $26.2M of condo gains.
Investor Presentation Q2 2020 | RioCan | 24RIOCAN LIVING – HIGH QUALITY RENTAL RESIDENCES
Providing additional revenue diversification
eCentral, Toronto, ON Frontier, Ottawa, ON Brio, Calgary, AB
• 228 unit, 23-storey building
• 466 units, 36-storey building • 163 unit, 12-storey building
• 98.7% leased as of July 28,
• 94.2% leased as of July 28, 2020 • Despite lease-up commencing
2020 in midst of COVID-19 and in
• Rents averaging $2.50 per sf
Calgary, which has also been
• Rents averaging $3.92 per sf • Phase One Frontier is now impacted by the prolonged oil
(for market rent units) stabilized crisis, 31.5% leased as of July
28, 2020
• Stabilization expected in the • Phase Two Latitude is under
Summer to Fall of 2020 construction with expected • Rents averaging $2.51 per sf
completion date in 2021
Q2 2020 Residential Rent Collected: 99.3%
Residential accounts for ~1.7% of total annualized rental revenues as of Q2 2020
Investor Presentation Q2 2020 | RioCan | 25CONDO/TOWNHOUSE DEVELOPMENT AND VALUE CREATION
Strong pre-sales for condominiums and townhouses despite the pandemic
1. 3.
2. 1. Yorkville Condos (11YV)
98.0% of the 586 units pre-sold as of July 28, 2020 with first
possession anticipated in 2024. Estimated inventory gains
of $65.0M-$71.0M, at RioCan’s interest
2. Windfield Condos (U.C. Tower)
87.1% of the 503 units pre-sold as of July 28, 2020 with first
possession anticipated in 2023. Estimated inventory gains
of $14.0M-$16.0M, at RioCan’s interest
3. Windfield Townhomes (U.C. Uptowns)
81.7% of the 153 units pre-sold as of July 28, 2020 with first
possession anticipated in 2022. Estimated inventory gains
of $5.0M-$5.5M, at RioCan’s interest
Investor Presentation Q2 2020 | RioCan | 26PRUDENT APPROACH TO DEVELOPMENT
RioCan plans to primarily self fund development
through retained free cash flow, divestiture proceeds, strategic partnerships
and faster capital recycle from condo/townhouse development
As at
Target
June 30, 2020
Properties Under Development (“PUD”) & Residential Inventory $1.5B N/A
PUD and Residential Inventory as % of Gross Assets – Per Line of Credit
10.7% ~ 10%1
and Credit Facilities Agreements
Investment in Greenfield Development and Residential Inventory as % of
5.5% N/A
Unitholder Equity - Per Declaration of Trust
1. Maximum permitted is 15%. RioCan targets this metric to be no more than 10%
(except for short-term fluctuations as large projects are completed) Investor Presentation Q2 2020 | RioCan | 27COMMITTED TO ESG
Systematically embed environmental, social, and governance (ESG) considerations
Upcoming Sustainability Report to be Issued in August 2020
Environmental Tenant Engagement
GRESB Score Management System
77% Improved Public Disclosure Score
and achieved a 77% increase
and Utility Data
Survey
First ever survey of our
in survey score over two years Management System top 20 tenants in major markets
aligned to ISO 14001 77% of respondents
would recommend RioCan
41%
Habitat
Greenhouse Gas (GHG)
for Humanity
Emissions Verified
$100,000 donation made and
in accordance with ISO 14064-3 of management 140 employees volunteered
are female their time in Build Days
99% BOMA BEST
certified
Sustainability Policies
of Operations Community, Employee
>50 properties certified, as Volunteering, Procurement,
spending is from of December 31, 2019 Business Ethics
Canadian suppliers
Investor Presentation Q2 2020 | RioCan | 28EMBEDDING SUSTAINABILITY DAY TO DAY
Mitigating our environmental footprint across our business and in all new developments
Our ESG commitment in action:
• Recognized as the Top Ranked real estate firm on the
Best 50 Corporate Citizens in Canada in 2020 by
Corporate Knights
• Named Canada’s 2020 Clean50 Top Project Award for
Sustainable Commercial Real Estate Development
• Integrated a low-carbon, resilient deep lake water
cooling and heating system at our flagship development,
The Well, and developed a high efficiency geothermal
HVAC system in Frontier, our first operational RioCan
Living building in Ottawa, Ontario
• Launched a Green Bond Framework, the first for a REIT
in Canada, to support financing sustainable investments or
projects
• Established Sustainability in Developments Policy to
ensure low-carbon, energy and water efficiencies are
incorporated in all development designs and new builds
• Increased the number of properties achieving Building
Owners and Managers Association Building Environmental
Standards (BOMA BEST) certification to over 50 or nearly
40% of our portfolio
• Implemented the RioCan Impact Scorecard program
integrating corporate performance with an individual
employee’s annual objectives and incentives; each eligible
employee is required to include an ESG specific goal
Investor Presentation Q2 2020 | RioCan | 29APPENDIX CASE STUDIES Investor Presentation Q2 2020 | RioCan | 30
CASE STUDY | CREATING COMPELLING MIXED-USED CENTRES
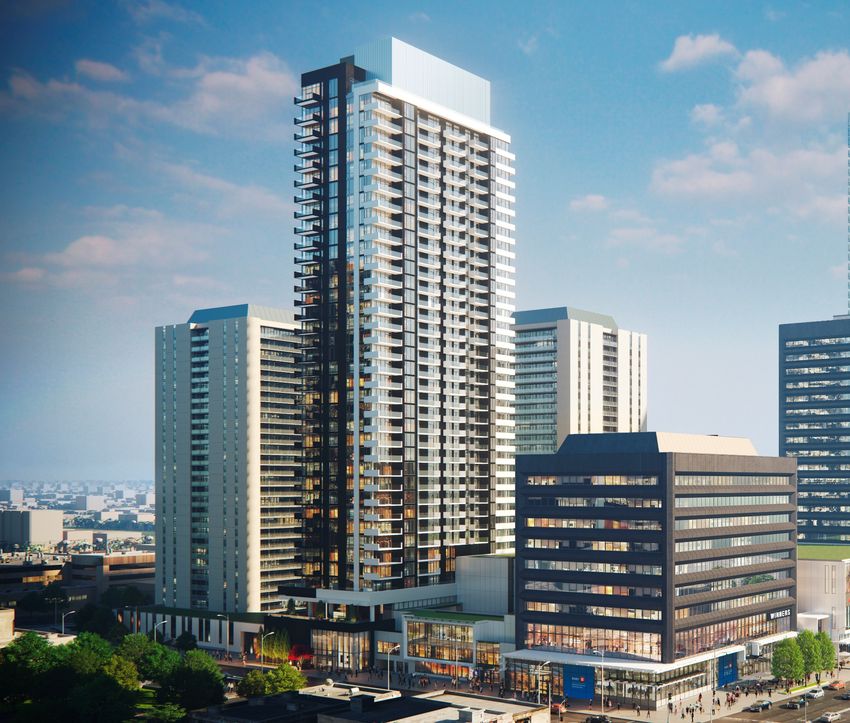
Yonge Sheppard Centre & Pivot
• Located at one of Toronto’s busiest intersections, with
access to the Yonge and Sheppard subway lines
• This mixed-use development will feature 399k sf of office
space, 309k sf of retail space, and 258k sf of residential
space (361 units) upon completion (at 100%)
• Two phased redevelopment underway:
- Phase I: A transformative overhaul of the retail and
office space to modernize the overall look and feel of
the property was completed in 2019
- Phase II: Residential tower under construction (2020),
targeted LEED Gold
100%
With ~63% of office leases expiring
Ownership
in next five years, which are below
current market rents
NLA on Completion
~1.0M sf
(at 100%)
86% (retail)
Leasing Status Demographics within 5km radius:
100% (office)
Population: 363K
LA Fitness, Longo’s, Average HH income: $153K
Major Tenants
and Cactus Club Cafe
Source: DemoStats – 2020 - Trends, ©2020 Environics Analytics
1. Net of certain working capital adjustments Investor Presentation Q2 2020 | RioCan | 31CASE STUDY | ePLACE (eCENTRAL & eCONDOS)
• eCentral is a 36 storey, 466-unit residential rental building in Toronto
• 94.2% leased as of July 28, 2020
• Rents averaging $3.92 per square foot (for market rent units)
• Unparalleled access to the Yonge subway and the new Eglinton Crosstown LRT
• Part of mixed-use ePlace which also includes:
• 22k sf of retail (flagship TD Bank and foodservice)
• 20k sf commercial condo
• 58 storey, 623 unit eCondos condominium tower (fully sold out,
possession in 2019)
Estimated $118.7M of value creation
Ownership 100%
Construction Start 2015
Construction Completion 2019
Total Cost1 $219.8M
Stabilized Value $307.8M
Value Creation ($M) $88.0M
Value Creation (%) 40.1%
Condo Sale Gains (@ 50%) $14.5M
Demographics within 5km radius:
Total Project - Value
$102.5M Population: 525K
Creation Average HH income: $184K
Stabilized NOI $11.3M Source: DemoStats – 2020 - Trends,
©2020 Environics Analytics
1. Net project costs include the purchase price for the second 50% interest in this property acquired in Q3 2019, net of interim and fee income during the
development period Investor Presentation Q2 2020 | RioCan | 32CASE STUDY | FRONTIER (GLOUCESTER PHASE ONE)
Frontier, Ottawa: Estimated $18.7M of value creation
• 23 storey, 228-unit residential rental
50% JV with
building Ownership
Killam REIT
• 98.7% leased with rent per square
foot averaging $2.50, as of July 28, Construction Start 2018
2020
Construction Completion 2019
• Located on a 7.1 acre portion of
RioCan’s Gloucester Silver City Total Cost 1 $33.5M
Shopping Centre
Stabilized Value $52.2M
• Adjacent to the new Confederation
LRT line at the Blair Station in Value Creation ($M) $18.7M
Ottawa
Value Creation (%) 55.8%
• Sustainable development including
a geothermal energy system Stabilized NOI $2.0M
Phase 1
Zoning has been approved for four residential RioCan Gloucester Silver City shopping centre Demographics within 5km radius:
towers on the site with up to 840 units tenant mix is strong and diverse: Cineplex theatre, Population: 143K
Chapters, Goodlife and numerous restaurants Average HH income: $93K
Source: DemoStats – 2020 - Trends,
©2020 Environics Analytics
1. Total costs are net of applicable interim and fee income during the development period Investor Presentation Q2 2020 | RioCan | 33CASE STUDY | KING & PORTLAND CENTRE & KINGLY CONDOS
Unlocking value through urban mixed-use development
Newly constructed office space is fully Existing 55k sf of previously existing
• Urban Toronto, transit-oriented location with leased to Shopify (183k sf) and Indigo adjacent office space is fully leased
frontage on King St (79k sf). Targeted LEED Platinum with significant rent upside potential
• One of the first projects in the RioCan/Allied
urban intensification joint venture.
• 646k sf mixed-use development (at 100%),
including Kingly, a 132-unit condominium
building
Estimated $52.7M of value creation
50% JV with Allied
Ownership
Properties REIT
Construction Start 2016
Construction Completion 2019
Total Cost1 $90.5M
Top 10 Most Influential Buildings of the 2010s
As selected by Urban Toronto, Jan 2020
Stabilized Value $132.2M
Value Creation ($M) $41.7M ~15k sf of retail space fully leased to restaurant Kingly Condos: 132 condominium
and food service curated to suit a dense, units sold out, exceeding price
Value Creation (%) 46.0% growing and desirable demographic expectations. Possession of the units
by purchasers commenced in Q3 2019
Condo Sale Gains $11.7M Demographics within 5km radius: and was completed prior to the end of
2019
Population: 576K
Total Project - Value Creation $53.3M Average HH income: $126K
Source: DemoStats – 2020 - Trends,
Stabilized NOI $5.6M ©2020 Environics Analytics
1. Total cost includes the total project costs of the commercial component of the project net of applicable interim and fee income Investor Presentation Q2 2020 | RioCan | 34
during the development periodCASE STUDY | TRANSFORMING TORONTO’S WEST SIDE
The Well
Located in downtown Toronto’s west side, The Well is a ~3.1M sf of
net leasable area (at 100%), first-of-its kind take on urban mixed-use
in Canada.
• 1.1M sf of office (84% pre-leased as of July 28, 2020 with
tenant possessions expected 2021)
• Construction of the 593-unit residential rental building (FourFifty
The Well) is scheduled to commence in Q3 2020 innovative
low-carbon, resilient cooling and heating technology
• Targeted LEED Platinum for retail and office component and
TGS Tier 2 for FourFifty The Well
Proposed
Investor Presentation Q2 2020 | RioCan | 35CASE STUDY | TRANSFORMING AN ICONIC LOCATION
RioCan Yonge Eglinton Centre
• Located at the intersection of the Yonge subway Driving value through demand in an iconic location:
station and the Eglinton Crosstown LRT Toronto 67.4% increase in office rent since acquisition
• In 2016 completed the transformation from a
traditional retail/office space into a vibrant mixed-
use destination centre (BOMA BEST Certified):
˗ Full redevelopment and expansion of the
retail space
˗ Office tower renovation and façade
improvements
˗ Addition of digital screens to drive ancillary
revenue
Estimated $347.0M of value creation since acquisition
Acquisition Date 2007
Total GLA 1,059,269 sf
Ownership 100%
Total Costs 1 $333.0M
Valuation Q2 2020 $680.0M
Driving growth through strategic Perfectly positioned through location
Value Creation ($M) $347.0M remerchandising. Addition of Sephora, & tenant mix to serve a high growth,
Cineplex VIP Cinemas, Winners and desirable demographic
Value Creation (%) 104.2% multiple national food service operators
69% or $9.98 growth in blended Demographics within 5km radius:
Value Creation CAGR 5.9% office and retail net rent psf since Population: 530K
acquisition Average HH income: $183K
NOI growth CAGR 7.1% Source: DemoStats – 2020 - Trends,
©2020 Environics Analytics
1. Total cost includes purchase price and revenue enhancing capital expenditures since acquisition but does not
Investor Presentation Q2 2020 | RioCan | 36
include maintenance capital expenditures2300 Yonge Street. P.O. Box 2386. Toronto, ON. M4P 1E4 | (T) 1-800-465-2733 or (416) 866-3033
You can also read