District wise Skill Gap Study for the state of Rajasthan Final presentation - NSDC
←
→
Page content transcription
If your browser does not render page correctly, please read the page content below
District wise Skill Gap Study for the state of Rajasthan
                           Final presentation

Proprietary and confidential. This information does not represent and should not be construed as, legal or professional advice. © 2011 NSDC. All Rights Reserved.   0
District wise Skill Gap Study for the state of Rajasthan
Objectives of the study
Methodology
State Overview
Recommendations
Proprietary and confidential. This information does not represent and should not be construed as, legal or professional advice. © 2011 NSDC. All Rights Reserved. 1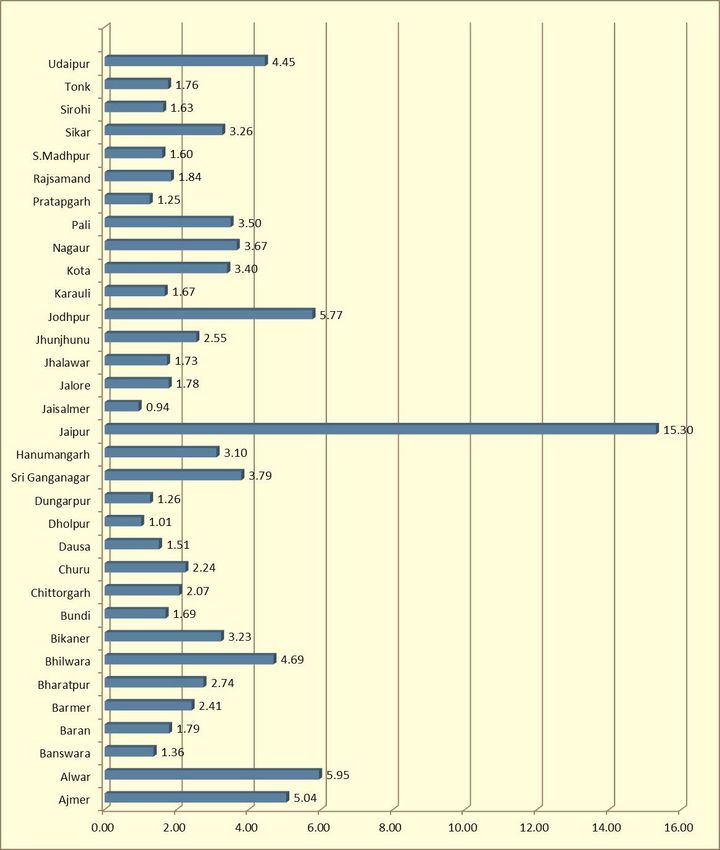
Objective of the study
Providing a comprehensive view to adopt a LIFECYCLE MODEL which would require an inclusive
participatory approach in skilling trainees to build sustainable livelihoods options by alignment of
the key stakeholders as follows:

 STATE GOVERNMENT
 • Establish an eco-system for skill development laying emphasis on districts with linkages with
   schemes and industry
 TRAINING PARTNERS
 • Set and manage career expectations of beneficiaries
 • Provide guidance on career building based on inputs from employers and market demands
 • Solicit feedback from beneficiaries on job satisfaction and aspirations match
 EMPLOYERS/ INDUSTRIES
 • Set clear career paths for all levels of employees, take cognizance of skill requirement and its
   availability
 • Deploy mentoring and apprenticeship programs to help employees build stable careers
 NSDC
 • Set and manage partner field of work as per requirements and opportunities
 • Provide guidance on skill building exercises to develop the portfolio of the state in skilling

                         VOCATIONAL EDUCATION MUST TRANSFORM TO NURTURE CAREERS AND BUILD HUMAN CAPITAL

 Proprietary and confidential. This information does not represent and should not be construed as, legal or professional advice. © 2011 NSDC. All Rights Reserved.   2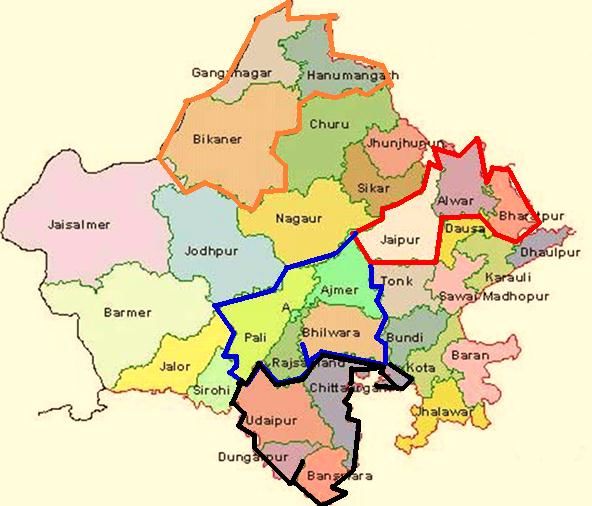
Objective of the study
      Ecosystem players and ecosystem enablers need to collaborate to achieve the desired performance goals as
      shown below:

              DEPARTMENTS                                              FUNDING                                                     DESIRED GOALS…
              (SUPPLY-SIDE)                                          INSTITUTIONS
            SCIENCE & TECH; RD;
                EDUCATION                                              NSDC; RSLDC

                                                                                                                          INCREASE TRAINING CAPACITY

                                          BENEFICIARIES                                                                   INCREASE TRAINING CAPACITY
                                                                                                                                 UTILIZATION

                                   STABLE CAREERS /                                                                           INCREASE % OF SKILLED
                                    HUMAN CAPITAL                                                                                  WORKFORCE
                       TRAINING
 DEPARTMENTS                                                    EMPLOYERS                                                    INCREASE INVESTMENT IN
                       PROVIDERS
(DEMAND-SIDE)                                                                       POLICY ADVISORS                                MENTORING
MSME; COMM & IT;
 INDUSTRIES; RD

                                                                                                                      REDUCE TRAINING DROP-OUT RATE

                                                                                                                              REDUCE ATTRITION RATE

                                             TRADE
                                          ASSOCIATIONS
         Proprietary and confidential. This information does not represent and should not be construed as, legal or professional advice. © 2011 NSDC. All Rights Reserved.   3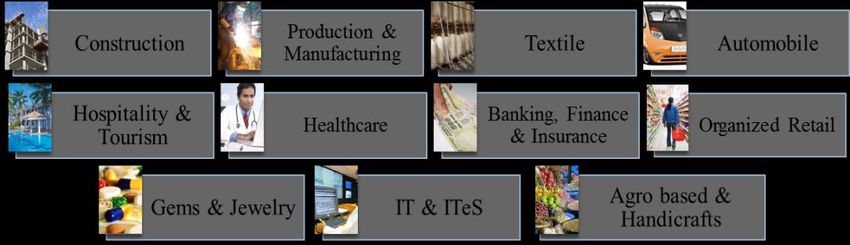
District wise Skill Gap Study for the state of Rajasthan
Objectives of the study
Methodology
State Overview
Recommendations
Proprietary and confidential. This information does not represent and should not be construed as, legal or professional advice. © 2011 NSDC. All Rights Reserved. 4
Methodology: To study the interplay between the Demand,
Supply & Support to bring out the skill gap

 Proprietary and confidential. This information does not represent and should not be construed as, legal or professional advice. © 2011 NSDC. All Rights Reserved.   5
Study Methodology: Mix of qualitative and quantitative
approach followed by academic projections
Primary Research
Secondary Research
Key Activities Skill development
planning
• Develop Key Activities
implementation Key Activities
• Data of workforce,
approach (interview
Skill Gap Study- education and • Analysis and
schedules, training
District wise district statistics etc. development of
etc.)
findings
• Workforce
• Field Survey
projections of the • Preparation of
deploying teams for
demand and supply district face sheets
interviews, FGDs, in-
in terms of:- • Optimization plans
depth interviews
•Workforce for each district
• Analysis of
participation
preliminary findings, • State Action Plan
Quantitative rates
Tools
Qualitative Tools case studies etc.
Key outcomes
•Growth rates
Key Stakeholders
• District Optimization
•Assumptions
• VTIs (RSLDC list), plans- report
Colleges • Support Systems of
• Action plan for the
each district in terms
• Industries & of :-
state- report
Secondary- data Associations (CII
• Sharing sessions
Primary-
gathering from
FGDs, support); Labour •Educational
recent reports, with primary and
Interview Observations, In Unions; District key Institutes
schedules with
statistical
Depth Interviews
secondary
abstract, census officials •VTIs
youths, with key stakeholders like
and population,
industries, VTIs
industrial reports,
stakeholders • Youths NSDC, RSLDC, PIAs
education etc. etc.
Proprietary and confidential. This information does not represent and should not be construed as, legal or professional advice. © 2011 NSDC. All Rights Reserved. 6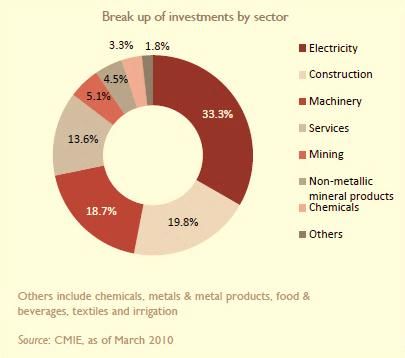
Primary and secondary survey was carried out as per agreed
sample and coverage
                                            Youth Respondent                                                                     Industries**
                                 Category                       Number Covered                                 Category                        Number Covered

                                  Trainee                                 670                               Large/ Medium
                                                                                                                                                          86
                                                                                                              Industries
                                 Employee                                 355
                                                                                                          MSME Industries                                280
                              Self-employed                               358
                                                                                                                   Total                                 366
                               Unemployed                                 646
                                                                                                    **Industries were selected across growth sectors of
                                    Total                                2029
                                                                                                    each district in stratified (disproportionate sampling)
                                                       VTI
                                 Category                       Number Covered                    Qualitative Surveys

                                                                                                  • FGD with Youth- 33
                            Government VTIs                                91                     • In depth Interviews with Government Departments- 33
                                                                                                  • In depth Interviews with College / University functionaries-
                                Private VTIs                              175                       10
                                                                                                  • In depth Interviews with Industry Associations-30
                                     Total                                266                     • In depth Interviews with Labour Union-09

                       Secondary Survey
                       • Desk Research on education status, population trends, demographic patterns, clusters and industries etc.
                       • Sources used were documents from Dept. of Economics & Statistics, Dept. of Industries, Census 2001 & 2011,
                         NABARD reports, Dept. of Education, Planning Commission etc.

 Proprietary and confidential. This information does not represent and should not be construed as, legal or professional advice. © 2011 NSDC. All Rights Reserved.   7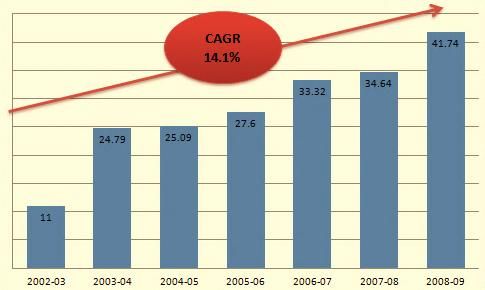
Projection of the workforce to capture demand and supply
    was done (with assumptions) using secondary data
Workforce projections can be extremely useful in preparing comprehensive plans to accommodate future population change, particularly changes in
the working-age population.

It has been estimated that more than one crore youth in the age group of 15 - 35 years will enter the job market every year for the next 15 years in
India. A major part of the job seekers are drop outs, matriculates, graduates and post graduates. Their employability is low due to lack of both
technical skills and non technical skills. Hence, the workforce projection is essential to analyze the future imbalances in the labour market.

                          Demand                                                                                                       Supply
•   Estimate the future level of output (X) or the economic                                                 •   Estimate the population projections by school age
    growth rate (to be calculated based upon the
    historical pattern of the sectors)                                                                          groups to be calculated on time based extrapolation
•   Estimate the structural transformation  of the                                                              (regression models)
    economy or the distribution of GDP by economic
    sector (Xi/X),                                                                                          •   Assessing the number of workers by educational
•   Estimate the labour productivity by economic sector                                                         level. To be calculated by using transition
    for the target year or its inverse (Li/Xi) and change
                                                                                                                probabilities to the base population
    between the base and target year
•   Estimate the occupational structure of the labour                            Skill Gap                  •   From the above two calculations we derive the
    force within economic sector (Lij/Li) for the target                          Model
                                                                                                                labour force participation for the projected year
    year- to be calculated by applying time series
    extrapolation                                                                                               (factoring in the population growth for the same
•   Estimate the educational structure of the labour                                                            period)
    force in given occupation within economic sectors
    (Lijk/Lij) for the target year to be calculated by
    applying Cohort regression model of projection
    across various age groups (15-29 yrs, 30-49 yrs
    and 50 above)
 Forecasted Demand = GDP of the region (for
                    Primary/Secondary/ Tertiary)
                          Value per worker (for the
                          particular sector)
       Proprietary and confidential. This information does not represent and should not be construed as, legal or professional advice. © 2011 NSDC. All Rights Reserved.   8
District wise Skill Gap Study for the state of Rajasthan
Objectives of the study
Methodology
State Overview
Recommendations
Proprietary and confidential. This information does not represent and should not be construed as, legal or professional advice. © 2011 NSDC. All Rights Reserved. 9Demographics & human development indicators Proprietary and confidential. This information does not represent and should not be construed as, legal or professional advice. © 2011 NSDC. All Rights Reserved. 10
State Overview - Demographics & human development
indicators
Parameters Rajasthan
Capital Jaipur
Geographical area (sq km) 342,239
Administrative districts (No) 33
Population density (persons per sq km)* 201
Total population (million)* 68.6
Male population (million)* 35.6
Female population (million)* 33.0
Sex ratio (females per 1,000 males)* 926
Literacy rate (%)* 67.1
Sources: Economic Review of Rajasthan 2011-12, Directorate of Economics and Statistics
*Provisional Data Census 2011
Rajasthan, the largest (area-wise) state in India, is Jaisalmer, Udaipur, Jodhpur, Ajmer, Bikaner, Alwar, Amber and
located in the Northwestern part of the Chittorgarh are some of the key cities and towns in the state
subcontinent. It is surrounded on the North and
Northeast by the states of Punjab, Haryana, and The most commonly spoken language of the state is Hindi. Marwari,
Uttar Pradesh, on the East and Southeast by the Jaipuri (Dhundhari), Mewari and Malvi are the other dialects popular in
states of Uttar Pradesh and Madhya Pradesh, and the state. English and Hindi are the medium of education in most
on the Southwest by the state of Gujarat schools
Proprietary and confidential. This information does not represent and should not be construed as, legal or professional advice. © 2011 NSDC. All Rights Reserved. 11State Overview - Demographics & human development
indicators
Rajasthan India
Demographic Indicators
2011 2011
1 Total Population (In Millions) 68 1210
2 % contribution to national population 5.67 100
3 Sex Ratio (females per 1000 males) 926 940
4 Under 6 sex ratio (females per 1000 males) 883 914
5 Birth rate (per 1,000 population) 26.7 22.1
Economic Indicators 2009-10 2009-10
6 Net domestic Product (at factor cost) (INR crores) (For state)
156951 4493743
Gross Domestic Product (at factor cost) (INR crores) (For India)
7 Contribution of Agriculture to NSDP/GDP (%) 19.6 14.62
8 Contribution of Industry to NSDP/GDP (%) 16.68 20.16
9 Contribution of Services to NSDP/GDP (%) 63.71 65.22
10 Per Capita Net State Domestic Product (factor cost) (INR) (for State)
23669 33731
Per Capita Net National Product (factor cost) (INR) (For India)
11 NDP Growth rate (%) (for State)
4.1 8
GDP Growth Rate (%) (For India)
Proprietary and confidential. This information does not represent and should not be construed as, legal or professional advice. © 2011 NSDC. All Rights Reserved. 12State Overview - Demographics & human development
indicators
Rajasthan India
Human Development Indicators
2007-08 2007-08
12 Human Development Index Value (HDI) 0.434 0.467
13 HDI Rank (out of 23) 17
2006 2006
14 Gender Related Development Index (GDI) 0.526 0.59
15 GDI Rank (out of 35) 31
2011 2011
16 Literacy Rate (%) 67.06 74.04
17 Male Literacy Rate (%) 80.51 82.14
18 Female Literacy Rate (%) 52.66 65.46
Poverty Indicators 2009-10 2009-10
19 Poverty Headcount Ratio (%) 24.8 29.8
20 Total number of poor (in millions) 16.7 354.68
Industrial Infrastructure 2011 2011
21 PPP projects (No) 67 881
22 SEZs (No) 10 386
PPP: Public Private Partnership, SEZ: Special Economic Zone
Proprietary and confidential. This information does not represent and should not be construed as, legal or professional advice. © 2011 NSDC. All Rights Reserved. 13Economic Indicators Proprietary and confidential. This information does not represent and should not be construed as, legal or professional advice. © 2011 NSDC. All Rights Reserved. 14
State Overview - Economic indicators of the state
% GDP contribution by sectors Rajasthan’s GDP Growth
Agriculture sector witnessed steady decline from Faster increase in GDP has resulted in rising income levels:
35.8% in 2001-2002 to 21.57% in 2010-2011 In 2009-2010, Rajasthan’s per capita GSDP at current
Manufacturing witnessed an increase in prices was Rs. 23669
contribution from 21.5% in 2001-2002 to 29.83% in The per capita GSDP at current prices increased at a
2010-2011 CAGR of 7.9 per cent from 1999-2000 to 2009-2010
Services is the dominant sector with its contribution
rising from 42.7% in 2001-2002 to 48.6% in 2010-
2011
Source: CMIE, March 10
Proprietary and confidential. This information does not represent and should not be construed as, legal or professional advice. © 2011 NSDC. All Rights Reserved. 15State Overview - Economic indicators of the state
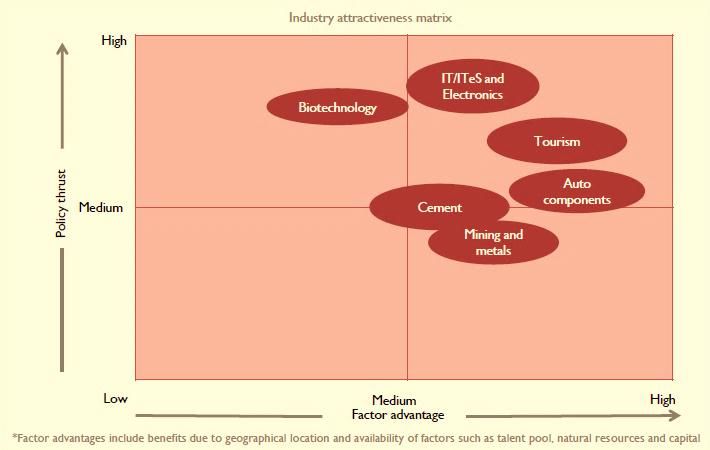
Rajasthan’s Industry Attractiveness Matrix Investments by Sector
According to the Reserve Bank of India, FDI inflows from April 2000 to May 2010 amounted to US$ 470 million
As of March 2010, outstanding investment in the state was US$ 53.6 billion
Electricity accounted for over 33 per cent of the states total outstanding investment followed by construction, machinery
and services (March, 2010)
The attractiveness matrix shows favorable conditions for services (IT/ITeS, Tourism), Auto with Oil & Gas as the
upcoming growth sector
Proprietary and confidential. This information does not represent and should not be construed as, legal or professional advice. © 2011 NSDC. All Rights Reserved. 16State Overview – Economic indicators of the state
Clusters and MSME in Rajasthan
Parameter Large and medium industries MSME
Working Units 507 2,97, 403
Investment (Rs crores) 45700 7650
Employment (lakhs) 2 11.9
Source: Economic Survey, 2009
Proprietary and confidential. This information does not represent and should not be construed as, legal or professional advice. © 2011 NSDC. All Rights Reserved. 17State Overview - Economic indicators of the state
62% of the state GDP comes
from just 12 districts namely
(top 5 districts):
• Jaipur- 15.30%
• Alwar-5.95%
• Jodhpur- 5.77%
• Ajmer-5.04%
• Bhilwara-4.69%
Overall, Rajasthan has following
advantages for its economy to
prosper:
• Easy access to largest
consumer markets - Rajasthan
touches six major states of the
Northern, Western and Central
India
Facilitating infrastructure
Conducive environment for
industrial growth
Basket of unexploited resources
Unique tourist attractions
Policy and fiscal incentives
Proprietary and confidential. This information does not represent and should not be construed as, legal or professional advice. © 2011 NSDC. All Rights Reserved. 18Education Indicators Proprietary and confidential. This information does not represent and should not be construed as, legal or professional advice. © 2011 NSDC. All Rights Reserved. 19
Education indicators in Rajasthan

       THE NUMBER OF PASSING GRADUATES WITH COLLEGE                                           THE NUMBER OF PEOPLE HAVING COMPLETED VOCATIONAL
      EDUCATION HAS GROWN AT 6.6% CAGR SINCE 2005-06                                            TRAINING HAS GROWN AT 12.3% CAGR SINCE 2005-06

                          College Graduates, 000s                                                                Vocational Education Finishers, 000s
450                                                                   421.9                16
                                                       393.4                                                                                     13.7           14.1
400                                      379.4
                          365.4                                                            14                                     12.8
                                                                                                                                                                       12.3
350        327.2                                                                                                    11.7
                                                                                           12
                                                                                                    10.3
300
                                                                                           10                                                           9.0
250
                                                                                             8                             7.2
200                                                                                                        6.3
                                                                                             6
150
                                                                                                                                         3.8
100                                                                                          4

 50                                                                                          2
  0                                                                                          0
         2005-06       2006-07         2007-08        2008-09      2009-10                         2005-06          2006-07      2007-08        2008-09        2009-10

                                  College Graduates                                                                   ITIs and ITCs       Polytechnics

            DEMAND FOR VOCATIONAL EDUCATION IS GROWING AT ALMOST TWICE THE RATE OF CONVENTIONAL HIGHER EDUCATION

  Source: Statistical Abstract,2011- Directorate of Economics and Statistics

      Proprietary and confidential. This information does not represent and should not be construed as, legal or professional advice. © 2011 NSDC. All Rights Reserved.       20
Education indicators in Rajasthan
RAJASTHAN IS THIRD BEHIND UP AND PUNJAB IN TERMS OF CAPACITY UTILIZATION RATES IN THE STATE ARE MORE THAN
SKILLING INSTITUTIONS IN THE NORTH ZONE TWICE OF THE NATIONAL AVERAGE
Number of ITIs AND ITCs Capacity Utilization (% of seats occupied annually)
300 100%
85.5% 86.8% 86.4% 88.5%
84.1%
250 81.0%
80% 75.8%
100
200
60%
150
32 40.0%
100 24 21 181 40%
50 78
106 89
36 20%
0 14
Delhi Haryana Punjab Rajasthan Uttar 0%
Pradesh
ITIs ITCs
RAJASTHAN BOASTS ONE OF THE HIGHEST CAPACITY UTILIZATION RATES FOR VOCATIONAL EDDUCATION IN THE COUNTRY
Source: Annual report2008-2009, Ministry of Labour & Employment; Working Group Report on Skill Development, 2009
Proprietary and confidential. This information does not represent and should not be construed as, legal or professional advice. © 2011 NSDC. All Rights Reserved. 21Education indicators in Rajasthan
Parameters Rajasthan Maharashtra Tamil Nadu Andhra Pradesh
Population (in lakhs), 2011 686.21 1123.7 721.3 846.6
Literacy (%), 2011 67.06 82.91 80.33 75.6
Seats in Higher & Technical Education Infrastructure, 2005
Engineering 20755 49667 108844 85000
Diploma 6890 45785 87671 18000
ITI 43824 90736 55426 110000
Arts & Science 360124 808527 674486 676120
MBA 75 • Literacy rate of Rajasthan is 67.06% lower than
national average of 74.04%
ITI+ ITC 430 • Ranks lowest in female literacy & 27th in male
literacy (reference slide section for details)
Polytechnics 40 • Number of seats in higher education was on the
lower side and similar was the result in the number of
Engineering Colleges 64 VTIs of the state
• Seat utilization in VTIs was just 83% in last 5 years
Colleges ('0) 113.5 with low pass percentage (67%); fund utilization also
remains at a low (13% for SJSRY) (reference slide
Schools ('00) 900 section for details)
Source: Statistical Abstract 2011, Dept. of Economics & Statistics-
0 200 400 600 800 1000
Rajasthan
Proprietary and confidential. This information does not represent and should not be construed as, legal or professional advice. © 2011 NSDC. All Rights Reserved. 22Education indicators in Rajasthan- Training & skill
development programs in the state
Department of Agriculture Directorate of Training RSLDC
Train 20,050 farmers, youths and farm Increase intake capacity to 4,00,000 Train 2,80,000 youths
women (KVK + Department) 379 new institutes proposed New partners for achieving results
Budget outlay – 1146 lakhs Take the overall tally to over 1200 ITIs + Strengthen training providers
Over 950 training programmes ITCs Rs. 7500 lakhs form State Government
Centrally Sponsored Schemes & RSLDC Scaling up strategies
supported
RGAVP Dept. of Local Self Governance RRECL
Train 17,000 rural youths Train 1,00,000 youths State Government to install 500 Solar
Part of Rajasthan Rural Livelihoods Rs. 2500 lakhs from State Government Voltaic Power Plants
Project Placement & certification of 70% trained Train 1,000 workers
Train SHG members for livelihoods 50 orientation cum trainings
Rs.3260 lakhs (Central + WB) Rs. 25 lakhs (Ministry of New and
Renewable Energy, GoI)
Dept. of Science & Technology Dept. of Tribal Area Development EMI & RKCL
Train 1,000 youths Train 10,000 youths EMI- training of trainers: 1750 ; 78
Skill & Entrepreneurship programmes Short term training to migrating laborers programmes; 5-12 days
Rs. 25 lakhs Placement camps Rs. 150 lakhs
Awareness camps- Rs. 20 lakhs (50,000 Establish 1 engineering college and ITIs RKCL- training 25,000 youths; IT literacy
students) in every tribal block training
Source : Working Group Report of the State on Skill Development- 12th Five Year Plan
Note: Refer to SWOT of Rajasthan Skill Initiatives for analysis of state schemes
Proprietary and confidential. This information does not represent and should not be construed as, legal or professional advice. © 2011 NSDC. All Rights Reserved. 23Education indicators in Rajasthan- Training & Skill
Development
PERFORMANCE ON SKILLING EFFORTS
District-level indicators (Sample Set)
JAIPUR
ALWAR Highly industrial districts such as Jaipur, Alwar, Kota
etc. have high levels of skilling intervention
KOTA
Districts like Tonk, Rajsamand, Jalore, Sawai Madhapur
& Pratapgarh seriously lack on the skilling front
JODHPUR
Districts near industrial zones such as Bikaner, Sri
UDAIPUR Ganganagar, Bhilwara, Chittorgarh, could become
catchment areas for skilling youth
AJMER
RAJSAMAND
JALORE Legends
High performing districts in skill development initiatives
TONK Average performing districts in skill development initiatives
Low performing districts in skill development initiatives
PRATAPGARH
Source: Accenture Analysis (based on various parameters and scoring to assess each district’s performance on skill development initiatives)
Note: Primary and secondary survey across 33 districts of Rajasthan based on GDDP, Skills and Training initiatives (like programmes approved by RSLDC in
the districts etc.) and industrial analysis
Proprietary and confidential. This information does not represent and should not be construed as, legal or professional advice. © 2011 NSDC. All Rights Reserved. 24Youth Aspirations
The courses on offer majorly are engineering based and thus the preference. There is also a high preference
for English language and IT training
Trainees across preferred trades in ITIs Aspirations of youth &
& ITCs (last 5 years) parents
20% 27% Government Jobs; IT
11% Related Jobs; Service
sector Jobs
12%
13%
17%
Home town based;
financial secured
Electrical & Electronics
Fitter Wage based; less risk;
COPA/ IT
Wiring
avenues of growth
Diesel Mechanic
Make-up, Tailoring, hair cutting etc.
MAJORITY OF TRAINEES ARE DISSATISFIED WITH STARTING SALARIES, PLACEMENT LOCATIONS AND COURSE STRUCTURE
Source: Accenture Analysis; Youth Survey
Proprietary and confidential. This information does not represent and should not be construed as, legal or professional advice. © 2011 NSDC. All Rights Reserved. 25Workforce in Rajasthan Proprietary and confidential. This information does not represent and should not be construed as, legal or professional advice. © 2011 NSDC. All Rights Reserved. 26
Workforce requirement across sectors and the skill gap of the
state
 INCREMENTAL WORKFORCE DEMAND, 2010 vs. 2017                                             SKILLS DEFICIT BY PROFICIENCY LEVEL, 2017 PROJECTIONS

                                                                                                           SUPPLY                        DEMAND
        Construction                                               3368
                                    550

             Textiles                                1861
                                         860

          Handicrafts                     972
                                       700

   Mines & Minerals                  654
                                   460                  Incremental                               SKILLED
                                                         Workforce                                2,17,000                             5,40,000           DEFICIT
          Healthcare                556
                             142                        requirement                                                                                        3.23 L
Tourism & Hospitality              498                   55.87 lakhs
                             170
                                                           (2017)
  Auto Mechanics &                 476
     Enginnering             112

                                 272                                                              SEMI-SKILLED
     Food Processing        22                                                                                                                            DEFICIT
                                                                                                  10,87,000                            30,91,000
                              213
                                                                                                                                                          20.04 L
               Retail        140

   Gems & Jewellery          210
                            50

                 BFSI        158
                            76                                                                    UNSKILLED
                                                                                                  62,40,000                            52,67,000         SURPLUS
            IT & ITeS        65
                            6                                                                                                                              9.8 L
                        0              1000      2000       3000     4000

                              2017            2010
 Source: Accenture Analysis
 Note:: Primary and secondary survey across high growth sectors and 33 districts of Rajasthan, refer to projections of supply, demand and workforce
   Proprietary and confidential. This information does not represent and should not be construed as, legal or professional advice. © 2011 NSDC. All Rights Reserved.   27
Demand of skilled workforce across various trades
Trades Demand Supply Support Remarks
Self employment; initial salary expected is
Electrician High High ITIs, ITCs
Rs.4000
None (a few Requirement of TALLY accounting in malls,
Computer Based
High Low initiated- private supermarkets, medicine shops; initial salary
Accountancy
training providers) expected Rs.4500
Localized (on job Self employment option with rise of mobility
Mobile Repairing High Low
training at shops) and accessibility; initial salary Rs.3500
Wiring & Repairing Private providers exist in few numbers; self
High Low ITIs, Polytechnics
(domestic) employment; initial salary Rs.3500
Engagement in two & four wheeler
Automobiles mechanic High Low None mechanic; self employment; initial salary
Rs.3500
Upcoming requirement as per the market
Courier Delivery High Low None
needs; initial salary Rs.3500
Potential in small scale set ups is high;
None (far less than
Sales & marketing High Low formalized training in sales in absent; initial
existing demand)
salary Rs.4000
Localized & Low High potential in Jaipur, demand very high
Gems & Jewelry High Low
(trained in industry) with initial salary of Rs. 4000
None (no specific
Skilling process is as per the trade and
Handicrafts & Handloom High Medium support apart from
initial salary is Rs 3000
MSME trg)
Proprietary and confidential. This information does not represent and should not be construed as, legal or professional advice. © 2011 NSDC. All Rights Reserved. 28Skills shortages across companies in different sectors
Industry Skills gaps Reason for skills gaps
Tourism & Service staff with problem-solving capabilities, IT skills, communication Life skills and communicative English; Basic Computers and service
Hospitality and customer interaction skills, and the ability to anticipate customer industry norms not provided; dealing with customers and problem
needs and proactively address them on the front line solving exposure not available to trainees
Cross-cultural managerial and service skills Expansion into emerging markets and growing customer base
Auto, Engineering, Lack of practical orientation Less skill trained workers available, have to do with 8th or 10th pass
Manufacturing, outs/drop outs
Machinery and
related Lacks Cross-functional and solution centric skills Task specific understanding; unable to gather bigger picture
Absenteeism and far less professional attributes Professional behaviour hindered by personal constraints
Handloom, For all workforces: Skills and knowledge, cross-functional skills and the
Handicrafts, ability to flexibly respond to rapid change of rural tourism market Transformation from mechanical to technological designing and
Furnishings, development for integrated solutions in this segment did not flow to all
Use of modern available technologies and techniques to reduce labour,
the artisan groups; lack of focussed initial basic modern training to
Textiles, Leather, and improve quality
cater for this huge market base of the districts
Gems & Jewelry
Knowledge of market trends- national & international Penetration into emerging markets, distributed work teams, less
focused market linkages
Retailer & service Skills in strategic insight, counter management, customer and results
orientation, iintercultural communication Business model change to a more decentralized, customer-centric,
integrated, seamless business penetrating new geographic markets;
Basic IT Skills, communicative English and local language, customer
increased importance of customer services in retail which are not
handling, solution providers
covered in the VTI training as a complete package
IT services Engineers and technologists whose functional and technical skills are Need to deliver tailored technology solutions to trainees for going
provider, IT complemented by strong business skills, industry skills, cross-cultural beyond a mere general application of technologies; penetration into
Software, BPO etc. teaming skills and often knowledge of specific geographic markets new curriculum for emerging markets
Proprietary and confidential. This information does not represent and should not be construed as, legal or professional advice. © 2011 NSDC. All Rights Reserved. 29Skills shortages across companies in different
sectors…continued
Industry Skills gaps Reason for skills gaps
Financial services Workers with broader knowledge and training focussed in all financial Lack of a more customer-centric training strategy; need to deliver an
Company products: cash, credit, insurance , services etc. entire suite of products related training materials with industry based
trainers
Innovation skills in multiple workforces No or less integrated trainings to address sales of banking products
with growth forums; lead bankers initiatives for designated training not
found and incentive strategies for motivation lacks
Building, Small workforce with basic skills available, adhoc or unskilled Specific training in this domain lacks at VTI level, industry involvement
Construction and engagement of workers high with less ability to carry out professional less in curriculum designing, placement and other functionalities.
Real Estates results Unskilled labor still preferred due to low cost module and generally
involves middlemen for interaction with industries
Learning agility- specific to the work assigned and less flexible to pick up
other related work
• The working population of the State is 280 lakhs and growing at the rate of 2.2% per annum
• Net addition of 6 lakh persons in the workforce every year
• Need to create 7-8 lakh new livelihoods every year
• Non-farm occupations employ one-third workforce with 70% share in State Domestic Product
• Only about 1.5% of the state workforce in the age group of 16 to 20 years has obtained vocational skills through formal
programmes/courses which needs to be targeted at 15% for initial three years followed by more aggressive plans
Proprietary and confidential. This information does not represent and should not be construed as, legal or professional advice. © 2011 NSDC. All Rights Reserved. 30Workforce and employers requirements
Workforce demand (present 2011 & future 2017) Industrial Regions of the state requiring workforce for output
2011 2017
Udaipur region
accounts for 9% of
industrial output Sri Ganganagar
Unskilled- 36.35%
Skill region
9.34% accounts for 4% of
industrial output
semi-skilled-
34.55% Semi-skilled-
47.06%
Jaipur region
accounts for 39%
of industrial output
Skilled-
16.59%
Unskilled-56.11%
Bhilwara region
accounts for 18%
of industrial output
Highly industrial districts such as Jaipur, Udaipur, Sri Ganganagar and Bhilwara require skilled workforce on higher
side (based on the industrial output and primary analysis)
Requirement of skilled and semi-skilled labour to cater 64% of the total workforce by 2017 (55.87 lakh would be the
incremental workforce)
Expectation on efficiency rated above skills and loyalty; industries depend on the contractors for semi-skilled wage
labourers and less on VTIs
Proprietary and confidential. This information does not represent and should not be construed as, legal or professional advice. © 2011 NSDC. All Rights Reserved. 31Summary of the study
Workforce in Rajasthan, 2022 projections Skill Gap & workforce distribution, 2017 projections
Projected
Population:
~887 lakhs
Unemployment rate of Rajasthan in 2011-12: 1.4 (ranks 4th in
overall national study by Labour Bureau, Ministry of Labour
Labour
and Employment )
Force:
~469 lakhs
Skill Gap in Rajasthan by 2017: ~24 lakhs (as per the study)
Work force: % of workforce under various categories by 2017: Skilled-
~362 lakhs 16.59%, Semi-skilled- 46.07%, Unskilled 36.35%
Incremental Human resource requirement across high growth sectors by 2017 & 2022: ~60 lakh & ~ 90 lakh
(projected values; sectors from secondary and tertiary only used for this analysis)
Proprietary and confidential. This information does not represent and should not be construed as, legal or professional advice. © 2011 NSDC. All Rights Reserved. 32District wise Skill Gap Study for the state of Rajasthan
Objectives of the study
Methodology
State Overview
Recommendations
Proprietary and confidential. This information does not represent and should not be construed as, legal or professional advice. © 2011 NSDC. All Rights Reserved. 33Broad Contours of Skill Development Plan Proprietary and confidential. This information does not represent and should not be construed as, legal or professional advice. © 2011 NSDC. All Rights Reserved. 34
Action points for key players and enablers of the state

 Proprietary and confidential. This information does not represent and should not be construed as, legal or professional advice. © 2011 NSDC. All Rights Reserved.   35
State-level Skill Development Plan: Nodal Agency, District
Skill Committee & Structures
Nodal Agency:
For more holistic and better
execution of skilling plans for the
state as a whole. RSLDC may
be one of the leading agencies
for anchoring the skilled
initiatives of the state
District Skill Committee:
Under the district magistrate or
collector to monitor some of the
monitoring aspects of the skill
development training programs
under various departments and
nongovernment organizations
(NGOs)
State Structure for Skilling:
Under the chairmanship of CM
& NSDC, involve all key
stakeholders and policy makers
by forming functional
committees and evolve a strong
structure to anchor huge skilling
programmes of the state
Proprietary and confidential. This information does not represent and should not be construed as, legal or professional advice. © 2011 NSDC. All Rights Reserved. 36State-level Skill Development Plan: State Sector Skill
Councils/Committees & Project Management Team
Project management team:
The project management team would have professionals taking on
various tasks of the nodal agency as their core responsibilities, and
delivering solutions for an enabling environment for skill
development initiatives
State Sector Skill Councils/ Committee:
Established across the state with the help of NSDC, industries and
institutions to facilitate focused skill development preferably for
industry clusters. The objective is sector-specific skill development,
in the target industries of construction, handicraft, automotive,
engineering, textiles, IT and IT-enabled services (ITeS), repair and
servicing, health care, gems and jewelry, banking and financial
services, tourism and hospitality
Proprietary and confidential. This information does not represent and should not be construed as, legal or professional advice. © 2011 NSDC. All Rights Reserved. 37Recommended implementation structure for state skilling initiatives The implementation plan for skill development would essentially address three basic questions: 1. What are the end results to be delivered to key internal and external stakeholders? 2. How can the state achieve the targeted outcomes? 3. Which apex body will drive the initiatives for the state based on measurable parameters of skilling’? Proprietary and confidential. This information does not represent and should not be construed as, legal or professional advice. © 2011 NSDC. All Rights Reserved. 38
Recommended state-level skill development framework
State to operate on three broad parameters with suggested
sub points
                                                                                                             The answers to the question shall address the
                                                                                                             following as part of overall state implementation plan:
                                                                                                             • Large scale programs to address the huge
                                                                                                                unskilled masses in unorganized and agriculture
                                                                                                             • Curriculum restructuring to match industry
                                                                                                                needs with an emphasis on shorter courses with
                                                                                                                quick turnover periods; on-the-job training and
                                                                                                                practical exposures to industry, guest lectures and
                                                                                                                field visits to be part of the course.
                                                                                                             • Soft skills such as effective communication
                                                                                                                should be an inherent part of all training, along
                                                                                                                with computer basics, financial literacy and time
                                                                                                                management.
                                                                                                             • Industry participation at the training and
                                                                                                                placement level should be encouraged. Industry
                                                                                                                associations such as CII , FICCI etc. need to play
                                                                                                                a major role in engaging skilled workforce in
                                                                                                                industries for more efficient outputs.
                                                                                                             • Policy Interventions with Skill voucher systems
                                                                                                                and bank led financing skill initiatives
                                                                                                             • Certification courses must be recognized with
                                                                                                                better placement of certified candidates for
Note:: Refer to Integrated Virtual Labour Market Snapshot slide
                                                                                                                standardization of skills in a cost-effective and
                                                                                                                speedy manner by state sector skill councils

 Proprietary and confidential. This information does not represent and should not be construed as, legal or professional advice. © 2011 NSDC. All Rights Reserved.     39
Recommended action points for stakeholders
• Industry Associations- as catalyst to encourage engagement of skilled workforce by industries
• Skilling of unskilled (surplus) workforce- PPP-based skilling initiatives for sustainable corporate
Industries (state citizenship actions & up-skilling of current workforce
of Rajasthan) • Average wage for the workers- post training to be adjusted as per the minimum wages law (~20%)
• Contracting models for engaging workers- minimum 22 days of work without any gender bias
• Proactive role in setting course curriculum in skill training
• Strengthening employment market linkage- strengthen employment market linkages by networking
with staffing agencies and linking supply with demand
Training Partners • Improving course curriculum – Focus on specialization, practical orientation, soft skills, shared
education services
• Improving the ITI, quality of training for trainers and encourage private training providers
• Building capability of clusters- Sector skill councils (SSC) as an important enabling factor from
which the state could leverage on the structure and the national occupational standards (NOS)
• Creating market awareness- target group will be engineering, arts and science graduates, ITI
students and diploma holders to set high aspirations, create awareness about emerging trends and
NSDC opportunities, and create role models
• Skill assessment, capacity building and support- map the current skill levels of students against
industry standards, with a specific focus on soft skills. The target group will be engineering,
polytechnic and ITI students
Proprietary and confidential. This information does not represent and should not be construed as, legal or professional advice. © 2011 NSDC. All Rights Reserved. 40Achievable targets must be set for each of the desired goals
…AND IT’S ACHIEVABLE TARGETS
Increase training capacity to train 10 lakh beneficiaries by 2017 by creating an additional 350 centers
Increase training capacity utilization to 100% from the existing 85% by advocacy and counseling at district level
Increase the proportion of skilled and semi-skilled workers from the current 9% and 35% to 20% and 40%
respectively by 2017
Increase investment in sustainable skill development training by additional 10% through PPP models
Reduce drop-out rates of training programs to 10% by 2017 from current levels of 30%
Reduce attrition rate in service sectors at entry job level to 10% by 2017 by post placement counseling and
continued up-skilling
Source: Accenture Analysis
Note: Based on the findings across districts, the points are deliberated in tangible manner to address the skill gap
Proprietary and confidential. This information does not represent and should not be construed as, legal or professional advice. © 2011 NSDC. All Rights Reserved. 41For Further Details
Industry Partner
National Skill Development Corporation
Block-A, Clarion Collection, (Qutab Hotel)
Shaheed Jeet Singh Marg
New Delhi 11 0 016
T: +91-11-47451600
F: +91-11-46560417
Email : skillgapstudies@nsdcindia.org
Proprietary
Proprietary and Confidential.
and confidential. This information
This information does does not represent
not represent and should
and should not
not be be constructed
construed asor
as, legal legal or professional
professional advice.advice
© 2011©2013
NSDC.NSDC. All Rights
All Rights Reserved
Reserved. 42You can also read