Research into Power Transformer Health Assessment Technology Based on Uncertainty of Information and Deep Architecture Design
←
→
Page content transcription
If your browser does not render page correctly, please read the page content below
Hindawi
Mathematical Problems in Engineering
Volume 2021, Article ID 8831872, 12 pages
https://doi.org/10.1155/2021/8831872

Research Article
Research into Power Transformer Health Assessment Technology
Based on Uncertainty of Information and Deep
Architecture Design

 Shuguo Gao,1 Jun Zhao,1 Yunpeng Liu,2,3 Ziqiang Xu,2 Zhe Li ,2 Lu Sun,1 and Yuan Tian1
 1
 Electric Power Research Institute of State Grid Hebei Electric Power Co., Ltd., Shijiazhuang 050000, China
 2
 Hebei Provincial Key Laboratory of Power Transmission Equipment Security Defense, North China Electric Power University,
 Baoding 071003, China
 3
 State Key Laboratory of Alternate Electrical Power System with Renewable Energy Sources, North China Electric Power University,
 Beijing 102206, China

 Correspondence should be addressed to Zhe Li; lizhe@ncepu.edu.cn

 Received 18 September 2020; Revised 10 March 2021; Accepted 17 March 2021; Published 2 April 2021

 Academic Editor: Gaetano Zizzo

 Copyright © 2021 Shuguo Gao et al. This is an open access article distributed under the Creative Commons Attribution License,
 which permits unrestricted use, distribution, and reproduction in any medium, provided the original work is properly cited.

 The uncertainty of the evaluation information is likely to affect the accuracy of the evaluation, when conducting a health
 evaluation of a power transformer. A multilevel health assessment method for power transformers is proposed in view of the three
 aspects of indicator criterion uncertainty, weight uncertainty, and fusion uncertainty. Firstly, indicator selection is conducted
 through the transformer guidelines and engineering experience to establish a multilevel model of transformers that can reflect the
 defect type and defect location. Then, a Gaussian cloud model is used to solve the uncertainty of the indicator criterion boundary.
 Based on association rules, AHP, and variable weights, the processed weights are calculated from the update module to obtain
 comprehensive weights, which overcomes the uncertainty of the weights. Improved DSmT theory is used for multiple evidence
 fusion to solve the high conflict and uncertainty problems in the fusion process. Finally, through actual case analysis, the defect
 type, defect location, and overall state of the transformer of the device are obtained. By comparing with many defect cases in a
 case-study library, the evaluation accuracy rate is found to reach 96.21%, which verifies the practicability and efficiency of
 the method.

1. Introduction consider the correlation between the indicators [1]. The
 overall health assessment of a transformer entails uncer-
With the continuous development of China’s electric power tainty in the assessment process and conclusion, so it is
industry, the transformer remains an indispensable part of necessary to research the uncertainty around transformer
the transmission and distribution links therein. The stable health from the perspectives of indicator criteria, weight
and healthy operation of transformers is related to the re- setting, and information fusion.
liability of power transmission, so the real-time health as- In recent years, much research into the evaluation of
sessment of a transformer can ensure the safety and stability transformer health conditions has been undertaken, among
of power grid operation. There are many transformer which the main idea is to determine transformer health
components, and there are many indicators that can reflect conditions according to transformer monitoring data and
the running state thereof. There is an inseparable relation- running conditions [1–9]. The literature [1] proposes a state
ship between each state indicator and between the indicators evaluation method using association rule analysis and
and the components. Therefore, the health assessment of the variable weight coefficient and mines the deep relationship
transformer should not only consider the reflection of the between single state quantity and comprehensive state
indicators on the operation of the transformer but also quantity through copious field data. However, that work [1]

2 Mathematical Problems in Engineering

is too absolute in terms of dividing the criterion boundary of benchmark for the construction of a state evaluation system,
the indicator and fails to consider the uncertainty of the which covers the composition of state variables from dif-
boundary while neglects the multilevel structure of trans- ferent sources and forms of the transformer, taking into
formers and using a scoring method that is too simple. A account the types of different indicators. Under the principle
previous study [3] proposes a defect diagnosis method of of guaranteeing the comprehensive acquisition of key pa-
integrated set pair analysis and association rules and im- rameters of transformers, 66 final transformer indicators are
proves the weight setting and positive judgment rate based screened by association rules in this paper (Table 1). At the
on association rules. However, the fuzzification function of same time, the book information, defect information, his-
the indicator is too rigid to conform to the actual function torical defect, family defects, bad working conditions, op-
distribution and has the problem of no hierarchy. The state erating environment, and other information about each
quantity fusion method also has certain defects. In reference transformer are also collected on site.
[4], the fuzzy membership function is employed to describe The deterioration of transformer health is usually ac-
the boundary uncertainty of the criterion, and the indicator companied by the occurrence of transformer defects.
is considered; however, the weight setting in [4] does not Therefore, the evaluation of transformer defect type can
take actual failure cases into consideration. The DS evidence effectively help the operation and maintenance personnel
theory fusion used therein cannot solve the problem of high discover problems with transformers. At the same time,
conflict existing in transformer state quantity data fusion. In solving transformer defects timeously and restoring trans-
view of the above analysis, the existing transformer state formers to a healthy condition can ensure the safe and stable
evaluation method still lacks a more practical and perfect operation of the power grid. Based on the distribution
system. statistics of defect types of a large number of on-site defect
 In view of the above problems, in the present research, a cases and the experience of on-site personnel, we summarise
multilevel health assessment method is proposed for power 11 types of typical and frequent transformer defects
transformers that account for information uncertainty. First, (Table 2).
a deep architecture design of the equipment health assess- A transformer is a comprehensive and complex system,
ment system was conducted, and a hierarchical assessment composed of multiple components. The evaluation results
indicator system comprising an equipment layer, compo- obtained by the simple fusion of all indices by the traditional
nent layer, defect layer, and indicator layer was constructed. method cannot reflect the multilevel differences in a
Then, based on the Gaussian cloud model, the degree of transformer, and the evaluation accuracy is poor, so it is
deterioration of the state indicators was evaluated, and the important to classify the evaluation levels according to the
relative importance of the factors at each level is measured by actual structure and mechanism of operation of the trans-
combining the analytic hierarchy process, the association former under inspection [12]. From the perspective of
rule analysis method, and the deterioration variable weight components, the transformer can be divided into five parts:
method. Thereafter, improved DSmT theory is used to in- the body, bushing, on-load tap changer, cooler system, and
tegrate the evaluated results from each level and reconcile nonelectric power protection device. Among them, the body
any conflicts between the conclusions. Finally, the verifi- and bushing are the main parts of transformer operation,
cation case study shows that the proposed method can be and these two parts are subject to various stresses over a long
used to identify abnormalities in such equipment. This paper time and are prone to failure, so the specific failure types of
overcomes a previous problem whereby the evaluation these two parts need to be considered; however, there is no
obtained using the traditional method is insufficiently tar- clear defect classification for such a cooler system, on-load
geted. The new combination method of weights better re- tap changer, and nonelectric power protection device in
flected the true operating status of components and service, so the state can be directly reflected by other
equipment. Based on the improved DSmT theory, this paper indicators.
addresses the problem whereby traditional evidence theory
cannot effectively integrate highly conflicting evidence.
 2.2. Deep Architecture Design of the Transformer Evaluation
2. Establishment of Assessment System System. Based on the above analysis, a multilevel compre-
 and Process hensive health assessment model of four layers, namely, the
 indicator layer, defect type layer, component layer, and
2.1. Selection of State Indicators and Defect Types. The equipment layer, is constructed, which represents the overall
multisource heterogeneous indicator of a transformer in- operating health condition of the transformer, operating
cludes real-time monitoring data, routine test data, infrared conditions of transformer components, transformer defect
images, and other indices, which can reflect the operation of type evaluation, and deterioration of multisource indicators
transformers from different perspectives and at different of the transformer (Figure 1). The overall health condition of
levels; therefore, it is the primary problem of the transformer the transformer is the top layer, which is also the final
state evaluation to select and process state quantity rea- evaluation result. The current operating health condition of
sonably and accurately. At present, Guide for Condition the transformer can be judged by the evaluation result. Then,
Assessment of Oil-Immersed Power Transformers (Reac- the whole system is divided into five parts: the body, the
tors) [10] and IEEE Guide for Assessment and Maintenance bushing, the on-load tap changer, the cooler system, and the
of Liquid-Immersed Power Transformers [11] are used as the nonelectric power protection device. The operating
Mathematical Problems in Engineering 3

 Table 1: Distribution of transformer indicators.
Part Single indicator
 H2 content C2H2 content
 C2H4 content C2H6 content
 CH4 content Total hydrocarbon content
 Absolute gas production rate of H2 Absolute gas production rate of C2H2
 Absolute gas production rate of total hydrocarbon Relative gas production rate of total hydrocarbon
 Absolute CO gas production rate Absolute CO2 gas production rate
 Initial difference of winding DC resistance Imbalance rate of winding DC resistance
 Apparent discharge Core grounding current
Body
 Core insulation resistance Polarization index
 Winding insulation resistance Winding absorption ratio
 Initial difference of short-circuit impedance Imbalance rate of short-circuit impedance
 Difference of winding voltage to initial value Initial difference of winding capacitance
 Loss factor of oil medium Furfural content
 Winding frequency response test Insulation paper degree of polymerisation
 CO content CO2 content
 Water content in oil Winding dielectric loss
 H2 content C2H2 content
 CH4 content Dielectric loss factor of bushing
 Initial difference of bushing capacitance Insulation resistance of bushing end screen
Bushing
 Insulation resistance of bushing Infrared image analysis
 C2H4 content Total hydrocarbon content
 Bushing leakage Bushing oil level indicator
 Tap switch oil level indication Oil filter for tap changer
 Tap changer respirator Limit device of tap changer
 Tap position Tap switch slide
OLTC
 Tap leakage Tap switch control loop
 Tap switch transmission mechanism Action characteristics of tap changer
 Number of tap changers Tap switch oil pressure
 Oil flow relay state Radiator working state
Cooler system Fan, oil pump, water pump state Cooler system motor operation
 Cooler control system state
 Thermometer indication Oil level indicator indication
Nonelectric protective device Gas relay malfunction Pressure release valve malfunction
 Consistency from a distance

 Table 2: Distribution of defect types by component.
Part Single defect
 Winding interturn short circuit Winding deformation
 Iron core multipoint grounding Partial discharge
Body
 Aging of oil paper insulation Arc discharge
 Current circuit overheating Wetted insulation
 Thermal performance of the bushing decreases
Bushing Insulation performance of the bushing decreases
 Mechanical performance of the bushing decreases

condition of each part can be obtained through the evalu- 3. The Uncertainty Information
ation. For the relatively important body and bushing, it is Processing Method
divided into defect type layer, including winding interturn
short circuit, partial discharge, the thermal performance of 3.1. The Indicator Uncertainty Method Based on a Gauss Cloud
the bushing decreases, and so on, and the distribution of Model. A transformer is a complex multilevel system, so the
grade membership degree of each defect type can be ac- simple deterioration method based on warning value ignores
quired by evaluation. The bottom layer contains many the problem that the indicator criterion is too absolute and
operating indicators pertinent to the transformer, corre- cannot truly reflect the uncertainty existing in the actual
sponding to different defect types, respectively. The cooler operation of a transformer. Therefore, Gaussian cloud
system, on-load tap changer, and nonelectric power pro- processing is conducive to improving the accuracy of the
tection device directly correspond to the indicator layer. evaluation [13].
4 Mathematical Problems in Engineering

 Equipment layer Component layer Defect layer Indicator layer

 Partial discharge Total hydrocarbon content
 Arc discharge Core grounding current
 Body
 Winding deformation Furfural content
 … …

 Thermal performance of the Initial difference of bushing
 Bushing bushing decreases capacitance
 … …

 Oil-immersed
 large power Tap switch oil level
 transformer indication
 OLTC
 Tap changer respirator
 …

 Radiator working state
 Cooler system
 …

 Nonelectric power Thermometer indication
 protective device …

 Figure 1: Transformer multilevel comprehensive architecture model.

3.1.1. Treatment of Deterioration of Indicators. There are A negative deterioration indicator is treated as in the
many indicators of the transformer with different orders of following equation:
magnitude, so here we use a relative degree of deterioration Xrt0 − Xrt
to normalise the indices. For structured data, it can be di- ⎪
 ⎧
 ⎪ , Xrta ≤ Xrt ≤ Xrt0 ,
 ⎪
 ⎪
vided into a positive degradation indicator and negative ⎪ Xrt0 − Xrta
 ⎪
 ⎪
 ⎪
 ⎨
degradation indicator according to whether it increases or xrt � ⎪ (2)
decreases from normal to abnormal degradation. A positive ⎪
 ⎪ 1, Xrt < Xrta ,
 ⎪
 ⎪
deterioration indicator refers to the trend of increasing the ⎪
 ⎪
 ⎪
 ⎩
value of a transformer indicator when it deteriorates, such as 0, Xrt ≥ Xrt0 .
the grounding current of iron core and furfural content. A
negative degradation indicator indicates that, when the In (2), xrt is the normalised degree of deterioration of the
indicator deteriorates, the value shows a decreasing trend, indicator, r is the number of defect types, t is the number of
such as DC resistance. indices, Xrt is the measured value of the indicator, Xrt0 is the
 A positive deterioration indicator is treated as in the initial value of the indicator, and Xrta is the warning value of the
followingequation: indicator. Its value refers to DL/T 596-1996 Preventive Test
 Rules for Electric Power Equipment, in which only the attention
 Xrt − Xrt0 value is given in the regulation, and the warning value is
 ⎪
 ⎧
 ⎪ , Xrt0 ≤ Xrt ≤ Xrta , converted by multiplying by 1.3 (positive deterioration indi-
 ⎪
 ⎪
 ⎪ Xrta − Xrt0
 ⎪
 ⎪ cator) or dividing by 1.3 (negative deterioration indicator).
 ⎪
 ⎨
 xrt � ⎪ (1) According to Guide for Condition Assessment of Oil-Immersed
 ⎪
 ⎪ 1, Xrt ≥ Xrta , Power Transformers (Reactors) and the existing references, the
 ⎪
 ⎪
 ⎪
 ⎪ health state of power transformers is generally divided into four
 ⎪
 ⎩
 0, Xrt < Xrt0 . grades, and the corresponding relationship with the deterio-
 ration degree of indicators is listed in Table 3.
Mathematical Problems in Engineering 5

 Table 3: Classification of transformer state.
 Relative degree of
Level Meaning
 degradation
Normal [0, 0.2] Normal equipment: the transformer can run stably and healthily
 Suspicious equipment state: the transformer can continue to run under the premise of enhanced
Attention (0.2, 0.4]
 monitoring
Abnormal (0.4, 0.7] The equipment is in a poor condition or has minor defects
Serious (0.7, 1] Equipment has a serious failure and needs to arrange overhaul as soon as possible

3.1.2. Gaussian Cloud Model. In probabilistic terms, the superentropy He represents the degree of deviation of the
Gaussian distribution is one of the most important and cloud droplet distribution from the Gaussian distribution,
widely used probability distributions: the Gaussian mem- that is, the range of fluctuation of the correlation k is
bership function is the most commonly used membership determined.
function in fuzzy theory. The Gaussian cloud model uses the Based thereon, building a standard grade cloud model is a
Gaussian distribution to realise the distribution of cloud key step in the process of assessing the deterioration of state
titration values twice and uses the Gaussian membership indicators. The extension cloud theory regards the hierar-
function to realise random determination [14, 15]. chical boundary as a double-constrained space [cmin, cmax].
 Let U be a quantitative domain of precise numerical After considering the uncertainty of the boundary value of the
representation and C(Ex En He ) be a qualitative concept on constrained space, it is appropriately expanded into a
U. If the quantitative value x∈ U, and x is a random real- Gaussian cloud. According to the definition of cloud ex-
isation of the qualitative concept C, x follows the Gaussian pectation, the central value of the constraint interval can best
distribution with Ex as the expectation and Enn as the represent the concept of rank, so the calculation of grade
variance, namely, x∼N (Ex , Enn ). Among them, Enn follows cloud expectation Ex is as given in (7). As a measure of state-
the Gaussian distribution with En as expectation and En as level concept ambiguity, the value of the level cloud entropy
variance, i.e., Enn ∼N (En , He ), and the determinacy of En is the most critical, and its size reflects the range of values
quantitative value x to qualitative concept C is as follows: that the state-level concept can accept, which will affect the
 2 adjudged indicator degradation. The calculation process is as
 ⎝− x − Ex ⎠ shown in equation (8). The superentropy He of the grade
 y � exp⎛ 2
 ⎞, (3)
 2 Enn cloud generally takes a fixed constant value, and this can be
 optimised and adjusted according to prevailing
where x is the degree of deterioration of an evaluation in- circumstances.
dicator; Ex , En , and He are the mathematical characteristic c +c
values of a standard grade corresponding to the evaluation Ex � min max , (7)
 2
indicator; Enn is a normal random number with expected
value En and standard deviation He . cmax − cmin
 By constructing a forward cloud generator, a cloud drop En � . (8)
 6
sample diagram of Ex � 1, En � 0.1, and He � 0.01 is generated,
in which the number of cloud drops is set to 500 (Figure 2). In the section of “Treatment of deterioration of indi-
The envelopes of the cloud droplets represent the inner and cators,” the membership functions of the four states cor-
outer correlation curves l1 and l2 of the Gaussian cloud, responding to the related indices can be calculated by using
respectively, and the curve at the middle position is the the aforementioned Gaussian cloud correlation function
expected curve l of the Gaussian cloud. The expressions of formula.
the three are as shown in equations (4) to (6):
 2 3.2. Weight Uncertainty Based on Comprehensive Weight
 ⎝− x − Ex ⎠,
 l1 � exp⎛ 2
 ⎞ (4) Assignment Method. In transformer state assessment,
 2 En − 3He weight setting is extremely important. Considering the
 limitations of the subjective weighting method and the
 x − Ex
 2 objective weighting method, a method of weight combi-
 ⎝−
 l2 � exp⎛ ⎠,
 ⎞ (5) nation of state indicators based on AHP and association rule
 2
 2 En + 3He analysis is proposed, making the assessment results better
 aligned with actual requirements.
 2
 ⎝− x − Ex ⎠
 l � exp⎛ 2
 ⎞. (6)
 2 En 3.2.1. Association Rules. An association rule is used to reveal
 the correlation between different indicators of an event.
 For a fixed cloud drop x, the intersection of the three Based on data mining, an association rule finds the subset of
curves represents the minimum correlation ymin, the max- indicators or attributes frequently occurring upon the oc-
imum correlation ymax, and the expected correlation degree currence of the event and the correlation between them
yexp calculated by the extension cloud model: the size of the through statistical rules [16, 17].
6 Mathematical Problems in Engineering
1.0
0.8
Relevance k
0.6
0.4
0.2
0.0
0.6 0.8 1.0 1.2 1.4
x
External correlation curve
Internal correlation curve
Expectation curve
Figure 2: Gaussian cloud model.
In general, association rules between two events are (11), the degree of confidence of a defect association rule
calculated with support and confidence. Support is defined Ai,j ⟶ Bi can be calculated as follows:
as hypothesis set A ⊂ D, B ⊂ D, and A ∩ B � ∅. Support for
association rule A ∩ B � ∅ is the percentage of database D P Ai,j ⋃Bi σ Ai,j ⋃Bi /|D|
containing A⋃ B, denoted as C Ai,j ⟶ Bi � �
P Ai,j σ Ai,j /|D|
(11)
Sup(A ⟶ B) � P A⋃B . (9)
σ Ai,j ⋃Bi
� × 100%.
At this point, the closer the support is to 1, the stronger σ Ai,j
the relationship between occurrences A and B. The degree of confidence of a single indicator in each
The confidence of association rule A ⟶ B is the per- defect type is calculated using equation (11), and then, the
centage of database D containing both A and B, that is, the degree of confidence of each indicator in the same defect
conditional probability P(B|A), denoted as type is compared, and the constant weight coefficient of each
indicator in this defect type is determined according to the
P A⋃B degree of confidence of each indicator. The calculation is as
(10) follows:
C(A ⟶ B) � P(B|A) � × 100%.
P(A) Ci,j
wi,j � , (12)
Confidence represents the reliability of association rules, Ci,1 + Ci,2 + Ci,j + · · · + Ci,mi
that is, the higher the confidence, the higher the reliability of where wi,j is the constant weight coefficient of the jth single
A when B occurs; therefore, in transformer state assessment, indicator in the ith defect type and Ci,j represents the
if the severity of defects is described by the deterioration of confidence of the jth single indicator in the ith defect type. mi
indices, the objective weight of indices corresponding to is the number of single indicators contained in the ith defect
each defect type should be judged by the degree of confi- type.
dence. That is to say, the higher the confidence in a certain
indicator is, the greater the influence of its deterioration on
defects. 3.2.2. Analytic Hierarchy Process. The analytic hierarchy
The confidence of each transformer indicator corre- process (AHP) is a multiobjective decision-making analysis
sponding to the defect type can be calculated as follows: method combining qualitative and quantitative components
as formally proposed by Saaty in the mid-1970s. Its concept
(1) Transaction database D � {any comprehensive involves the combination of complex multiobjective deci-
overstandard state quantity} sion-making techniques. The problem is hierarchical and
(2) Event Ai,j � {the j single state quantity in the ith standardised: the relevant factors are compared layer by
comprehensive state quantity exceeds the norm} layer, and the rationality of the comparison is tested layer by
layer to provide credible analytical results. Therefore, in the
(3) Event Bi � {type i defect occurrence}
present research, the analytic hierarchy process was used to
In the system used here, when analysing a defect and its determine the subjective constant weight of the state
indicators, database D is item set B; therefore, according to indicator, as follows:Mathematical Problems in Engineering 7 Step 1. For an evaluation target involving n state indicators, Elsewhere [18], the equilibrium function is introduced industry experts construct judgment matrix A by comparing into the form of the variable weight synthesis mode, and the the importance of the state indicators according to the nine- variable weights are given by level scale criterion, in equation (13), where aij is the relative wi x1−α importance score of state index i to state index j: wvi � i . (18) p�1 wp x1−α n p a11 . . . a1n ⎢ ⎡ ⎢ ⎢ ⎥⎤⎥⎥⎥ A �⎢ ⎢ ⎥ ⎣ ⋮ ⋱ ⋮ ⎥⎦ � aij n×n. ⎢ ⎢ (13) In (18), α is an equilibrium function, 0 ≤ α ≤ 1, whose value depends on the relative importance of each defect type. an1 . . . ann When the degree of equilibrium of defect types is not high, take α > 0.5; when serious defects of some comprehensive Step 2. Calculation of the approximate weight ψ i of each state variables are excluded, α < 0.5; when α � 1, the model state index under the evaluation target. Commonly used degrades to the constant weight model. To maximize the calculation methods include the geometric average method influence of the deterioration of the evaluation factors on the and canonical column average method. The former is se- overall evaluation of components and equipment, α � 0 is lected here, and the calculation process is as follows: used. ������� By introducing variable weight coefficients, the weight n nj�1 aij coefficient of state quantity can be automatically adjusted ψi � �������. (14) when severely degraded. This can better represent the state of nm�1 n nj�1 amj deterioration of the transformer and meet engineering re- quirements at that time. The comprehensive weight is calculated based on 428 Step 3. To verify the rationality and validity of the weight defect cases, but it is difficult to maintain the accuracy of the distribution, a consistency test must be performed on the evaluation for a long time based on the existing defect case judgment matrix. The test is as given by equations (15) and database alone. Therefore, a self-updating module of weights (16). When CR < 0.1, the consistency test is successful; is added to incorporate continuously new defect data into otherwise, the judgment matrix must be readjusted until it the database. This is then adjusted to achieve more accurate passes the consistency test: and comprehensive assessment results. When a new CI transformer defect occurs on site, the staff enter the defect- CR � , (15) related data into the evaluation system. While assessing the RI transformer state, the database is also updated. The constant λmax − n weights based on association rules will be recalculated and CI � . (16) then changed. The updated comprehensive weights are n−1 processed and used as the basis for the next evaluation. In (16), λmax represents the largest characteristic root of the judgment matrix; CI is the consistency index; RI is the average random consistency index, which is the sampling 3.3. Transformer Uncertainty State Fusion Method Based on average of the consistency index, and its value can be found Improved DSmT. DSmT is a new fuzzy contradictory rea- from standard tabulated values; CR represents the consis- soning theory proposed by Dezert and Smarandache, which tency ratio index. can be regarded as a natural extension of D-S evidence Here, 428 sets of defect sample data of large power theory (Dempster–Shafer theory), but there are important transformers rated at 66 kV and above are selected. The differences between them. When the conflict between in- objective weight, subjective weight, and comprehensive formation sources is large, D-S theory often fails to merge or weight of each indicator relative to each defect type are produces paradoxical results after fusion. DSmT can deal calculated by using association rules and AHP, as shown in with the fusion of uncertain, highly conflicting, and inac- the supplementary material (available here). curate information sources that D-S cannot resolve [19, 20]. Considering that different states of the transformer have 3.2.3. Variable Weight Coefficient. Variable weight theory is different weights, DSmT needs to be improved before being widely used and is an important modelling principle invoked merged. in factor space theory. The following variable weight formula Considering that DSmT model constructed in this paper is introduced in the comprehensive health assessment of is constrained by completely exclusive conditions, it is transformers: necessary to be based on proportional conflict redistribution (PCR) rules. Distribute the conflict reliability generated in wi /xi the fusion process to the synthetic reliability according to a wvi � n , (17) p�1 wp /xp certain ratio, so as to use the evidence more effectively. According to different allocation ratios, PCR rules are where wvi is the variable weight coefficient of defect type i; xi mainly divided into PCR1 to PCR6 rules, of which PCR6 is is the score of the defect type i; n is the number of defect the most precise combination rule in mathematical logic types; wi is the constant weight coefficient of defect type i. [21].
8 Mathematical Problems in Engineering The specific definition of PCR6 rules is as follows: Θ ⎪ ⎧ ⎪ ∀(A ≠ ∅) ∈ D , ⎪ ⎪ ⎪ ⎪ ⎪ ⎪ ⎪ ⎪ ⎪ m ∩ (A) � ⎪ m1 X1 m2 X2 , ⎪ ⎪ ⎪ ⎪ X 1 2 ∈D ,X Θ ⎨ X1 ∩ X2 �A ⎪ (19) ⎪ ⎪ ⎪ ⎪ ⎪ ⎪ M M−1 ⎪ ⎪ s�1 mσ i (s) Yσ i (s) ⎪ ⎪ mPCR6 (A) � m ∩ (A)2 + mi (A) ⎝ ⎛ ⎠. ⎞ ⎪ ⎪ mi (A) + M−1 ⎪ ⎪ i�1 Yσ i (k) ∩ A�∅ s�1 mσ i (j) Yσ i (j) ⎪ ⎩ ∩ M−1 k�1 Y ,...,Y σ i (1) σ i (M−1) ∈(DΘ )M−1 In (19), M represents the number of evidence sources; membership vector of the functional component or the m ∩ (A) represents the combined reliability of the DSmT entire device with respect to each state level is h � [h1, . . ., combination rule for A; Ys ∈ DΘ corresponds to the sth h4], where hj represents the membership degree at the jth evidence source; ms (Ys ) represents its corresponding state level. If it satisfies the condition given by equation (22), reliability distribution function; σ i represents that from 1 the health of the component or item of equipment is to M excludes i number, as shown in the following evaluated as being at the jth state level and, among them, λ equation: represents the confidence level. By referring to the common confidence level range [0.5, 0.7], λ is set to 0.55. σ i (s) � s, if s < i, (20) ⎨ j ⎧ ⎬ ⎫ σ i (s) � s + 1, if s ≥ i. j � min⎩ j| hi ≥ λ, 1 ≤ j ≤ 4⎭ . (22) i�1 Considering that the above PCR6 combination rule is invoked to perform equal weight information fusion on 4. Case Study of a Transformer Multilevel multiple pieces of evidence and does not reflect the dif- ferences between different evidence sources, it can be Health Model considered that some priori information is ignored. In this Based on the above sections, a multilevel transformer health case, direct fusion will lead to insufficient accuracy of assessment model is established. The specific assessment of evaluation; therefore, in the evaluation of the component the model is as follows (Figure 3). layer and the equipment layer, the basic reliability dis- tribution of each piece of evidence was adjusted by combining the weights of the evaluation factors reconciled 4.1. Case Study. Taking the 220 kV main transformer by the variable weight coefficients. The specific process is (SFPS9-150000/220) which has been in operation for 20 as shown in (21); furthermore, by bringing the adjusted years in a certain substation as an example for verification, basic reliability distribution of each piece evidence into we collected basic account information, online monitoring (19), the difference between sources of evidence is re- indices, and experimental data pertaining to the evaluated flected in the fusion process, and the normalised synthetic transformer. Some of the state information collection in reliability distribution is used as the final evaluated 2010 is summarised in Table 4. hierarchy. Through analysis of the indicators that are found to have been degraded, the membership vector of each indicator m′ (·) � ωs m(·). (21) corresponding to each level of the cloud model is calculated based on the Gaussian cloud model. Then, the objective In (21), ωs represents the weight of the sth evidence source weight of each indicator corresponding to each defect type is after being adjusted by the variable weight coefficient. calculated based on association rules, and weight variation is Following the aforementioned process, the membership performed. The first-level evaluation result is determined results of the main components and the transformer (as a through weighted fusion, and the state of each defect type is whole) for each status level can be obtained. To avoid the obtained based on the reliability criterion. The grade problem of evaluation failure caused by the small difference membership degree of each defect type is listed in Table 5. between the grade membership values, reliability criteria are Based on the evaluation results of the first layer, it can be introduced to the final judgment of the overall health of concluded that the iron core multipoint grounding defect of components and equipment. It was assumed that the the body is in a serious state, which requires immediate
Mathematical Problems in Engineering 9

 Indicator layer

 Basic information of the
 transformer to be Defect layer Component layer Equipment layer
 evaluated and indicator
 degradation treatment
 Defect state grade Membership degree of
 Membership degree of
 membership degree component state grade
 transformer state grade
 Transforming
 deterioration degree into
 grade membership
 Determination of Determination of
 degree based on gauss Analysis of the overall
 comprehensive weight comprehensive weight
 cloud model health of the transformer
 based on constant weight based on constant weight
 and variable weight and variable weight

 Determination of
 comprehensive weight Defect membership fusion Fault membership fusion Coping strategies
 based on association rules based on improved DSmT based on improved DSmT
 and AHP

 Indicator membership
 weighted fusion

 Figure 3: Multilevel health state evaluation model of a power transformer.

 Table 4: Measured values of state indicators of transformer body.
State indicators Measured value Initial value
H2 content 359 6.1
CH4 content 18.5 8.7
C2H6 content 92 2.3
C2H4 content 52 4.8
C2H2 content 0 0
Total hydrocarbon content 162.5 15.8
Absolute CO gas production rate 12 0
Absolute CO2 gas production rate 31 0
Core grounding current 3.8 0.01
Core insulation resistance 200 1 000
Winding absorption ratio 1.61 2
Polarization index 2.03 2.5
Imbalance rate of winding DC resistance 1.5 1
Initial difference of short-circuit impedance 1.2 1
Winding dielectric loss 0.36 0.17
Initial difference of winding capacitance 1.4 1
Apparent discharge 72 30
Water content in oil 12.1 3.5
Loss factor of oil medium 1.7 0.5
Furfural content 0.05 0
Insulation paper degree of polymerisation 900 1 000

power cutoff to repair related problems. At the same time, The grade membership of each transformer component
wetted insulation is in a state requiring attention which is treated with variable weights. The membership vector of
requires operation and maintenance personnel to strengthen the overall condition of the transformer is derived by im-
the monitoring thereof. proved DSmT fusion, as shown in Table 7.
 Based on the degree of membership of each defect type Based on the calculated results, the transformer body is
and the indicator membership degree of the cooler system, in a serious state, and in terms of defect level, the evaluation
OLTC, and nonelectric protective device, variable weight of the iron core multipoint grounding corresponds to the
processing is conducted on the basis of an equal weight, “Severe” level, which differs from the evaluated status of
and then improved DSmT fusion is used to obtain the other defect types. Therefore, the maintenance recom-
degree of membership of each component grade, as listed mendation given is “need to arrange a power outage for
in Table 6. overhaul as soon as possible”. Operation and maintenance
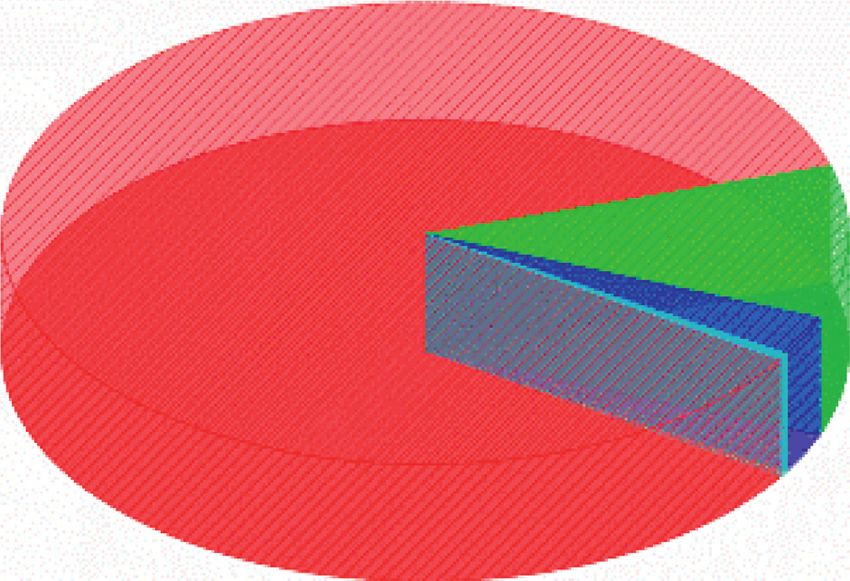
10 Mathematical Problems in Engineering

 Table 5: Grade membership of typical transformer defect.
Defect type Normal Attention Abnormal Serious Condition
Interturn short circuit of winding 0.5590 0.0000 0.1487 0.2923 Normal
Iron core multipoint grounding 0.1196 0.0011 0.0002 0.8791 Serious
Arc discharge 0.6328 0.0002 0.0817 0.2853 Normal
Current circuit overheating 0.6702 0.0012 0.1207 0.2079 Normal
Winding deformation 0.6045 0.2112 0.0910 0.0933 Normal
Partial discharge 0.7497 0.0017 0.0001 0.2485 Normal
Aging of oil paper insulation 0.5925 0.1402 0.2673 0.0000 Normal
Wetted insulation 0.2699 0.5039 0.0297 0.1965 Attention

 Table 6: Grade membership of transformer components in the example.
Part Normal Attention Abnormal Serious Condition
Body 0.3516 0.0465 0.0170 0.5849 Serious

 Table 7: The overall health of the transformer analysed.
Part Normal Attention Abnormal Serious Condition
Equipment 0.3516 0.0465 0.0170 0.5849 Serious

 3.74%

 15.89%

 50.7%

 4.21%

 25.47%

 110kV and below
 220kV 500 kV
 330kV 750 kV and above

 Figure 4: Statistical distribution of voltage levels.

personnel conducted a power outage inspection on the from 66 kV to 1000 kV, and the specific statistical distri-
equipment and found metal powder at the bottom of the bution thereof is shown in Figure 4; at the same time, the
transformer oil tank. Under the action of electromagnetic defects mainly appear on the body and bushing. The specific
attraction, a bridge was formed to connect the lower iron statistical distribution of these abnormalities is shown in
yoke to the feet or the bottom of the box, making the iron Figure 5.
core unstable, and multipoint grounding then causes the By using the proposed method to evaluate the afore-
iron core to overheat. The proposed method can be used to mentioned cases, the results of verification analysis on
assess the health of power transformers and their functional component defects are as listed in Table 8 and the results of
components and provides detailed analytical results per- verification analysis on the health status of components and
taining to the degradation of key components and possible equipment are given in Table 9. Accordingly, at the defect
defects. level, the overall accuracy of the proposed method as applied
 to component defect types reached 96.21%; at the compo-
 nent level, the accuracy of the resulting health status of the
4.2. Multiple Equipment Verification Analysis. In the “Case body, bushing, tap changer, and cooling system exceeds 90%;
study” section, the usability and accuracy of the proposed at the same time, at the equipment level, the accuracy of the
method were verified based on a single device case. Here, 428 overall health status of the transformer reaches 95.09%.
sets of measured data from multiple devices were used to However, at the defect level, the overall accuracy of the
conduct further group verification analysis. In the verifi- traditional deterministic method as applied to component
cation dataset, the voltage of the power transformer ranges defect types only reached 87.32%; at the component level,
Mathematical Problems in Engineering 11

 86.08%
 10.67%

 2.78%
 0.46%

 Body OLTC
 Bushing Cooler system
 Figure 5: Statistical distribution of abnormal components.

 Table 8: Verification of component defects. indicator layer was established. By combining the various
 Evaluation
 state indicators of the transformer from bottom to top, a
Defect type step-by-step evaluation was undertaken to obtain a hier-
 accuracy
Interturn short circuit of winding 100
 archical evaluation, thus overcoming a previous problem
Iron core multipoint grounding 95.31 whereby the evaluation obtained using the traditional
Arc discharge 97.87 method is insufficiently targeted.
Current circuit overheating 96.67 A state indicator deterioration evaluation method based
Winding deformation 98.48 on the Gaussian cloud model was proposed, and the am-
Partial discharge 89.19 biguity measurement result pertaining to the degree of state
Aging of oil paper insulation 88.89 indicator deterioration was obtained by applying flexible
Wetted insulation 100 treatment to the grade criterion boundary.
Thermal performance of the bushing Research into the combination of constant weights of state
 92.31
decreases indicators based on AHP and association rules to avoid the
Insulation performance of the bushing
 90.91 limitations of subjective and objective weighting methods was
decreases
Overall 96.21 undertaken; the introduction of variable weighting coefficients
 to reflect the influence of evaluation factor degradation on
 weight distribution was considered: this better reflected the true
Table 9: Verification of the health condition of the transformer and operating status of components and equipment.
its components. Based on the improved DSmT theory, fusion analysis of
 relevant assessment factors was performed by redistributing
Components Evaluation accuracy (%)
 the conflict information generated during the fusion process
Body 95.42
 according to the PCR6 rules, so as to address the problem
Bushing 91.30
OLTC 100
 whereby traditional evidence theory cannot effectively in-
Cooler system failure 100 tegrate highly conflicting evidence. The final evaluation of
Overall 95.09 comprehensive multisource information was thus obtained.
 In summary, the proposed power transformer health
 assessment method can reveal the operating status of
the accuracy of the resulting health status of the body, equipment from multiple perspectives and provide refined
bushing, tap changer, and cooling system exceeds 75%; at the assessment conclusions, thereby helping O&M personnel
same time, at the equipment level, the accuracy of the overall make more targeted maintenance-related decisions.
health status of the transformer only reaches 85.87%. This
shows that the multilevel health assessment method for Data Availability
power transformers based on the comprehensive treatment
of information uncertainty can identify specific abnormal The initial data of the dissertation mainly come from the project
conditions more precisely as they occur in such equipment research. Some data have confidentiality agreements. Except for
and provide targeted guidance for O&M personnel to for- the data mentioned in the dissertation that can be disclosed,
mulate maintenance decisions. other data cannot be disclosed due to confidentiality issues.

5. Conclusion Conflicts of Interest
A multilevel health assessment system consisting of an The authors declare that there are no conflicts of interest
equipment layer, a component layer, a defect layer, and an regarding the publication of this paper.
12 Mathematical Problems in Engineering

Acknowledgments [14] D. Li, D. Cheung, X. Shi, and V. Ng, “Uncertainty reasoning
 based on cloud models in controllers,” Computers & Math-
This study was supported by State Grid Hebei Electric Power ematics with Applications, vol. 35, no. 3, pp. 99–123, 1998.
Co., Ltd. (kj2020-040). [15] Y. C. Huang, H. T. Yang, and C. L. Huang, “Developing a new
 transformer fault diagnosis system through evolutionary
 fuzzy logic,” IEEE Transactions on Power Delivery, vol. 12,
Supplementary Materials no. 2, pp. 761–767, 1997.
 [16] Z. Yang, W. H. Tang, A. Shintemirov, and Q. H. Wu, “As-
Supplementary Table: weight of each state indicators. sociation rule mining-based dissolved gas analysis for fault
(Supplementary Materials) diagnosis of power transformers,” IEEE Transactions on
 Systems, Man, and Cybernetics, Part C (Applications and
 Reviews), vol. 39, no. 6, pp. 597–610, 2009.
References [17] P. Hájek and J. Rauch, “Logics and statistics for association
 rules and beyond,” Principles of Data Mining and Knowledge
 [1] L. Lee, L. J. Xie, Z. Deng et al., “Condition assessment of power
 Discovery, vol. 1704, pp. 586-587, 1999.
 transformers using a synthetic analysis method based on
 [18] W. Q. Liu, “Balanced function and its application for variable
 association rule and variable weight coefficients,” IEEE
 weight synthesizing,” Systems Engineering-Theory & Practice,
 Transactions on Dielectrics and Electrical Insulation, vol. 20,
 vol. 17, no. 4, pp. 58–64, 1997, in Chinese.
 no. 6, pp. 2052–2060, 2013.
 [19] Y. Ye and J. Wang, Study on Decision Fusion Identity Model of
 [2] M. Wang, A. J. Vandermaar, and K. D. Srivastava, “Review of
 Natural Gas Pipeline Leak by DSmT Technology and Intelligent
 condition assessment of power transformers in service,” IEEE
 Transportation Systems, Springer International Publishing,
 Electrical Insulation Magazine, vol. 18, no. 6, pp. 12–25, 2002.
 Berlin, Germany, 2017.
 [3] L. J. Xie, L. Li, Y. Cheng et al., “A fault diagnosis method of
 [20] W. H. Tang, K. Spurgeon, Q. H. Wu, and Z. J. Richardson, “An
 power transformers by integrated set pair analysis and as-
 evidential reasoning approach to transformer condition as-
 sociation rules,” CSEE Journal of Power and Energy Systems,
 sessments,” IEEE Transactions on Power Delivery, vol. 19,
 vol. 35, no. 2, pp. 277–286, 2015.
 no. 4, pp. 1696–1703, 2004.
 [4] P. Zhang, B. Qi, W. P. Li et al., “Evaluation method of power
 [21] G. Shafer, A Mathematical Theory of Evidence, pp. 19–63,
 transformer differentiation considering location and perfor-
 Princeton University Press, Princeton, NJ, USA, 1976.
 mance,” Chinese Journal of Electrical Engineering, vol. 11,
 2019.
 [5] L. Lee, Y. Cheng, L. J. Xie et al., “An integrated method of set
 pair analysis and association rule for fault diagnosis of power
 transformers,” IEEE Transactions on Dielectrics and Electrical
 Insulation, vol. 22, no. 4, pp. 2368–2378, 2015.
 [6] R. J. Liao, B. Liu, Y. Y. Zhang et al., “Assessing strategy of
 power transformers insulation state based on part-division
 and entropy method,” High Voltage Engineering, vol. 39, no. 8,
 pp. 1830–1836, 2013.
 [7] R. Liao, Y. Zhang, L. Yang, H. Zheng, and X. She, “A cloud
 and evidential reasoning integrated model for insulation
 condition assessment of high voltage transformers,” Inter-
 national Transactions on Electrical Energy Systems, vol. 24,
 no. 7, pp. 913–926, 2014.
 [8] J. D. Onera and F. Smarandache, “An introduction to DSmT
 for information fusion,” New Mathematics and Natural
 Computation, vol. 08, no. 03, pp. 343–359, 2012.
 [9] F. Smarandache and J. Dezert, “Advances and applications of
 DSmT,” Diseases of the Esophagus, vol. 28, no. 8, pp. 386–394,
 2006.
[10] State Grid Corporation of China, Guide for Condition Eval-
 uation of oil-Immersed Power Transformers (Reactors), State
 Grid Corporation of China, Beijing, China, 2008.
[11] IEEE Power Engineering Society, IEEE Guide for the Evalu-
 ation and Reconditioning of Liquid Immersed Power Trans-
 formers, IEEE Power Engineering Society, Piscataway, NJ,
 USA, 2007.
[12] T. K. Saha, “Review of modern diagnostic techniques for
 assessing insulation condition in aged transformers,” IEEE
 Transactions on Dielectrics and Electrical Insulation, vol. 10,
 no. 5, pp. 903–917, 2003.
[13] P. Xie, Q. Li, and Y. Wang, “A model for condition assessment
 of power transformers based on fuzzy theory,” in Interna-
 tional Conference on Computational and Information Sciences,
 pp. 1757-1758, Shiyang, China, June 2013.
You can also read