Case Study: Private Label Pet Food - CONFIDENTIAL - DRAFT - Y ale Login
←
→
Page content transcription
If your browser does not render page correctly, please read the page content below

Case Study:
                       Private Label Pet Food
                                                July 2018
CONFIDENTIAL - DRAFT
CONFIDENTIAL - DRAFT

     Table Of Contents

I.     Summary of Investment Opportunity

II.    Industry Overview

III.   Company Overview

IV.    Historical and Projected Financial Performance

                                           2
Summary of Investment Opportunity

CONFIDENTIAL - DRAFT                   3
CONFIDENTIAL - DRAFT

TargetCo Business Description
-      Largest private label wet pet food producer and one of the ten largest pet food producers in North America. TargetCo is
       also a contract supplier for branded pet food companies on an outsourced basis.
-      Private label segment (77% of revenue):
          • TargetCo supports the store-brand program for many of the largest food retailers in North America.
          • Involves the formulation and supply of high quality pet food comparable in quality to competing brands, except at
              a lower price and higher margin for retail customers.
-      Steady, non-cyclical market: Pet ownership rates are very stable year-to-year (including recessions) as “pet parents” are
       reluctant to reduce spending on pets.
-      TargetCo is growing with new customers and new products in both the private label and contract manufacturing
       segments. Introduced dry pet food capacity in 2010 and pet treat capacity in 2013.
                                                 EBITDA ($ in millions)
                                 Historical                                         Projected                       EBITDA
    EBITDA                                                                                                          Margin

                                                                4
CONFIDENTIAL - DRAFT

Customers and Products
- Sales strategy: To manufacturer high quality private label products based on nutrition, palatability and safety standards that
  are typically equal to or better than leading national brands.
- Customers: TargetCo has long-standing, sticky relationships with customers. Private label programs require high levels of
  coordination with retailers in areas of supply chain logistics, product development and customer service.
        - Private label to retail customers (77% of revenue)
        - Contract to branded manufacturers (23% of revenue)
- Product segments:
        - Wet pet food (74%). #1 market share leader. Along with the #2 player, dominates the outsourced market.
        - Dry and treats (26%): New growth segment for TargetCo. Entered in 2010.

                                                  Contract to
              Pet Super                             Brand
                23%                                  23%

            Grocery
             22%                                 Mass /
                                                 Dollar
                                                  32%

                                                                5
CONFIDENTIAL - DRAFT

    Industry Overview
§    Large market: Pet food is one of the largest CPG categories in the U.S. with $29 billion in retail sales. Approximately 52%
     of households have a dog and/or cat. The vast majority of all pets in the U.S. are fed packaged pet foods.

§    Steady demand growth: The pet food market exhibits steady demand each year with very stable pet ownership trends and
     increasing spending per pet, reflecting “humanization” and “premiumization” trends.

§    Non-cyclical: According to Packaged Facts, 83% of U.S. pet owners view their pets as members of the family. As a result,
     many pet owners are being transformed into "pet parents" who spare no expense for their loved ones.

§    Rising spend per pet (premiumization):. Pet parents increasingly evaluate pet foods as they scrutinize their own food
     choices. Customers are increasingly paying a premium for pet food they believe will enhance the well-being of their pets.

§    Wet vs dry segments: Wet once dominated the category before CPG companies pushed dry food (cheaper but less
     nutritious). Wet food has gained in recent years due to innovation with premium products and wholesome / natural brands.

§    Sales channels: In the 1990s and early 2000s, mass retailers and pet superstores took share from the grocery channel.
     Share between brick-and-mortar formats has since stabilized and e-commerce is growing rapidly (now 5% share).

§    Brands vs private label: Management estimates that private label has a 10-20% share of market and is growing with the
     same dynamics as branded companies. Retailers are committed to this large and profitable private label category.

§    Competition: TargetCo is #1 in outsourced wet pet food (45% share). The other large player is a CPG that outsources
     excess capacity. TargetCo is a new entrant in the outsourced dry market, which is dominated by a division of Mars.
                                                                  6
CONFIDENTIAL - DRAFT

Investment Merits
-   Growing, non-cyclical market
      - The pet food market exhibits steady demand each year with very stable pet ownership trends and increasing
         spending per pet, reflecting humanization and premiumization trends.
      - The pet food industry has grown at 4.4% CAGR since 2003, with no contraction in the “great recession.” Industry
         growth is expected due to continued premiumization (dollar spend per pet).

-   Diverse customer base
      - TargetCo has a strong mix in each major channel, including grocery, mass, pet superstores and internet.
      - Diverse customer base with #1 customer representing 25% of sales.
      - Core supplier to Wal-Mart, including the 2010 launch of a facility to produce private label dry pet food.
      - Contract customers include Blue Buffalo and WellPet – growing premium brands with no in-house wet production.

-   High barriers to switching
      - Private label programs require high levels of coordination with retailers in supply chain logistics, product
          development and customer service.
      - High risk in switching to a smaller supplier: quality assurance in a consumer product, logistics and on-time delivery
          and ability to formulate and produce a similar product.
      - Lack of available capacity in wet pet food. The only other large supplier is a CPG selling excess capacity – this is
          not a core business and they are unlikely to expand capacity. A greenfield facility in wet pet food is estimated to
          cost between $70 and $100 million dollars.

-   Consistent margin profile
      - TargetCo has consistently generated >8% EBITDA margins.
      - The leaders in branded pet food manufacturing have historical passed on raw material increases in the form of price
          increases.

                                                              7
CONFIDENTIAL - DRAFT

Growth Drivers
-   Premium wet pet food products
      - Despite flat pet population trends, the industry continues to grow with a mix shift to higher priced premium pet food.
      - TargetCo has a proven “quick-to-follow’’ strategy on new industry innovations. Once a leading brand establishes a
          popular product format or formulation, TargetCo quickly offers an analogous product to customers.

-   New dry, treat segments
      - TargetCo expanded into dry pet in 2010 with a greenfield facility in Arkansas and Wal-Mart as the anchor launch
         customer. The company added dry pet capacity in 2015 and continues to expand with new and existing customers.
      -   In 2013, TargetCo entered the treat market and continues to expand with new and existing customers.

-   Selectively add contract customers
      - TargetCo will continue to partner with high growth, premium pet food brands under contract manufacturing
           arrangements. Existing core contract customers include Blue Buffalo and WellPet.
      - Management’s strategy is to partner with growing brands with limited in-house manufacturing.

-   New segments: organic and M&A
      - TargetCo can leverage its market position and distribution capabilities by adding new product lines. Management
         believes retailers will continue to de-emphasize secondary brands and re-deploy shelf space between national
         brands and private label offerings.
      - Management will selectively pursue strategic acquisitions if they provide additional enhancements in product
         offering, technical capabilities, geographic coverage and/or add new customers.

-   Margin increases
      - With continued growth, TargetCo plans to leverage investments with economies of scale, reduce fixed manufacturing
          costs and increase productivity.
      - Management expects margin expansion in the new dry and treat segments with continued volume growth.

                                                              8
CONFIDENTIAL - DRAFT

Valuation Required to Win
§   Uses of cash / purchase price:
      • Presume that the market purchase price for TargetCo is ~9x current EBITDA.
      • Fees equal to $25 million are required to finance the transaction (the majority are debt financing fees).

§   Sources of cash to finance the transaction:
      • Assume debt can be raised equal to 5.25x EBITDA at an average interest rate of 7%.
      • Given the size threshold and credit quality, assume that the debt has a six year maturity BUT does not have
          financial covenants (minimum EBITDA, Debt/EBITDA covenants).

         Uses / Purchase Price                                         Sources of Cash
          EBITDA                                     $57                EBITDA                                 $57
          Purchase Multiple                          8.8x               Debt Multiple                          5.3x
         Purchase Price                             $500               Debt - secured loans                   $298
          add: Closing expenses                        25              Equity from PE firm                    $227
         Uses of Cash                               $525               Sources of Cash                        $525

         *note: all dollars are in millions

                                                              9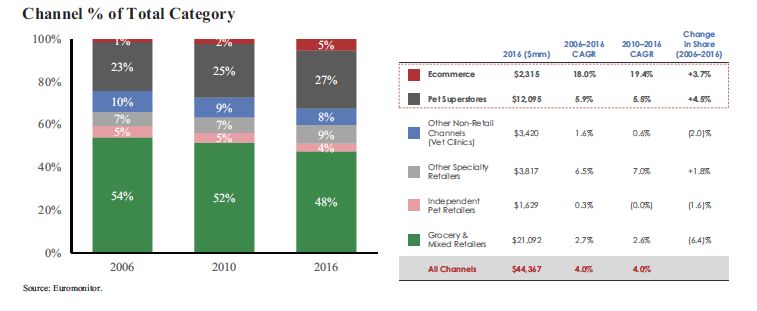
Industry Overview

CONFIDENTIAL - DRAFT          10
CONFIDENTIAL - DRAFT

    Steady Market Growth
§    The pet food industry is large with $24 billion in retail expenditures
§    The market has a steady growth CAGR of 9.3% since 2003
§    A non-cyclical industry that remains steady in cycles due to the “humanization” of pets

                                               U.S. Pet Food Industry Expenditures
       $ in billions
                                                          ($ in billions)
        $35
                               25 Year Revenue                                                                    $30
        $30                                                                                                 $28
                                CAGR: 9.3%
        $25                                                                                     $23   $23
                                                                                    $21   $22
                                                                    $19       $20
        $20                                                  $18
                                                 $16   $17
                                   $15   $16
                       $14   $15
        $15

        $10

          $5

          $0
                       2003 2004 2005 2006 2007 2008 2009 2010 2011 2012 2013 2014 2015 2016 2017

    Source: Euromonitor                                             11
CONFIDENTIAL - DRAFT
Non-cyclical Demand
Humanization: Survey of pet owners
Recession Growth (per Euromonitor)
84% of pet owners call themselves “mommy” or “daddy” 6% 6% 6%
83% of pet owners view their pets as family members
3%
81% of dogs are given treats
80% as concerned about quality of pet food as their own 2007 2008 2009 2010
77% of dog owners purchased a gift for their pet in past year
Recession Growth (per Packaged Facts)
6%
41% of dogs sleep in bed with owner 6%
5%
3%
Source: FreshPet, Inc
2007 2008 2009 2010
12CONFIDENTIAL - DRAFT
Pet Food Market Projection
§ According to Euromonitor, the pet food industry should experience significant growth in the next five years.
U.S. Pet Food Growth Projections
(source: Euromonitor)
5.9%
4.3% 4.2%
3.7%
2.0%
2018 2019 2020 2021 2022
13CONFIDENTIAL - DRAFT
Non-cyclical Demand
§ Consistent pet-ownership
o Over 50% of U.S. households have a pet.
o More households today have pets than children due to demographic shifts and changing attitudes towards pets
§ Pet humanization
o 83% of U.S. pet owners view their pets as members of the family.
o As pets are increasingly viewed as companions, friends, and family members, pet owners are being transformed into
"pet parents" who spare no expense for their loved ones.
14CONFIDENTIAL - DRAFT
Market Sales and Volume Trends
§ While the pet population is largely flat, the market size in dollars is increasing due to a mix shift to premium products.
§ Average market growth in last 5 years: 2.4%
o Volume: -.6%, Price: 3%
Market Growth: 2012 to 2017
(source: Euromonitor)
5.0%
Retail $ Volume #
4.0%
3.0%
2.0%
3.5% 3.5%
1.0% 2.3%
1.7%
0.0% 1.0%
0.0%
-0.5% -1.0% -1.0% -0.4%
-1.0%
-2.0% 2013 2014 2015 2016 2017
15CONFIDENTIAL - DRAFT
Momentum in Premium Products
§ Premiumization: Industry growth has been fueled by a mix shift to higher priced premium pet food.
§ Humanization trends have led “pet parents” to increasingly evaluate pet foods as they scrutinize their own food. Many “pet
parents” pay a premium for pet food they believe will enhance the well-being of their pets.
Product examples:
Life-stage: for changing nutritional requirements in different life- stages.
Industry Price Tier Mix
Breed size: for specific nutritional needs of different breeds including (source: Euromonitor)
kibbles of different shapes and sizes.
Small and toy breed: smaller bags and cans that carry a higher price per 12% 10%
pound (and offsets lower volume of small dogs).
Functional: help with urinary tract health, hairball management and 26%
31%
weight management.
Oral health: dental bones promoting oral health (a sizable and fast-
growing category).
Grain- and gluten- free: fast growing part of the market reflecting pet
64%
parent trends. 57%
Ancestral diet type: subset of grain-free for pet parents looking to mimic
the diets of wolves and lynxes (pet ancestors).
Limited ingredient: for food sensitivities; typically made with one type of
protein and often dairy-free and grain- free. 2012 2017
Human food inspired: wet foods or treats, such as stews, soufflés, Premium Mid-Priced Economy
meatballs and biscuits.
16CONFIDENTIAL - DRAFT
Segmentation: Wet vs. Dry
§ Dog food and cat food represent 70% and 30% of the market, Industry Segments
respectively. (source: Euromonitor)
Treats
§ The pet food market is segmented into dry food, wet food and treats
17%
o Dry: Dry kibble made of grain or grain/protein. ~75% dog food.
o Wet: Meat based. ~50/50 dog and cat food.
o Treat: Meal supplements. Mostly dog, but cat is growing. Wet
24% 59%
Dry
Advantages and Disadvantages
Wet Dry
+ High in protein, no artificial flavor / additives + Much less expensive
+ Hydrating + Easy storage, no spoil
+ Strong smell for ill dogs + No smell
-- More expensive ~ 3 to 4x -- Less protein
-- Faster spoil -- Less hydrating
-- Messy / smell -- Less appetizing
17CONFIDENTIAL - DRAFT
Wet vs. Dry Growth Rates
§ Wet foods were once the dominant pet food category, before large CPG companies pushed dry foods with significant
advantages in price and convenience.
§ Wet food popularity has gained in recent years due to product innovation with premium products and increased focus from
wholesome / natural brands.
§ The introduction of premium dry pet foods (at a higher cost) has narrowed the price gap with wet pet food products.
10 yr CAGR by Segment
(source: Euromonitor)
7%
Retail $ Volume #
6%
5%
4%
7%
3%
5%
2% 4%
1% 2%
0%
-1% 0%
-1% Wet Dry Treats
18CONFIDENTIAL - DRAFT
Distribution Channels
§ 1980s and prior: Grocery was once the dominant share retailer of pet products.
§ 1990s and early 2000s: Mass players (Wal-Mart) and pet superstores (PetCo and PetSmart) took substantial share from the
grocery channel. Pet superstore penetration driven by breadth of product offering and premium products.
§ Current: More stable share among brick and mortar players. E-commerce growing with 5% of category share, offering
customers the same specialty brands with the convenience of home delivery and recurring order programs.
Industry channel splits:
Grocery and mass (48% of retail): Comprised of mass merchandisers such as Wal-Mart and Target, national grocery
chains such as Kroger, Ahold and Albertsons, and regional grocery chains such as Publix, Wegmens and HE Butt.
Pet Superstores (27% of retail): Includes national pet superstore chains such as PetSmart and Petco; both are similar in
size and dominant in this category. Regional players include Pet Supplies Plus, Pet Supermarket and Petsense.
E-commerce (5% of retail): Dominated by Chewys.com (~40% share) and Amazon (~40% share). Chewys.com was
recently acquired and merged with PetSmart to execute a hybrid retail/internet strategy.
Independent pet stores (4% of retail): Neighborhood pet stores.
Other: 25,000 veterinary clinics, farm and feed stores, military outlets and hardware stores.
19CONFIDENTIAL - DRAFT
Distribution Channels Shift
§ Internet commerce led by Chewy’s and Amazon continues to take share from retailers
o PetSmart has struggled with integrating Chewy’s and has seen slower sales in stores
o Low cost Mass stores continue to perform in pet category by adding premium products
§ Within the Grocery and Mass channel, grocery is mature and not gaining share
20CONFIDENTIAL - DRAFT
Brand and Private Label Share
§ Branded pet food: 92% of retail pet food sales
o Dominated by three CPG companies (Nestle, Mars, J.M. Smucker) and independent premium brands.
o The “big three” have executed a strategy of significant consolidation through acquisition.
o Mostly in-house manufacturing: control of risk/quality and distribution.
§ Private label: 8% of retail pet food sales.
Private label
Brands
8%
Purina, Friskies, Beneful, Alpo, Fancy Feast, Pro
Nestle
Nestle Purina Plan, Merrick, Waggin Train, Zuke’s
33%
Independents
27% Iams, Pedigree, Nutro, Cesar, Greenies, Eukanuba,
Mars
Royal Canin, California Natural, Evo
J.M. Big Heart, Meow Mix, Natural Balance, Milk-Bone,
Smucker Kibbles n’ Bits, Gravy Train, Nature’ Recipe
Indepen- Blue Buffalo, WellPet, Freshpet, Science Diet
J.M. Smucker Mars dents (Hill’s), Diamond, Rachel Ray (Ainsworth)
12% 20%
21CONFIDENTIAL - DRAFT
Competition
§ The available market for TargetCo for outsourced manufacturing is ~ $4 billion.
o Branded pet food: 5% to 15% outsourced production.
o Private label: ~100% outsourced production.
§ Stable competition with few new entrants.
o Management estimates that the capital cost required to become a meaningful wet pet competitor with the required
product range and quality is between $70 and $100 million for a single greenfield facility.
Outsourced Pet Food Market
Wet Competition Dry Competition
Local/regional Local/regional
20% 20%
TargetCo
45% TargetCo
10%
Mars
J.M. 70%
Smuckers
35%
22CONFIDENTIAL - DRAFT
Competition
§ Mars – Major Dry Pet Food Competitor
o Dominant leader in private label dry pet food (~70% share). Built partially through acquisition and consolidation.
o Doane Pet Care was acquired by Mars in 2006 from Teachers Private Capital (PE arm of Ontario Teachers). At time
of acquisition, Doane had over $1.5 billion in revenue and 20 facilities in the U.S.
o TargetCo acquired Doane’s wet pet food operations in 2001.
o Doane is a core dry pet food supplier to Wal-Mart (was 40%+ of revenue in 2006).
§ J.M. Smuckers – Major Wet Pet Food Competitor
o Participates in private label and contract supply market with excess capacity not used for internal brands.
o Smuckers entered the pet food market in 2015 with the acquisition of Big Heart (formerly Del Monte). These pet food
brands and operations were previously sold by Heinz (2002) and Quaker (1995).
o Smuckers is not committed to the private label wet pet food market. They have a limited offering with select
customers (Wal-Mart) and lack the manufacturing capability and capacity to produce a comparable assortment of
containers and recipes as TargetCo.
o Wal-Mart has traditionally been a major purchaser of Smuckers wet pet food capacity.
§ Local or regional manufacturers:
o Includes American Nutrition, Chanango Valley, CJ Foods, Evangers, Merrick and Sunshine.
o Local and regional manufacturers are significantly smaller than TargetCo and do not produce a full range of pet food
products or container sizes. Players tend to focus on the non-premium segments of the market.
o They would require significant capital investments and R&D to compete with TargetCo for national retail customers.
Product capacity, logistics, brand support and quality assurance represent high barriers for customers to switch.
23Company Overview CONFIDENTIAL - DRAFT 24
CONFIDENTIAL - DRAFT

    History
§    1971: Founded in Ontario with the purchase by an entrepreneur of a pet food facility from Quaker Oats.
§    1994 - 2004: Significant capital expenditures to expand capacity and fuel sales growth.
§    1997: Greenfield operation in Kansas to manufacture and sell to West Coast.
§    2001: Acquired wet pet food operations from Doane Pet Care (the dominant private label producer of dry pet food).
§    2003: Expanded contract manufacturing with the acquisition of a P&G facility and signing of multi-year contract.
§    2007-8: TargetCo and other suppliers severely impacted by a Product Recall, due to an intentionally tainted ingredient
     sourced by a Chinese supplier. Caused significant loss of revenue that started to recover in 2008 (see next page).
§    2010: Expansion into private label dry food market with Wal-Mart as the anchor launch customer. Expanded further in 2015.
§    2013: Expansion into private label treat market.

                                                                                                                                                                                $598
     $600                                                                                                                                                                $557
                        25 Year Revenue                                                                                                                           $524
                                                                                                                                                           $478
     $500                 CAGR: 10%                                                                  $441                                           $445
                                                                                              $420                                           $408
     $400                                                                              $373                                           $359
                                                                                                                   $338
                                                                           $314 $324                        $319          $322 $334
     $300
                                                                    $220
                                                             $203
     $200                                             $178
                                               $157
                                        $114
                         $83   $96 $103
     $100   $55   $61

       $0
            1992 1993 1994 1995 1996 1997 1998 1999 2000 2001 2002 2003 2004 2005 2006 2007 2008 2009 2010 2011 2012 2013 2014 2015 2016 2017

                                                                                   25
CONFIDENTIAL - DRAFT
2007 Product Recall
Product Recall – 2007
§ In March 2007, TargetCo issued a large recall of certain products produced in a 3 to 4 month period starting in late 2006.
The cause of the recall was due to a new Chinese supplier with an adulterated ingredient. 11 other companies in the pet
food industry, who had also purchased from this supply source, followed suit and instituted recalls.
§ TargetCo worked closely with regulatory authorities and determined the contaminated ingredient was intentionally
adulterated with melamine and related compounds by the Chinese manufacturer. The pet food industry, our customers and
consumers were all victims of a fraud of monumental proportions.
§ Recalls had a devastating effect on TargetCo in 2007. Direct costs were approximately $55 million. By Q3-2007, customers
with 37% of sales in 2006 indicated that they would no longer purchase from TargetCo. This included many branded
contract customers with internal supply, including P&G (Iams).
§ In 2007, customers and pet owners initiated lawsuits. In 2008, TargetCo led an industry-wide global settlement of claims.
§ Starting in 2008, TargetCo enjoyed steady growth in sales volumes with existing and new customers. As one of two
dominant market share leaders in private label pet food for retailers, alternative source switching was contained and
customers worked with TargetCo during this difficult time.
Commodity Spike – 2008
§ During 2008, an unprecedented rise in commodity costs were absorbed by the industry before price increases could be
passed to customers. TargetCo initiated three price increases starting in 2008 to recover this cost. Contract customer
margins were not impacted given the formula-based contract mechanism.
26CONFIDENTIAL - DRAFT
Products and Services
Our store brand program involves the formulation and supply of a wide variety of high quality pet food products
comparable in quality to competing brands, except at a lower price and resulting in higher margin for customers.
§ Full category management: suite of management services to expand each customer's sales and profitability. For store
brands, includes product development and testing services, packaging design services, and pricing and marketing strategy
services. TargetCo owns brands for retail customers too small to support their own exclusive retail brand.
§ Formulation (owned formulas): ability to formulate a wide variety of high quality pet food products that are comparable in
quality to branded products.
§ Fast new product introduction: ‘‘quick-to-follow’’ strategy: once a leading brand establishes a popular product format or
formulation, TargetCo can quickly offer an analogous product to its customers.
o Wet: Consists of 40% cat food and 60% dog food. Available in cuts
Treats in gravy, slices in gravy, ground, pâté, or loaf. Sold in cases of 3 to
Dry - Private 3%
24 aluminum and steel cans (with sizes ranging from three to 22
Label
23% ounces), pouches, tubs and cups.
o Dry: Launched in 2010 with Wal-Mart as an anchor customer.
Wet - Private Predominately dog food because the dry cat food market is small.
Label
51% Wide selection including high protein, premium- blended, puppy
food, gravy style and super premium meat. Forms include kibbles,
meal and expanded particles.
Wet -
Contract o Treats: Launched in 2013. Includes meat, biscuit, cereal, fish or
23% yeast-based products. Marketed and fed not as a pet’s primary meal
but as a reward or indulgence.
27CONFIDENTIAL - DRAFT
Customer Channel Mix
§ Private Label:
o TargetCo has strong representation in each major retail channel, including the traditional grocery channel, mass
merchandisers and pet superstores.
o Within the mass channel, TargetCo is a core supplier to Wal-Mart, including the 2010 launch of a facility to produce
private label dry pet food for Wal-Mart.
o The growing internet segment is dominated by Chewys.com and Amazon.com. Both have similar market share and
are growing at the expense of other channels.
§ Contract:
o TargetCo supplies a select group of growing, independent brands in its contract manufacturing segment, including
Blue Buffalo and WellPet. None of these customers have in-house manufacturing for wet pet food products supplied
by TargetCo.
Contract to
Pet Super Brand
23% 23%
Grocery
22% Mass /
Dollar
32%
28CONFIDENTIAL - DRAFT
Top Customers
§ TargetCo’s top 3 customers are Blue Buffalo (contract), Wal-Mart (Mass) and PetSmart (pet superstore).
§ The top 10 customers represent 81% of total sales in fiscal 2017.
Top Customers 2017 % mix
WalMart $ 152.1 25%
PetSmart 97.2 16%
Blue Buffalo 94.5 16%
Publix 32.7 5%
Dollar Gen 26.1 4%
Wellpet 18.9 3%
Kroger 17.8 3%
Chewys 16.7 3%
PetSuper 14.8 2%
Rachael Ray 14.6 2%
Other 112.5 19%
Total $ 597.6 100%
29CONFIDENTIAL - DRAFT
Manufacturing
§ State-of-the-art manufacturing facilities:
o Wet pet food facilities: Kansas (430,000 sq. ft.) serving the Western U.S., New Jersey (210,000 sq. ft.) serving the
Eastern U.S. and Ontario (134,000 sq. ft.) serving Canada and Midwest U.S. These plants utilize high-speed
equipment and leading-edge technologies to produce pet food in aluminum and steel cans.
o Dry pet food facility: Arkansas (90,000 sq. ft.), a greenfield facility built in 2010.
§ Difficult to replicate: The capital cost to become a meaningful competitor with the product range and quality offered by
TargetCo is between $70 and $100 million for a single “greenfield” wet pet food facility
Production process:
1. Ingredient preparation: Batch preps starts the day before production. Meat in the recipe is moved from the deep freezers to
a refrigerated room to begin thawing process at food-safe temperatures.
2. Mixing the batch. Crews put the partially frozen meat into a machine for grinding and steaming. At completion, the meat
appears shredded and roasted. The meat and water is then transferred to a large kettle where the final “stew” is mixed. The
kettle is heated at 180 degrees as blades spin slowly turning the mixture into a “gravy.” After the gravy is well mixed, final
ingredients are added. The laboratory then conducts the “guaranteed analysis:” protein, fat, fiber, and moisture content.
3. Filling and sealing: With various pumps, the food is now moved through pipes out of the kettle, through a metal detector
and into the can-filling (or pouch filling) machine. The cans pass out of the filling machine and into a can seamer, where the
lids are positioned and sealed. A quality control technician also inspects a number of cans at this point. He checks the
temperature, to make sure the food is still above 100 degrees; it needs to maintain this temperature until placed into the retort
(cooking and sterilizing) machine. Also, the vacuum seal must be perfect to preserve the food and maintain its safety.
4. The "Cook" (Retort): A retort is a large chamber into which steam is pumped under high pressure. Computers monitor the
“cook” – the combination of time, temperature, and pressure needed to sterilize the food in the cans. All the machines in the
process are then sterilized; the steam cookers are scrubbed and sterilized with steam, as are the mixing kettle and can-filling
machines. Steam is also used to flush out all the pipes that transported the mixture from machine to machine.
30CONFIDENTIAL - DRAFT
Purchasing
§ TargetCo’s primary production inputs are meat, chicken, fish and associated by-
products, aluminum and steel cans, retortable pouches, packaging materials, cereals
and nutrients.
§ TargetCo’s practice is to develop long-term relationships with its major suppliers to
achieve optimum quality and cost. TargetCo attempts to have at least two qualified
suppliers for each production input.
§ In 2008, TargetCo experienced unprecedented spikes in key raw materials. Input
costs in recent years have stabilized to historical trends.
§ PPI indices as a proxy for raw material prices are as follows:
PPI - Meat Meal PPI - Aluminum Can
(Index: 100=1982) (Index: 100=1982)
230.0 150.0
210.0 140.0
190.0 130.0
120.0
170.0
110.0
150.0
100.0
130.0
90.0
110.0
80.0
90.0 70.0
70.0 60.0
50.0 50.0
1990 1992 1994 1996 1998 2000 2002 2004 2006 2008 2010 2012 2014 2016 1990 1992 1994 1996 1998 2000 2002 2004 2006 2008 2010 2012 2014 2016
31CONFIDENTIAL - DRAFT
R&D, Quality, Regulatory
R&D
§ Research and development activities include developing new recipes, testing recipes, developing new manufacturing
techniques and improving existing methods, materials and processes. TargetCo employs 50 staff for technical services,
research and development, and quality assurance. As a part of its ongoing research and development program, and to
ensure its products maintain a high level of palatability relative to the leading brands, TargetCo contracts independent
kennels and labs to conduct feeding trials of its products.
Quality
§ We maintain a comprehensive program for qualifying new vendors, testing raw materials for nutritional adequacy and
screening to detect the presence of mycotoxins and other harmful substances. We continuously test pet food production at
each of our manufacturing facilities by analyzing finished pet food product against specifications, formula and regulatory
requirements. Packaging is inspected for quality, proper dimensions, construction and compliance with labeling regulations.
Regulatory
§ Along with our brokers, distributors, and ingredients and packaging suppliers, we are subject to extensive laws and
regulations in the United States by federal, state and local government authorities. Federal agencies governing the
manufacture, distribution and advertising of our products include, among others, the FTC, the FDA, the USDA, the EPA and
OSHA. Under various statutes, these agencies, prescribe the requirements and establish the standards for quality and safety
and regulate marketing and advertising to consumers. Certain of these agencies, in certain circumstances, must not only
approve our products, but also review the manufacturing processes and facilities used to produce these products before they
can be marketed in the United States. Our operations, and those of our distributors and suppliers, are subject to various laws
and regulations relating to environmental protection and worker health and safety matters. We monitor changes in these
laws and believe that we are in material compliance with applicable laws.
32Historical Financials CONFIDENTIAL - DRAFT 33
CONFIDENTIAL - DRAFT

Historical Financial Performance

§   Organic revenue CAGR of 8% per year since 2013
      § Over 60% of growth in last 5 years from new dry private label and treat segments.
§   Gross margin increase of .1% since 2013
      § Stable margins in contract and wet –private label segments. Still ramping in new segments.
§   SG&A growth CAGR less than half of sales growth
      § Strong management with controls in place.
§   EBITDA has increased from $36m to $57m in just 5 years (all organic growth)

                                                    HISTORY                               5 year change
      $s in millions                2013       2014     2015         2016       2017    % CAGR          $s

      Revenue                     $444.8     $478.4     $523.7     $557.0      $597.6        8%          $153
                                     9%         8%         9%         6%          7%

      Gross Profit                  64.1       68.4       74.2       82.1       86.6         8%              22
      % margin                     14.4%      14.3%      14.2%      14.7%      14.5%

      SG&A                          27.9       28.4       29.1       29.5       29.8         2%               2
      % margin                      6.3%       5.9%       5.6%       5.3%       5.0%

      EBITDA                        $36.2      $40.1      $45.1      $52.6      $56.8       12%           $21
      % margin                      8.1%       8.4%       8.6%       9.4%       9.5%

                                                          34
CONFIDENTIAL - DRAFT
Historical Growth Bridge
§ Wet Private Label
§ Mature business with 3% growth CAGR, including 2% price growth in last 5 years.
§ Wet – Contract to Brands
§ 4% historical growth CAGR, including 2% price growth in last 5 years.
§ Dry - entered the market in 2010.
§ New, high growth business driven by ramping volume.
§ Treats - entered the market in 2014
§ New, high growth business driven by ramping volume.
HISTORY
$s in millions 2013 2014 2015 2016 2017 2014 2015 2016 2017 % CAGR
% sales growth
Wet Private Label $267.9 $275.9 $286.0 $294.5 $303.8 3.0% 3.6% 3.0% 3.2% 3%
Wet Contract 117.7 121.6 125.3 128.6 137.2 3.3% 3.0% 2.6% 6.7% 4%
Dry Private Label 59.2 76.7 105.4 123.5 140.7 29.7% 37.4% 17.1% 13.9% 24%
Treats Private Label - 4.1 7.0 10.5 15.9 na 70.0% 50.0% 51.5% n/a
Total Revenue $444.8 $478.4 $523.7 $557.0 $597.6 7.6% 9.5% 6.4% 7.3% 8%
GP %
Wet Private Label $49.6 $51.9 $54.5 $58.3 $60.1 18.8% 19.1% 19.8% 19.8% 5%
Wet Contract 11.8 12.5 13.2 14.4 15.4 10.3% 10.6% 11.2% 11.2% 7%
Dry Private Label 2.7 3.9 6.1 8.9 10.2 5.1% 5.8% 7.2% 7.2% 39%
Treats Private Label - 0.2 0.3 0.5 0.9 3.9% 4.9% 4.9% 5.8% n/a
Total Gross Profit $64.1 $68.4 $74.2 $82.1 $86.6 14.3% 14.2% 14.7% 14.5% 8%
35CONFIDENTIAL - DRAFT
Free Cash Flow
§ TargetCo has made significant capex in recent years
§ Expansion capex related to entry into dry and treat markets
§ Consistent maintenance capex at 1.5% of sales
§ Consistent working capital
§ TargetCo has tight controls on inventory and history of low bad debt accounts receivable
HISTORY
$s in millions 2013 2014 2015 2016 2017
Revenue $445 $478 $524 $557 $598
EBITDA $36 $40 $45 $53 $57
% margin 8% 8% 9% 9% 10%
Maintenance Capex (6.7) (7.2) (7.9) (8.4) (9.0)
Growth Capex - (9.6) (7.9) (2.8) (3.0)
Capex (6.7) (16.7) (15.7) (11.1) (12.0)
Chg Working cap (1.9) (1.9) (7.9) (2.5) 6.8
Free Cash Flow $28 $21 $21 $39 $52
* before interest and tax
36CONFIDENTIAL - DRAFT
Historical Balance Sheet
HISTORY
2013 2014 2015 2016 2017
Accounts Receivable 26.7 28.7 36.7 33.4 29.9
Inventory 49.5 51.2 53.9 61.7 61.3
Other Current Assets 2.0 2.5 3.0 3.0 3.2
Current Assets 78.2 82.5 93.6 98.2 94.4
Accounts Payable 16.0 17.2 18.9 19.9 21.5
Accrued Exp. 15.2 16.4 18.0 19.0 20.4
Income Taxes Payable 0.3 0.3 0.3 0.3 0.4
Current Liabilities 31.5 33.9 37.2 39.2 42.3
Net Working Capital 46.7 48.5 56.4 59.0 52.1
Chg Working Capital (1.9) (1.9) (7.9) (2.5) 6.8
Sales 445 478 523.7 557.0 597.6
NWC % of sales 10% 10% 11% 11% 9%
Gross PP&E 98.5 115.2 130.9 142.0 154.0
Accum. Depreciation (17.0) (27.0) (37.0) (47.0) (57.0)
Net, PP&E 81.5 88.2 93.9 95.0 97.0
Capex (7) (17) (16) (11) (12)
Capex % of sales 2% 4% 3% 2% 2%
37CONFIDENTIAL - DRAFT
Performance in Great Financial Crisis
§ TargetCo grew revenue through the GFC
§ Continued the recovery from the product recall issues in prior years
$600 $100
Sales EBITDA
$90
$500
$80
$70
$400
$60
$300 $50
$40
$200 $30
$20
$100
$10
$0 $0
2003 2004 2005 2006 2007 2008 2009 2010 2011 2012 2013 2014 2015 2016 2017
Sales $324 $373 $420 $441 $319 $338 $322 $334 $359 $408 $445 $478 $524 $557 $598
EBITDA $32 $39 $41 $48 $29 $25 $21 $25 $26 $33 $36 $40 $45 $53 $57
38Projected Financials CONFIDENTIAL - DRAFT 39
CONFIDENTIAL - DRAFT

Management Projections
§     Organic revenue CAGR of 8% over the next 5 years

§     Gross margin increase from 14% to 17%

§     SG&A growth CAGR of 5%

§     EBITDA to increase from $57m to $107m over next 5 years without acquisitions

                                                 PROJECTED (No Acquisitions)                 5 year change
    $s in millions               2017         2018       2019      2020       2021   2022   % CAGR      $s

    Revenue                      $598         $639       $691      $746       $806   $872       8%      $274
                                               7%         8%        8%         8%     8%

    Gross Profit                   $87         $93       $103      $115       $128   $145      12%           59
    % margin                      14%         15%        15%       15%        16%    17%

    SG&A                           $30         $31        $33       $34        $36    $38       5%            8
    % margin                       5%          5%         5%        5%         4%     4%

    EBITDA                         $57         $62        $70       $80        $92   $107      15%        $50
    % margin                      10%         10%        10%       11%        11%    12%

                                                            40
CONFIDENTIAL - DRAFT
Projected Growth Bridge
§ Wet Private Label
§ Assumes 5% organic growth CAGR
§ Wet Contract
§ Assumes 7% organic growth CAGR
§ Dry - entered the market in 2010.
§ New, high growth business that is still ramping
§ Treats - entered the market in 2014
§ New, high growth business that is still ramping
PROJECTED
$s in millions 2017 2018 2019 2020 2021 2022 2018 2019 2020 2021 2022 % CAGR
% sales growth
Wet Private $303.8 $314.5 $328.6 $345.0 $362.3 $380.4 3.5% 4.5% 5.0% 5.0% 5.0% 5%
Wet Contract 137.2 146.8 157.1 168.1 179.8 192.4 7.0% 7.0% 7.0% 7.0% 7.0% 7%
Dry Private 140.7 157.6 176.5 197.6 221.4 247.9 12.0% 12.0% 12.0% 12.0% 12.0% 12%
Treats Private 15.9 20.6 28.4 35.5 42.5 51.1 29.7% 37.4% 25.0% 20.0% 20.0% 26%
Revenue $597.6 $639.5 $690.5 $746.2 $806.0 $871.8 7.0% 8.0% 8.1% 8.0% 8.2% 8%
GP %
Wet Private $60.1 $62.9 $68.2 $75.0 $81.5 $89.4 20.8% 21.8% 22.5% 23.5% 8%
Wet Contract 15.4 16.9 18.5 20.2 22.0 25.0 11.8% 12.0% 12.3% 13.0% 10%
Dry Private 10.2 11.8 14.1 16.8 21.0 26.0 8.0% 8.5% 9.5% 10.5% 21%
Treats Private 0.9 1.5 2.1 2.8 3.6 4.8 7.2% 8.0% 8.5% 9.5% 39%
Gross Profit $86.6 $93.1 $102.8 $114.9 $128.2 $145.3 14.9% 15.4% 15.9% 16.7% 12%
41CONFIDENTIAL - DRAFT
Projected Cash Flow
§ Capex
§ Maintenance capex projected as a consistent % of sales as history
§ Growth capex assumes additional treat and dry capacity expansion in 2019 to 2020
§ Working capital
§ Assumes ratios based on history
PROJECTED (No Acquisitions)
$ in 000s 2017 2018 2019 2020 2021 2022
Revenue $598 $639 $691 $746 $806 $872
% growth 7% 8% 8% 8% 8%
EBITDA $57 $62 $70 $80 $92 $107
% margin 10% 10% 11% 11% 12%
Maintenance Capex (10) (10) (11) (12) (13)
Growth Capex - (6) (6) (3) -
Capex (10) (16) (17) (15) (13)
Change in working capital (7) (8) (9) (10) (11)
Free Cash Flow 46 45 54 67 84
* before interest and tax
42CONFIDENTIAL - DRAFT
Projected Balance Sheet
PROJECTED (No Acquisitions)
2017 2018 2019 2020 2021 2022
Accounts Receivable 29.9 32.0 34.5 37.3 40.3 43.6
Inventory 61.3 65.6 70.5 75.8 81.3 87.2
Other Current Assets 3.2 3.4 3.7 4.0 4.3 4.7
Current Assets 94.4 101.0 108.7 117.1 126.0 135.4
Accounts Payable 21.5 22.9 24.7 26.5 28.5 30.5
Accrued Exp. 20.4 21.9 23.5 25.3 27.1 29.1
Income Taxes Payable 0.4 0.3 0.3 0.3 0.4 0.4
Current Liabilities 42.3 45.1 48.5 52.0 56.0 60.0
Net Working Capital 52.1 55.9 60.3 65.0 70.0 75.5
Chg Working Capital 6.8 (3.7) (4.4) (4.8) (5.0) (5.5)
Sales 598 639 690.5 746.2 806.0 871.8
NWC % of sales 8.7% 8.7% 8.7% 8.7% 8.7% 8.7%
Gross PP&E 154.0 163.6 179.9 197.1 212.2 225.3
Accum. Depreciation (57.0) (27.0) (37.0) (47.0) (57.0) (57.0)
Net, PP&E 97.0 136.6 142.9 150.1 155.2 168.3
Capex (12) (10) (16) (17) (15) (13)
Capex % of sales 2% 2% 2% 2% 2% 2%
43You can also read