Development and Evaluation of the Psychometric Properties of a Brief Wisdom Development Scale - MDPI
←
→
Page content transcription
If your browser does not render page correctly, please read the page content below
International Journal of
           Environmental Research
           and Public Health

Article
Development and Evaluation of the Psychometric
Properties of a Brief Wisdom Development Scale
Sai-fu Fung , Esther Oi-wah Chow *                    and Chau-kiu Cheung
 Department of Social and Behavioural Sciences, City University of Hong Kong, Hong Kong, China;
 sffung@cityu.edu.hk (S.-f.F.); ssjacky@cityu.edu.hk (C.-k.C.)
 * Correspondence: esther.chow.ss@cityu.edu.hk

 Received: 24 February 2020; Accepted: 11 April 2020; Published: 15 April 2020

 Abstract: This study was to develop an 18-item Brief Wisdom Development Scale, based on the original
 66-item Wisdom Development Scale, and evaluate the psychometric properties of the proposed scale
 using a sample of older adults. This longitudinal study recruited 153 community-dwelling adults
 (mean = 72.55 years old; SD = 8.47) from older adult service centres. Using a repeated measures
 design, the study obtained four waves of data from the participants over 12 months. The Brief
 Wisdom Development Scale (BWDS) was developed based on the Stepwise Confirmatory Factor
 Analytical approach (SCOFA), with further verification of its factorial validity using confirmatory
 factor analysis (CFA). The results suggest that the BWDS comprising 18 items with a six-factor
 structure is comparable with its full version and possesses good psychometric properties in internal
 consistency, concurrent validity, and factorial validity. The BWDS provides an efficient, reliable, and
 valid construct to measure wisdom. The implications for research development are discussed here.

 Keywords: assessment; geriatrics; psychometrics; wisdom; confirmatory factor analysis

1. Introduction
     The concept of wisdom has a long history that can be traced back to ancient civilisations.
A wisdom construct has been conceptualised epistemologically and ontologically within the field of
psychology in recent years [1,2]. According to Brown and Greene [3], empirical research on wisdom
can be conceptualised into three categories: implicit theories of wisdom, analyses of wisdom-related
performance and latent factor analyses of wisdom. They contributed to the last category by developing
a Wisdom Development Scale (WDS) [3–5]. The focus of this study was on revising that scale by
developing a short and efficient latent construct to measure wisdom
     Over the past two decades, there have been several attempts to develop constructs to measure
wisdom through latent factor techniques with survey methods [6–9]. Most pertinent to the present
study, the WDS is comprised of 66 items with eight dimensions, namely self-knowledge, altruism,
leadership, judgment, life knowledge, life skills, emotional management and willingness to learn [3,5].
The WDS is considered the longest of the constructs used to measure wisdom [10]. The scale had been
recently used to study the leadership styles among secondary school principals [11].
     Nevertheless, the full version of WDS may suffer from the potential issue of poor factorial validity.
As such, the confirmatory factor analysis (CFA) results of WDS, in particular the CFI and TLI values
(ranged from 0.67 to 0.75) reported by the original scale developers, failed to fulfil the cut-off criteria
for good model fit [5]. Some scholars tried to address this issue by combining the WDS with another
wisdom scale, such as Self-Assessed Wisdom (SAWS) [8,9]. In recent years, Urrutia et al. [12] suggested
a 20-item measure for wisdom, based on a sample of Argentina’s older adults. Yet, their reported
CFA results only suggested very marginal model fit. Combining two distinctive wisdom measures to

Int. J. Environ. Res. Public Health 2020, 17, 2717; doi:10.3390/ijerph17082717   www.mdpi.com/journal/ijerph
Int. J. Environ. Res. Public Health 2020, 17, 2717 2 of 14
form a new scale may have the potential danger of undermining its conceptual equivalency with the
original scale.
Hence, the aims of this study were threefold. First of all, there is an urgent need to evaluate the
WDS. The initial concept of the Wisdom Development Scale (WDS) was introduced in 2004 based on
findings from college students [4]. Yet, within five years, the number of items and factor structure of the
scale has been significantly adjusted and modified by its original authors [3,5]. As Greene and Brown [5]
also urged, ‘WDS with a collegiate sample, but cross validation of those findings with other samples,
as well as an examination of other types of validity, such as predictive and criterion-based studies,
are needed’ (p. 290). Second, there is also a need to evaluate the WDS with different respondents and
intervention programme. As suggested by Greene and Brown [5], their proposed measure of wisdom
can be used to understand ‘various types of interventions and experiences’ (p. 290). To serve this
purpose, this study attempts to evaluate the WDS with a clinical sample recruited from older adult
service centres. Lastly, there is a scarcity of studies offering cross-cultural validation and evaluation
of the WDS [13,14], and the length of the questionnaire may discourage its use by researchers and
practitioners when conceiving surveys or clinical research studies [15,16]. The existing wisdom
literature has vividly discussed the limitations of the existing full version of self-reported wisdom
measures [1,7,13,14,17–20]. The abbreviated versions have thus been developed in recent years to
address these limitations [7,12,21–24].
In short, this study is to critically examine the full version of WDS and develop a brief version of
the WDS using the latest psychometric evaluation tools, examining its internal consistency, concurrent
validity and factorial validity.
2. Materials and Methods
2.1. Participants
This longitudinal study used a repeated measures design with 153 older adults (mean = 72.55 years old;
SD = 8.47) from older adult service centres in Hong Kong [25–27]. There were 25.5% male and 74.5%
female respondents (Table 1). All of the respondents voluntarily participated in the study and
possessed sufficient cognitive ability to understand and respond to the questionnaire. The research
team originally recruited 157 respondents. Four incomplete questionnaires were removed from the
subsequent analysis. The study was carried out in four waves, with respondents invited to fill in the
questionnaire in different time frames. The initial baseline study (Study 1; n = 153) was conducted in
June 2016. The sample was then divided into two groups: a control group (n = 75), and an experimental
group (n = 78) who received narrative therapy [28–32]. The second wave (Study 2; n = 136) was
conducted one month after the baseline study. Subsequently, Study 3 (n = 136) and Study 4 (n = 98)
were conducted two and eight months after the initial study, respectively. The research process strictly
adhered to international ethical standards with written consent obtained from all the participants.
Accordingly, the participants could decide to quit the project at any time, and hence the number
of samples decreased over time. The project was endorsed by the research ethics committee of the
university (Ethics Approval Number: H000749).
2.2. Measurement
The WDS was subjected to multiple stages of development before the most commonly used
format was arrived at. Brown [4] initiated the development of more than 1000 individual concepts
relating to wisdom constructs, studying university students using qualitative methods. The WDS was
then developed with a six-factor structure, made up of self-knowledge, interpersonal understanding,
judgment, life knowledge, life skills and willingness to learn [3]. It was then further conceptualised
with an eight-factor structure by splitting interpersonal understanding into altruism and leadership
and extracting emotional management from life skills; the other four factors remained unchanged.
Hence, the latest version of the WDS comprises 66 items with eight dimensions, namely self-knowledgeInt. J. Environ. Res. Public Health 2020, 17, 2717 3 of 14
(items 1–4), emotional management (items 5–9), altruism (items 10–20), inspirational engagement
(items 22-31), judgment (items 32–39), life knowledge (items 40–50), life skills (items 51–61) and
willingness to learn (62–66), evaluated with a seven-point Likert type scale, ranging from 1 = strongly
disagree to 7 = strongly agree [5].
Table 1. Participant demographic characteristics.
Variable Respondents
Age mean (SD) 72.55 (8.47)
Gender n (%)
Male 40 (26.1%)
Female 113 (73.9%)
Education level n (%)
No formal education 24 (15.7%)
Primary education 48 (31.4%)
Secondary education 45 (29.4%)
Tertiary education 30 (19.6%)
Missing 6 (3.9%)
Marital status n (%)
Single 13 (8.5%)
Married 63 (41.2%)
Divorced/separated 15 (9.8%)
Widowed 61 (39.9%)
Other 1 (0.7%)
2.3. Procedure
The participants in this study were recruited from 13 older adult service centres scattered across
various districts of Hong Kong. The 66 items of the WDS were translated into Chinese by two
professional translators in adherence to the back-translation procedure. The translated version has
been verified by the research team to ensure its semantic and conceptual equivalency as well as its
sensitivity to cross-cultural differences [33,34].
The item selection process for the abbreviation version of the WDS was based on the Stepwise
Confirmatory Factor Analytical approach (SCOFA) [35] and the criteria and practice stipulated in the
literature on scale development and validation [36–42]. The following two-step procedure has been
adopted. In the first step, we used the SCOFA, cross-checking the alpha if item was deleted, and
McDonald’s omega to ensure that the abbreviated version is above the value of 0.70 from the data of
Study 1 [43–46]. In addition, we retained at least three items per factor to ensure conceptual equivalency
with the full scale and avoid the potential problem of unidentification [40]. Subsequently, CFA is
conducted based on Studies 2, 3 and 4 to ensure a newly developed scale with good factorial validity.
In the second step, we have to demonstrate that the proposed BWDS possesses good concurrent
validity, i.e., the scale possessing strong positive correlation (> 0.70) with the full version of the WDS;
and replicates the correlational direction and magnitude of the other construct-related scales reported
in the wisdom literature.
To demonstrate the problem of the existing WDS, this study employed CFA to evaluate the
factorial validity of the 66-item full version of the WDS and 18-item brief WDS. Due to the ordinal
variables produced by the use of the Likert scale for the WDS items, diagonally weighted least squares
(DWLS) were employed as the CFA estimator [47–49]. The CFA results were interpreted with reference
to the following commonly used cut-off criteria for adequate model fit: CFI > 0.95, TLI > 0.95, RMSEA
< 0.08, and SRMR < 0.08 [50–52]. In addition to the above criteria, the results should demonstrate
acceptable model fit with χ2 / df ≤ 3 [53–56]. To avoid the potential for over-fitting, we conducted the
CFA on the newly proposed BWDS with different datasets obtained from various waves of the study
to evaluate its factorial validity [39,57,58].Int. J. Environ. Res. Public Health 2020, 17, 2717 4 of 14
The BWDS was also evaluated with psychometric testing tools: both Cronbach’s alpha [59] and
corrected item-total correlation between the 18 items were used to assess the internal consistency of
the reduced scale [40,60]. The McDonald’s omega, including hierarchical subscale and omega total, are
also used to further evaluate the dimensionality of the scale [43–46,61].
The wisdom construct has been widely discussed in the literature as being associated positively
with self-esteem, well-being and other wisdom scales [62–66]. Hence, the concurrent validity of the
BWDS was evaluated with the following well-established measures: the Rosenberg Self-esteem (RSE)
Scale comprises 10 items to measure self-esteem on a 4-point Likert-type scale ranging from 0 = strongly
disagree to 3 = strongly agree. Items 3, 5, 8 9 and 10 are reversed in valence. Higher scores signify high
level of self-esteem [67,68]; Personal Well-being Index (PWI) is evaluated on a 10-point Likert-type scale
(0 = never; 5 = always) with 7 questions of satisfaction with specific life domains; high score indicates
high level of well-being [69]; and the Self-Assessed Wisdom Scale (SAWS) comprises 40 items with a
6-point Likert-type scale (1 = strongly disagree to 6 = strongly agree) to measure five dimensions related
to wisdom, namely emotion regulation, reminiscence, openness, experience and humour [8,9,21].
Based on the wisdom literature, the wisdom construct is expected to hold a negative correlation with
depression symptoms [8,70,71]. Therefore, the Geriatric Depression Scale (GDS) was used to examine
the relationship between depression and the wisdom scales. GDS is a short version consisting of
15 items with a Yes/No format (0 = No; 1 = Yes). There are five items (1, 5, 7, 11 and 13) with reversed
scores. Higher scores refer to high level of depression [72–75]. The above measures, PWI (α = 0.86),
RSE (α = 0.73), SAWS (α = 0.88) and GDS (α = 0.85) used in this study possess alpha values above the
acceptable range. All of the above analyses were computed with the latest R (3.6.3) software (The R
Foundation for Statistical Computing, Vienna, Austria) with lavaan package 0.6–5 [76] and IBM SPSS
version 26.0 (International Business Machines Corporation, Armonk, NY, USA).
3. Results
3.1. Development of a Brief Wisdom Development Scale
The WDS recorded a poor factorial validity as illustrated in the results of the initial study (n = 153).
The CFA results suggested that the full version of the WDS with a 66-item eight-factor structure failed
to fulfil all of the criteria for good model fit, as χ2 (6445.127)/2051 = 3.14, p = < 0.001, SRMR = 0.10,
CFI = 0.97, TLI = 0.97 and RMSEA = 0.12. These findings provide the empirical evidence to support
the need to re-evaluate the factor structure and item composition of the WDS. The following sections
propose a new, abbreviated version of the WDS using the above mentioned item selection procedure.
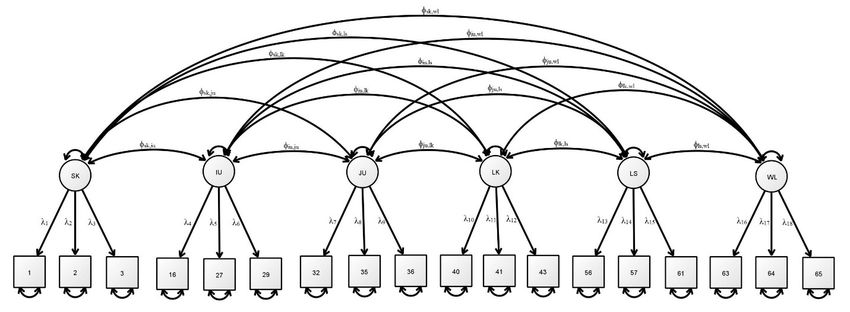
Based on the SCOFA, the newly proposed BWDS is comprised of six latent structures, including
self-knowledge (1, 2 and 3), interpersonal understanding (16, 27 and 29), judgment (32, 35 and 36), life
knowledge (40, 41 and 43), life skills (56, 57 and 61) and willingness to learn (63, 64 and 65). The BWDS
upholds the six original factor structures advocated for in the original WDS [3,5]. The items identified
above and the factor structure were further analysed with CFA. The results suggest that the newly
proposed 18-item BWDS possesses good model fit, with χ2 (222.975)/120 = 1.86, p = < 0.001, SRMR
= 0.06, CFI = 0.99, TLI = 0.99 and RMSEA = 0.08 (Study 1, n = 153). The subsequent section will
further evaluate the psychometric properties of the BWDS based on longitudinal data derived from
multi-wave studies (Studies 2, 3 and 4).
3.2. Internal Consistency
The key measures for the internal consistency of the BWDS from Study 1 (n = 153) are presented
in Table 2. The mean score of the 18-item BWDS was 91.31 (SD = 20.11). The corrected item-total
correlations for individual items in the shortened version of the WDS ranged from 0.49 to 0.76,
indicating its suitability for scale construction. The scale and its six latent structures were also found to
have above acceptable range in coefficient alpha (0.93), omega hierarchical (0.82) and omega total (0.96).
The results also indicated that the abbreviated version is comparable with its full version (Table 3).Int. J. Environ. Res. Public Health 2020, 17, 2717 5 of 14
Table 2. Descriptive statistics of 18-item Brief Wisdom Development Scale (BWDS).
Item x SD sk ku rit αiid
1. I am well aware of all of my weaknesses 5.11 1.64 −0.93 0.40 0.50 0.93
2. I am well aware of all of my values 4.84 1.64 −0.77 0.08 0.68 0.93
3. I am well aware of all of my interests 4.65 1.75 −0.75 −0.24 0.67 0.93
16. I learn from others 5.84 1.30 −1.44 2.53 0.65 0.93
27. I have general confidence in what I know 5.46 1.42 −1.09 0.95 0.64 0.93
29. I present well-supported arguments 4.58 1.84 −0.65 −0.50 0.57 0.93
32. I am aware of different ways of life, philosophies, and cultures 4.54 1.92 −0.57 −0.70 0.72 0.92
35. I integrate and apply what I have learned from one part of my life to another 5.11 1.68 −1.07 0.58 0.76 0.92
36. I understand how my background has shaped my perspective on things 5.16 1.60 −1.13 0.81 0.64 0.93
40. I see the interconnectedness between people and the natural world 4.55 1.87 −0.61 −0.67 0.65 0.93
41. I see the interconnectedness between knowledge and ideas 4.57 1.82 −0.67 −0.47 0.70 0.93
43. I recognize that there are cycles in life 5.07 1.79 −0.90 0.02 0.57 0.93
56. I have a sense of purpose in my life 4.54 1.86 −0.62 −0.55 0.65 0.93
57. I make sound decisions 5.18 1.52 −1.04 0.88 0.67 0.93
61. I attend to the important matters in my life 5.59 1.46 −1.23 1.46 0.59 0.93
63. I learn from my experiences 5.68 1.29 −1.19 1.60 0.70 0.93
64. I enjoy learning for the sake of learning 5.52 1.56 −1.28 1.29 0.49 0.93
65. I am open to change 5.34 1.58 −1.12 0.92 0.54 0.93
Note. x = mean; SD = standard deviation; sk = skewness; ku = kurtosis; rit = corrected item-total correlations;
αiid = Cronbach’s alpha, if item deleted.
Table 3. Cronbach’s Alpha for the WDS and BWDS latent structures.
Scale α Scale α
WDS 0.95 BWDS 0.93
Self-knowledge (SK) 0.75 Self-knowledge (SK) 0.77
Emotional management (EM) 0.60
Altruism (AL) 0.55 Interpersonal
0.70
Inspirational engagement (IE) 0.79 understanding (IU)
Judgement (JU) 0.84 Judgement (JU) 0.82
Life knowledge (LK) 0.84 Life knowledge (LK) 0.82
Life skills (LS) 0.88 Life skills (LS) 0.74
Willingness to learn (WL) 0.85 Willingness to learn (WL) 0.86
Note. IU was one of the original six-factor suggested by Brown and Greene [3] and it was split into AL and IE; EM
was extracted from the LS [5].
3.3. Factorial Validity
The factorial validity of the BWDS was further evaluated with the data from Study 2 (n = 136),
Study 3 (n = 136) and Study 4 (n = 98). The CFA results shown in Table 4 (see Figure 1 for the estimated
model) suggest that all of the models fulfil the criteria for adequate model fit. The CFA results in
Study 2 replicated the factor structure suggested by the Study 1 results, with χ2 (194.540)/120 = 1.62,
SRMR = 0.06, CFI = 0.99, TLI = 0.99 and RMSEA = 0.07. The subsequent CFA results for Studies 3 and
4 also yielded similar outcomes. It is worthy of mention that the CFA results for both the control and
experimental groups also supported the BWDS fulfilling all of the stringent cut-off criteria for good
model fit. The control group (Combo 1) model recorded CFA results of χ2 (285.375)/120 = 2.38, SRMR
= 0.05, CFI = 0.99, TLI = 0.99 and RMSEA = 0.07; likewise, the experimental group (Combo 2) results
also suggested good model fit, returning χ2 (316.482)/120 = 2.64, SRMR = 0.05, CFI = 0.99, TLI = 0.99
and RMSEA = 0.08. The McDonald omega results also indicated that the proposed BWDS possesses a
six-factor structure with relatively large omegaHS values, i.e., over 0.30 (ωhs.SK = 0.45; ωhs.IU = 0.039;
ωhs.JU = 0.67; ωhs.LK = 0.63; ωhs.LS = 0.68; ωhs.WL = 0.48) [46]. Overall, these results suggest that the
18-item Brief Wisdom Development Scale with a six-factor structure possesses good factorial validity.Int. J. Environ. Res. Public Health 2020, 17, 2717 6 of 14
Table 4. Factor loadings and fit indices in confirmatory factor analysis (CFA) for the BWDS, by study.
Study
Factor/Question Number 2 3 4 Combo 1 Combo 2
Self-knowledge (SK)
1 λ1 0.65 0.65 0.69 0.68 0.67
2 λ2 0.83 0.85 0.85 0.89 0.84
3 λ3 0.82 0.82 0.85 0.78 0.84
Interpersonal understanding
(IU)
16 λ4 0.79 0.79 0.78 0.77 0.65
27 λ5 0.74 0.79 0.81 0.79 0.82
29 λ6 0.68 0.68 0.65 0.79 0.64
Judgment (JU)
32 λ7 0.80 0.77 0.79 0.84 0.83
35 λ8 0.84 0.85 0.85 0.86 0.84
36 λ9 0.76 0.75 0.72 0.74 0.71
Life knowledge (LK)
40 λ10 0.86 0.86 0.87 0.89 0.86
41 λ11 0.89 0.88 0.89 0.91 0.91
43 λ12 0.75 0.76 0.77 0.81 0.74
Life skills (LS)
56 λ13 0.76 0.74 0.76 0.79 0.73
57 λ14 0.80 0.80 0.74 0.85 0.87
61 λ15 0.77 0.76 0.72 0.75 0.84
Willingness to learn (WL)
63 λ16 0.97 0.97 0.96 0.90 0.90
64 λ17 0.76 0.77 0.75 0.86 0.85
65 λ18 0.76 0.81 0.81 0.84 0.82
Latent factor covariance
SK–IU ϕsk,iu 0.81 0.82 0.82 0.85 0.81
SK–JU ϕsk,ju 0.83 0.85 0.84 0.78 0.76
SK–LK ϕsk,lk 0.79 0.77 0.75 0.75 0.70
SK–LS ϕsk,ls 0.76 0.78 0.79 0.82 0.70
SK–WL ϕsk,wl 0.66 0.67 0.67 0.73 0.64
IU–JU ϕiu,ju 0.96 0.95 0.95 0.94 0.97
IU–LK ϕiu,lk 0.73 0.69 0.62 0.81 0.81
IU–LS ϕiu,ls 0.94 0.93 0.92 0.95 0.96
IU–WL ϕiu,wl 0.85 0.83 0.89 0.90 0.92
JU–LK ϕju,lk 0.84 0.85 0.79 0.94 0.88
JU–LS ϕju,ls 0.85 0.85 0.81 0.91 0.88
JU–WL ϕju,wl 0.75 0.75 0.75 0.81 0.85
LK–LS ϕlk,ls 0.76 0.73 0.71 0.87 0.75
LK–WL ϕlk,wl 0.52 0.49 0.48 0.71 00.69
LS–WL ϕls,wl 0.77 0.77 0.77 0.85 0.84
Model fit
n 136 136 98 260 263
RMSEA 0.07 0.08 0.09 0.07 0.08
RMSEA 90% confidence
0.05–0.09 0.07–0.09 0.07–0.11 0.06–0.08 0.07–0.09
interval
SRMR 0.06 0.06 0.07 0.05 0.05
χ2 (df = 120) 194.540 231.227 211.623 285.375 316.482
χ2 /df 1.62 1.93 1.76 2.38 2.64
CFI 0.99 0.99 0.99 0.99 0.99
TLI 0.99 0.99 0.99 0.99 0.99
Note. RMSEA = root mean square error of approximation; SRMR = standardised root mean residual;
CFI = comparative fit index; TLI = Tucker Lewis index; Study 2 = initial study plus 1 month; Study 3 = initial study
plus 2 months; Study 4 = initial study plus 8 months; Combo 1 = combining study 1, 2, 3 and 4 control groups;
Combo 2 = combining study 1, 2, 3 and 4 experimental groups.= 0.05, CFI = 0.99, TLI = 0.99 and RMSEA = 0.07; likewise, the experimental group (Combo 2) results
also suggested good model fit, returning χ2 (316.482)/120 = 2.64, SRMR = 0.05, CFI = 0.99, TLI = 0.99
and RMSEA = 0.08. The McDonald omega results also indicated that the proposed BWDS possesses
a six-factor structure with relatively large omegaHS values, i.e., over 0.30 (ωhs.SK = 0.45; ωhs.IU = 0.039;
ω hs.JU = 0.67; ωhs.LK = 0.63; ωhs.LS = 0.68; ωhs.WL = 0.48) [46]. Overall, these results suggest that the 18-item
Int. J. Environ. Res. Public Health 2020, 17, 2717 7 of 14
Brief Wisdom Development Scale with a six-factor structure possesses good factorial validity.
Figure 1. Estimated model for the 18-item Brief Wisdom Development Scale with six-factor structure.
Figure 1. Estimated model for the 18-item Brief Wisdom Development Scale with six-factor structure.
3.4. Concurrent Validity
Table 4. Factor loadings and fit indices in confirmatory factor analysis (CFA) for the BWDS, by study.
The results of Study 1 (n = 153) suggest that the brief version of the wisdom construct scale and its
Study
latent structures are comparable with its full version (Table 5). As such, the 66-item full version of the
Factor/question number 2 3 4 Combo 1 Combo 2
WDS correlated significantly with the 18-item abbreviated version of the WDS, with r = 0.95, p < 0.001.
Self-knowledge (SK)
1 λ1 0.65 0.65 0.69 0.68 0.67
2 λ2 0.83 0.85 0.85 0.89 0.84
3 λ3 0.82 0.82 0.85 0.78 0.84
Interpersonal understanding (IU)
16 λ4 0.79 0.79 0.78 0.77 0.65
27 λ5 0.74 0.79 0.81 0.79 0.82
29 λ6 0.68 0.68 0.65 0.79 0.64
Judgment (JU)
32 λ7 0.80 0.77 0.79 0.84 0.83
35 λ8 0.84 0.85 0.85 0.86 0.84
36 λ9 0.76 0.75 0.72 0.74 0.71
Life knowledge (LK)
40 λ10 0.86 0.86 0.87 0.89 0.86
41 λ11 0.89 0.88 0.89 0.91 0.91
43 λ12 0.75 0.76 0.77 0.81 0.74
Life skills (LS)
56 λ13 0.76 0.74 0.76 0.79 0.73
57 λ14 0.80 0.80 0.74 0.85 0.87
61 λ15 0.77 0.76 0.72 0.75 0.84
Willingness to learn (WL)
63 λ16 0.97 0.97 0.96 0.90 0.90
64 λ17 0.76 0.77 0.75 0.86 0.85
65 λ18 0.76 0.81 0.81 0.84 0.82
Latent factor covariance
SK–IU φsk,iu 0.81 0.82 0.82 0.85 0.81
SK–JU φsk,ju 0.83 0.85 0.84 0.78 0.76Int. J. Environ. Res. Public Health 2020, 17, 2717 8 of 14
Table 5. Correlations for the WDS and BWDS latent structures.
Scale (1) (2) (3) (4) (5) (6) (7) (8) (9) (10) (11) (12) (13) (14) (15) (16)
1. BWDS: total score -
2. BWDS: SK 0.80 -
3. BWDS: IU 0.84 0.60 -
4. BWDS: JU 0.86 0.60 0.66 -
5. BWDS: LK 0.80 0.63 0.53 0.68 -
6. BWDS: LS 0.84 0.57 0.72 0.66 0.60 -
7. BWDS: WL 0.74 0.50 0.64 0.58 0.38 0.56 -
8. WDS: total score 0.95 0.73 0.83 0.79 0.75 0.81 0.70 -
9. WDS: SK 0.80 0.94 0.60 0.64 0.60 0.59 0.50 0.74 -
10. WDS: EM 0.60 0.51 0.60 0.50 0.45 0.45 0.46 0.69 0.52 -
11. WDS: AL 0.47 0.28 0.52 0.34 0.31 0.44 0.42 0.64 0.33 0.37 -
12. WDS: IE 0.74 0.54 0.83 0.60 0.49 0.65 0.55 0.86 0.56 0.67 0.61 -
13. WDS: JU 0.90 0.64 0.70 0.90 0.79 0.73 0.59 0.89 0.67 0.50 0.46 0.66 -
14. WDS: LK 0.79 0.64 0.55 0.68 0.88 0.60 0.46 0.81 0.61 0.47 0.38 0.55 0.80 -
15. WDS: LS 0.85 0.63 0.76 0.66 0.59 0.91 0.62 0.87 0.61 0.53 0.45 0.73 0.75 0.60 -
16. WDS: WL 0.69 0.45 0.65 0.53 0.34 0.51 0.96 0.69 0.46 0.46 0.49 0.57 0.55 0.41 0.58 -
Note. All correlations are significant at the 0.001 level (2-tailed). SK = self-knowledge; IU = interpersonal understanding; EM = emotional management; AL = altruism; UE = inspirational
engagement; JU = judgment; LK = life knowledge; LS = life skills; WL = willingness to learn.Int. J. Environ. Res. Public Health 2020, 17, 2717 9 of 14
The BWDS also replicated the correlational direction and magnitude of other wisdom-related
measurements of well-being, self-esteem, depression and other wisdom constructs. The BWDS had
significant moderate to strong positive correlations with the PWI (r = 0.43, p < 0.001), RSE (r = 0.45,
p < 0.001) and SAWS (r = 0.75, p < 0.001), as illustrated in Table 6. The 18-item BWDS also exhibited a
significant moderate negative correlation with GDS (r = −0.43, p < 0.001). Hence, the results indicate that
the BWDS holds good concurrent validity with other well-established wisdom construct–related scales.
Table 6. Correlations between WDS and BWDS in relation to other construct-related scales.
Scale PWI RSE SAWS GDS
1. BWDS: total score 0.43 0.45 0.75 −0.43
2. BWDS: SK 0.26 0.39 0.57 −0.26
3. BWDS: IU 0.46 0.49 0.63 −0.44
4. BWDS: JU 0.35 0.36 0.67 −0.39
5. BWDS: LK 0.32 0.36 0.66 −0.32
6. BWDS: LS 0.40 0.33 0.60 −0.36
7. BWDS: WL 0.31 0.28 0.51 −0.35
8. WDS: total score 0.46 0.47 0.76 −0.44
9. WDS: SK 0.33 0.40 0.59 −0.27
10. WDS: EM 0.53 0.47 0.51 −0.51
11. WDS: AL 0.26 0.24 0.33 −0.25
12. WDS: IE 0.56 0.56 0.60 −0.47
13. WDS: JU 0.35 0.37 0.75 −0.38
14. WDS: LK 0.26 0.31 0.72 −0.26
15. WDS: LS 0.39 0.38 0.64 −0.36
16. WDS: WL 0.31 0.26 0.48 −0.35
Note. All correlations are significant at the 0.001 level (2-tailed). PWI = Personal well-being index; RSE = Rosenberg
self-esteem; SAWS = Self-Assessed Wisdom Scale; GDS = Geriatric depression scale.
4. Discussion
The empirical data support and justify the development of the 18-item brief version of the Wisdom
Development Scale. The CFA results of the 66-item full version of the WDS were similar to those
reported by Greene and Brown [5], which failed to fulfil the current standard criteria for adequate
model fit. In general, the proposed BWDS possesses good psychometric properties with the alpha
coefficient of 0.93 similar to that reported for the 66-item full version of the WDS (α = 0.95) [3]. We also
found that the shortened version is comparable with the full version, as reflected by the following
metrics. In view of the concurrent validity, both scales hold the same correlational direction and
magnitude in relation to the wisdom-related constructs, such as well-being, self-esteem and depression.
The BWDS also has a very strong significantly positive correlation (0.95) with its full version. The total
score of BWDS in Studies 1, 2, 3 and 4 are consistent, with x = 91.31 (SD = 20.1), 92.72 (SD = 18.27),
93.29 (SD = 17.69), and 92.78 (SD = 19.34), respectively.
The six-factor latent structure identified in the BWDS echoes the conceptual factor structure of the
original scale’s theoretical assumptions, i.e., self-knowledge, interpersonal understanding, judgment,
life knowledge, life skills and willingness to learn [3,5]. The scale developers subsequently added the
seventh and eighth factors into the scale. However, according to Brown and Greene [3], the eight-factor
structure in their exploratory factor analysis results only yielded 40% of the total variance. They also
admitted that some ‘items will be set aside for future research into why they loaded together, but given
that their grouping did not fit with the theoretical framework of the study’ (p. 11). The two additional
factors, emotional management and altruism, were split into multiple subscales from interpersonal
understanding and life skills, respectively, due to the complicated factor structure. Their reported
CFA results also indicated a poor model fit for the eight-factor structure. The present study offers
a solution to these issues, by proposing an abbreviated version of the WDS with an item selection
strategy suggested by Schroeders, Wilhelm and Olaru [35]. The advantage of SCOFA can compile theInt. J. Environ. Res. Public Health 2020, 17, 2717 10 of 14
short version with high reliability, but may have issue with validity. To avoid this problem, this study
involved a two-step procedure for the item selection process to develop the abbreviated version of
the WDS. The results demonstrated that the shortened version of WDS possesses good psychometric
properties, including internal consistency and convergent validity. Furthermore, the CFA results
support the 18-item BWDS with six latent factors as fulfilling all of the latest requirements for good
model fit.
This study may have the following limitations. First, the small sample size may hinder the
reliability of the findings, and could explain why the RMSEA values in Study 4 (n = 98) only yielded a
marginally adequate value of 0.09 (95% CI). With a 90% confidence interval, the RMSEA values are
within the threshold of the acceptable range. The small sample size is due to the difficulties involved in
recruiting a large number of older adults from the service centres. We attempted to use two measures to
alleviate the problem. This study uses DWLS as the CFA estimator. The simulation studies suggested
that this estimator works well with the model with small sample size (N > 50) [47,77–80]. The research
design of this study may also counteracts this limitation by using a longitudinal study with a repeated
measures design [81]. Consequently, the CFA results at different time points, pretests and posttests
after interventions all indicated a good model fit for the BWDS. One may suggest further examination
of the measurement invariance of the scale. Yet there are still many outstanding ‘methodological
issues surrounding the measurement invariance testing’ (p. 78) which may be beyond the scope of this
paper [82]. Second, the demographic background of the respondents may limit the variance of the data.
The older adults participating in this study have an average age of over 70 and are settled in older
adult service centres on a long-term basis, which could limit their access to learning opportunities in
formal academic institutions or other settings. In contrast, the original WDS was developed amongst
college students, who are more open to change and striving to learn [3,5]. Therefore the results may
have limited generalisability to other contexts and populations. Hence, research projects aiming to
further validate this refinement of the WDS should be conducted to increase the sample size and to
recruit respondents with various demographic and cross-cultural backgrounds. We also encourage
researchers to use other validation methods, such as item response theory or Bayes method to further
evaluate the BWDS.
5. Conclusions
In short, this study developed and evaluated the psychometric properties of a new 18-item
brief version of the WDS. The BWDS is comparable with the full version of the WDS, possessing
excellent psychometric properties with good internal consistency, concurrent validity and factorial
validity. The introduction of the BWDS provides an efficient, reliable and valid construct to measure
wisdom through latent factor techniques that can enable practitioners and researchers alike to conceive
intervention programmes or survey research projects in gerontology and other related fields.
Author Contributions: Conceptualisation; Methodology, Validation; Formal Analysis; Investigation;
Writing—S.-f.F.; Methodology, Funding Acquisition, Project Administration; Data Curation—E.O.-w.C. and
C.-k.C. All authors have read and agreed to the published version of the manuscript.
Funding: The project is funded by the General Research Fund provided by the Research Grant Council, Hong
Kong (grant number: 9042296). The funding body had no influence on the content of the paper and the
publication process.
Conflicts of Interest: The authors declare no conflict of interest.
References
1. Bangen, K.J.; Meeks, T.W.; Jeste, D.V. Defining and Assessing Wisdom: A Review of the Literature. Am. J.
Geriatr. Psychiatr. 2013, 21, 1254–1266. [CrossRef]
2. Seligman, M.E.P.; Csikszentmihalyi, M. Positive psychology—An introduction. Am. Psychol. 2000, 55, 5–14.
[CrossRef] [PubMed]Int. J. Environ. Res. Public Health 2020, 17, 2717 11 of 14
3. Brown, S.C.; Greene, J.A. The wisdom development scale: Translating the conceptual to the concrete. J. Coll.
Stud. Dev. 2006, 47, 1–19. [CrossRef]
4. Brown, S.C. Learning across the campus: How college facilitates the development of wisdom. J. Coll.
Stud. Dev. 2004, 45, 134–148. [CrossRef]
5. Greene, J.A.; Brown, S.C. The wisdom development scale: Further validity investigations. Int. J. Aging
Hum. Dev. 2009, 68, 289–320. [CrossRef] [PubMed]
6. Wink, P.; Helson, R. Practical and transcendent wisdom: Their nature and some longitudinal findings.
J. Adult Dev. 1997, 4, 1–15. [CrossRef]
7. Ardelt, M. Empirical assessment of a three-dimensional wisdom scale. Res. Aging 2003, 25, 275–324.
[CrossRef]
8. Webster, J.D. An exploratory analysis of a self-assessed wisdom scale. J. Adult Dev. 2003, 10, 13–22. [CrossRef]
9. Webster, J.D. Measuring the Character Strength of Wisdom. Int. J. Aging Hum. Dev. 2007, 65, 163–183.
[CrossRef]
10. Snyder, C.R.; Lopez, S.J.; Pedrotti, J.T. Positive Psychology: The Scientific and Practical Explorations of Human
Strengths, 3rd ed.; SAGE: Thousand Oaks, CA, USA, 2015.
11. Parco-Tropicales, M.; de Guzman, A.B. A structural equation model (SEM) of the impact of transformational,
visionary, charismatic and ethical leadership styles on the development of wise leadership among Filipino
private secondary school principals. Asia Pac. Educ. Rev. 2014, 15, 547–559. [CrossRef]
12. Urrutia, A.; de Espanes, G.M.; Ferrari, C.; Borgna, G.; Alderete, A.M.; Villar, F. Development and validation
of the Brief Scale of Self-assessed Wisdom (EBAS) in Argentinian older adults. Univ. Psychol. 2016, 15, 11.
13. Glück, J. Measuring Wisdom: Existing Approaches, Continuing Challenges, and New Developments.
J. Gerontol. Ser. B Psychol. Sci. Soc. Sci. 2018, 73, 1393–1403.
14. Glück, J.; König, S.; Naschenweng, K.; Redzanowski, U.; Dorner-Hörig, L.; Strasser, I.; Wiedermann, W.
How to measure wisdom: Content, reliability, and validity of five measures. Front. Psychol. 2013, 4, 405.
[CrossRef] [PubMed]
15. Snaith, R.P.; Hamilton, M.; Morley, S.; Humayan, A.; Hargreaves, D.; Trigwell, P. A scale for the assessment of
hedonic tone—The snaith-hamilton pleasure scale. Br. J. Psychiatry 1995, 167, 99–103. [CrossRef] [PubMed]
16. Adewuya, A.O.; Ola, B.A.; O Afolabi, O. Validity of the patient health questionnaire (PHQ-9) as a screening
tool for depression amongst Nigerian university students. J. Affect. Disord. 2006, 96, 89–93. [CrossRef]
[PubMed]
17. Taylor, M.; Bates, G.; Webster, J.D. Comparing the psychometric properties of two measures of wisdom:
Predicting forgiveness and psychological well-being with the Self-Assessed Wisdom Scale (SAWS) and the
Three-Dimensional Wisdom Scale (3D-WS). Exp. Aging Res. 2011, 37, 129–141. [CrossRef] [PubMed]
18. Webster, J.D.; Taylor, M.; Bates, G. Conceptualizing and measuring wisdom: A reply to Ardelt reply.
Exp. Aging Res. 2011, 37, 256–259. [CrossRef]
19. Ardelt, M. The measurement of wisdom: A commentary on Taylor, Bates, and Webster’s comparison of the
SAWS and 3D-WS. Exp. Aging Res. 2011, 37, 241–255. [CrossRef]
20. Webster, J.D. Self-Report Wisdom Measures: Strengths, Limitations, and Future Directions. In The Cambridge
Handbook of Wisdom; Glück, J., Sternberg, R.J., Eds.; Cambridge University Press: Cambridge, UK, 2019;
pp. 297–320.
21. Fung, S.-F.; Chow, E.O.-W.; Cheung, C.-K. Development and validation of a brief self-assessed wisdom scale.
BMC Geriatr. 2020, 20, 1–8. [CrossRef]
22. Thomas, M.L.; Bangen, K.J.; Ardelt, M.; Jeste, D.V. Development of a 12-Item Abbreviated Three-Dimensional
Wisdom Scale (3D-WS-12): Item Selection and Psychometric Properties. Assessment 2017, 24, 71–82. [CrossRef]
23. Cheung, C.-K.; Chow, E.O.-W. Contribution of Wisdom to Well-Being in Chinese Older Adults. Appl. Res.
Qual. Life 2019. [CrossRef]
24. Li, H.Q.; Wang, F.Y. A three-dimensional model of the wise personality: A free classification approach.
Soc. Behav. Pers. 2017, 45, 1879–1888. [CrossRef]
25. Dunlap, W.P.; Cortina, J.M.; Vaslow, J.B.; Burke, M.J. Meta-analysis of experiments with matched groups or
repeated measures designs. Psychol. Methods 1996, 1, 170–177. [CrossRef]
26. Ellis, M.V. Repeated Measures Designs. Counsel. Psychol. 1999, 27, 552–578. [CrossRef]
27. Obrien, R.G.; Kaiser, M.K. Manova method for analyzing repeated measures designs—An extensive primer.
Psychol. Bull. 1985, 97, 316–333. [CrossRef]Int. J. Environ. Res. Public Health 2020, 17, 2717 12 of 14
28. Goodcase, E.T.; Love, H.A. From Despair to Integrity: Using Narrative Therapy for Older Individuals in
Erikson’s Last Stage of Identity Development. Clin. Soc. Work J. 2017, 45, 354–363. [CrossRef]
29. Freedman, J. Narrative Therapy: The Social Construction of Preferred Realities; W.W. Norton & Company:
New York, NY, USA, 1996.
30. Kogan, S.M.; Gale, J.E. Decentering therapy: Textual analysis of a narrative therapy session. Fam. Process
1997, 36, 101–126. [CrossRef]
31. Brown, C. Narrative Therapy: Making Meaning, Making Lives; SAGE Publications, Inc.: Thousand Oaks, CA,
USA, 2007.
32. Muruthi, B.; McCoy, M.; Chou, J.; Farnham, A. Sexual Scripts and Narrative Therapy with Older Couples.
Am. J. Fam. Ther. 2018, 46, 81–95. [CrossRef]
33. Cha, E.S.; Kim, K.H.; Erlen, J.A. Translation of scales in cross-cultural research: Issues and techniques.
J. Adv. Nurs. 2007, 58, 386–395. [CrossRef]
34. Brislin, R.W. Back-Translation for Cross-Cultural Research. J. Cross-Cult. Psychol. 1970, 1, 185–216. [CrossRef]
35. Schroeders, U.; Wilhelm, O.; Olaru, G. Meta-Heuristics in Short Scale Construction: Ant Colony Optimization
and Genetic Algorithm. PLoS ONE 2016, 11, e0167110. [CrossRef]
36. Loewenthal, K.M. An Introduction to Psychological Tests and Scales, 2nd ed.; Psychology Press: Philadelphia,
PA, USA, 2001.
37. Smith, G.T.; McCarthy, D.M.; Anderson, K.G. On the sins of short-form development. Psychol. Assess. 2000,
12, 102–111. [CrossRef] [PubMed]
38. Svedholm-Hakkinen, A.M.; Lindeman, M. Actively open-minded thinking: Development of a shortened
scale and disentangling attitudes towards knowledge and people. Think Reason. 2018, 24, 21–40. [CrossRef]
39. Fung, S.-F.; Fung, A.L.C. Development and evaluation of the psychometric properties of a brief parenting
scale (PS-7) for the parents of adolescents. PLoS ONE 2020, 15, e0228287. [CrossRef] [PubMed]
40. Hair, J.F. Multivariate Data Analysis, 7th ed.; Prentice Hall: Upper Saddle River, NJ, USA, 2010.
41. Fung, S.-F. Revisiting the dimensionality of the Brief Sensation Seeking Scale in Mainland China. Soc. Behav.
Pers. 2020, 48, 12. [CrossRef]
42. Fung, S.-F. Validity of the Brief Resilience Scale and Brief Resilient Coping Scale in a Chinese Sample. Int. J.
Environ. Res. Public Health 2020, 17, 1265. [CrossRef]
43. McDonald, R.P. Test Theory: A Unified Treatment; L. Erlbaum Associates: London, UK, 1999.
44. Zinbarg, R.E.; Revelle, W.; Yovel, I.; Li, W. Cronbach’s alpha, Revelle’s beta, and McDonald’s (omega H):
Their relations with each other and two alternative conceptualizations of reliability. Psychometrika 2005, 70,
123–133. [CrossRef]
45. Revelle, W.; Zinbarg, R.E. Coefficients Alpha, Beta, Omega, and the glb: Comments on Sijtsma. Psychometrika
2009, 74, 145–154. [CrossRef]
46. Gignac, G.E.; Kretzschmar, A. Evaluating dimensional distinctness with correlated-factor models: Limitations
and suggestions. Intelligence 2017, 62, 138–147. [CrossRef]
47. Li, C.-H. Confirmatory factor analysis with ordinal data: Comparing robust maximum likelihood and
diagonally weighted least squares. Behav. Res. Methods 2016, 48, 936–949. [CrossRef]
48. Jöreskog, K.G. A general approach to confirmatory maximum likelihood factor analysis. Psychometrika 1969,
34, 183–202. [CrossRef]
49. DiStefano, C.; Morgan, G.B. A Comparison of Diagonal Weighted Least Squares Robust Estimation Techniques
for Ordinal Data. Struct. Eq. Model. 2014, 21, 425–438. [CrossRef]
50. Brown, T.A. Confirmatory Factor Analysis for Applied Research, 2nd ed.; Guilford Publications: New York, NY,
USA, 2014.
51. Hu, L.T.; Bentler, P.M. Cutoff criteria for fit indexes in covariance structure analysis: Conventional criteria
versus new alternatives. Struct. Eq. Model. 1999, 6, 1–55. [CrossRef]
52. Schreiber, J.B.; Nora, A.; Stage, F.K.; Barlow, E.A.; King, J. Reporting Structural Equation Modeling and
Confirmatory Factor Analysis Results: A Review. J. Educ. Res. 2006, 99, 323–338. [CrossRef]
53. Kline, R.B. Principles and Practice of Structural Equation Modeling, 2nd ed.; Guilford Press: New York, NY,
USA, 2005.
54. Bentler, P.M.; Bonett, D.G. Significance tests and goodness of fit in the analysis of covariance structures.
Psychol. Bull. 1980, 88, 588–606. [CrossRef]Int. J. Environ. Res. Public Health 2020, 17, 2717 13 of 14
55. Byrne, B.M. Structural Equation Modeling with LISREL, PRELIS, and SIMPLIS: Basic Concepts, Applications, and
Programming; Mahwah, N.J., Ed.; L. Erlbaum Associates: London, UK, 1998.
56. Satorra, A.; Bentler, P.M. A scaled difference chi-square test statistic for moment structure analysis.
Psychometrika 2001, 66, 507–514. [CrossRef]
57. Fokkema, M.; Greiff, S. How Performing PCA and CFA on the Same Data Equals Trouble Overfitting in the
Assessment of Internal Structure and Some Editorial Thoughts on It. Eur. J. Psychol. Assess. 2017, 33, 399–402.
[CrossRef]
58. Babyak, M.A. What you see may not be what you get: A brief, nontechnical introduction to overfitting in
regression-type models. Psychosom. Med. 2004, 66, 411–421.
59. Cronbach, L.J. Coefficient alpha and the internal structure of tests. Psychometrika 1951, 16, 297–334. [CrossRef]
60. Tabachnick, B.G. Using Multivariate Statistics, 6th ed.; Pearson Education: Boston, MA, USA, 2013.
61. Fung, S.-F.; Kong, C.Y.W.; Huang, Q. Evaluating the Dimensionality and Psychometric Properties of the Brief
Self-Control Scale Amongst Chinese University Students. Front. Psychol. 2020, 10, 2903. [CrossRef]
62. Etezadi, S.; Pushkar, D. Why are wise people happier? An explanatory model of wisdom and emotional
well-being in older adults. J. Happiness Stud. 2013, 14, 929–950. [CrossRef]
63. Day, J.M. Religion, Spirituality, and Positive Psychology in Adulthood: A Developmental View. J. Adult Dev.
2010, 17, 215–229. [CrossRef]
64. Ardelt, M. Disentangling the Relations Between Wisdom and Different Types of Well-Being in Old Age:
Findings from a Short-Term Longitudinal Study. J. Happiness Stud. 2016, 17, 1963–1984. [CrossRef]
65. Clark, P.G. Quality-of-life, values, and teamwork in geriatric care—Do we communicate what we mean.
Gerontologist 1995, 35, 402–411. [CrossRef] [PubMed]
66. Hultsch, D.F.; MacDonald, S.W.S.; Hunter, M.A.; Maitland, S.B.; Dixon, R.A. Sampling and generalisability in
developmental research: Comparison of random and convenience samples of older adults. Int. J. Behav. Dev.
2002, 26, 345–359. [CrossRef]
67. Wu, Y.; Zuo, B.; Wen, F.F.; Yan, L. Rosenberg Self-Esteem Scale: Method Effects, Factorial Structure and Scale
Invariance Across Migrant Child and Urban Child Populations in China. J. Pers. Assess. 2017, 99, 83–93.
[CrossRef] [PubMed]
68. Rosenberg, M.; Schooler, C.; Schoenbach, C. Self-Esteem and Adolescent Problems: Modeling Reciprocal
Effects. Am. Sociol. Rev. 1989, 54, 1004–1018. [CrossRef]
69. IWG. Personal Wellbeing Inde, 5th ed.; Australia Center on Quality of Life, Deakin University: Melbourne,
Australia, 2013.
70. Khalaila, R. Depression statuses and related predictors in later life: A 10-year follow-up study in Israel. Eur. J.
Ageing 2016, 13, 311–321. [CrossRef]
71. Blazer, D.G.; Hybels, C.F. Origins of depression in later life. Psychol. Med. 2005, 35, 1241–1252. [CrossRef]
72. He, J.; Zhong, X.; Yao, S. Factor structure of the Geriatric Depression Scale and measurement invariance
across gender among Chinese elders. J. Affect. Disord. 2018, 238, 136–141. [CrossRef]
73. Dow, B.; Lin, X.; Pachana, N.A.; Bryant, C.; LoGiudice, D.; Goh, A.M.Y.; Haralambous, B. Reliability,
concurrent validity, and cultural adaptation of the Geriatric Depression Scale and the Geriatric Anxiety
Inventory for detecting depression and anxiety symptoms among older Chinese immigrants: An Australian
study. Int. Psychogeriatr. 2017, 30, 735–748. [CrossRef] [PubMed]
74. Yesavage, J.A.; Brink, T.L.; Rose, T.L.; Lum, O.; Huang, V.; Adey, M.; Leirer, V.O. Development and validation
of a geriatric depression screening scale—A preliminary-report. J. Psychiatr. Res. 1983, 17, 37–49. [CrossRef]
75. Yesavage, J.A.; Sheikh, J.I. Geriatric Depression Scale (GDS): Recent Evidence and Development of a Shorter
Version. Clin. Gerontol. 1986, 5, 165–173. [CrossRef]
76. Rosseel, Y. lavaan: An R Package for Structural Equation Modeling. J. Stat. Softw. 2012, 48, 36. [CrossRef]
77. Marsh, H.W.; Hau, K.-T.; Balla, J.R.; Grayson, D. Is More Ever Too Much? The Number of Indicators per
Factor in Confirmatory Factor Analysis. Multivar. Behav. Res. 1998, 33, 181–220. [CrossRef]
78. Velicer, W.F.; Fava, J.L. Effects of variable and subject sampling on factor pattern recovery. Psychol. Methods
1998, 3, 231–251. [CrossRef]
79. Rhemtulla, M.; Brosseau-Liard, P.E.; Savalei, V. When Can Categorical Variables Be Treated as Continuous? A
Comparison of Robust Continuous and Categorical SEM Estimation Methods Under Suboptimal Conditions.
Psychol. Methods 2012, 17, 354–373. [CrossRef]Int. J. Environ. Res. Public Health 2020, 17, 2717 14 of 14
80. Flora, D.B.; Curran, P.J. An empirical evaluation of alternative methods of estimation for confirmatory factor
analysis with ordinal data. Psychol. Methods 2004, 9, 466–491. [CrossRef]
81. Harbichova, I.; Komarc, M.; Scheier, L.M. Intrinsic motivation in sport measured by the sport motivation
scale in czech university students. Cesk. Psychol. 2019, 63, 510–525.
82. Putnick, D.L.; Bornstein, M.H. Measurement invariance conventions and reporting: The state of the art and
future directions for psychological research. Dev. Rev. 2016, 41, 71–90. [CrossRef]
© 2020 by the authors. Licensee MDPI, Basel, Switzerland. This article is an open access
article distributed under the terms and conditions of the Creative Commons Attribution
(CC BY) license (http://creativecommons.org/licenses/by/4.0/).You can also read