Planning Year 2020-2021 Loss of Load Expectation Study Report Loss of Load Expectation Working Group - Midcontinent Independent System ...
←
→
Page content transcription
If your browser does not render page correctly, please read the page content below

Planning Year 2020-2021 Loss of Load Expectation Study Report Loss of Load Expectation Working Group

Contents
1 Executive Summary .............................................................................................................5
2 LOLE Study Process Overview ............................................................................................6
 2.2 Future Study Improvement Considerations ...................................................................7
3 Transfer Analysis .................................................................................................................7
 3.1 Calculation Methodology and Process Description ........................................................7
 3.1.1 Generation pools ...................................................................................................8
 3.1.2 Redispatch .............................................................................................................8
 3.1.3 Generation Limited Transfer for CIL/CEL and ZIA/ZEA ..........................................8
 3.1.4 Voltage Limited Transfer for CIL/CEL and ZIA/ZEA ...............................................9
 3.2 Powerflow Models and Assumptions .............................................................................9
 3.2.1 Tools used .............................................................................................................9
 3.2.2 Inputs required .......................................................................................................9
 3.2.3 Powerflow Modeling ...............................................................................................9
 3.2.4 General Assumptions...........................................................................................10
 3.3 Results for CIL/CEL and ZIA/ZEA ...............................................................................12
 3.3.1 Out-Year Analysis ................................................................................................15
4 Loss of Load Expectation Analysis .....................................................................................16
 4.1 LOLE Modeling Input Data and Assumptions ..............................................................16
 4.2 MISO Generation ........................................................................................................16
 4.2.1 Thermal Units ......................................................................................................16
 4.2.2 Behind-the-Meter Generation...............................................................................18
 4.2.3 Sales ...................................................................................................................18
 4.2.4 Attachment Y .......................................................................................................18
 4.2.5 Future Generation ................................................................................................18
 4.2.6 Intermittent Resources .........................................................................................18
 4.2.7 Demand Response ..............................................................................................19
 4.3 MISO Load Data .........................................................................................................19
 4.3.1 Weather Uncertainty ............................................................................................19
 4.3.2 Economic Load Uncertainty .................................................................................20
 4.4 External System ..........................................................................................................20
 4.5 Loss of Load Expectation Analysis and Metric Calculations ........................................21
 4.5.1 MISO-Wide LOLE Analysis and PRM Calculation ................................................21

 1
4.5.2 LRZ LOLE Analysis and Local Reliability Requirement Calculation ......................21
5 MISO System Planning Reserve Margin Results ...............................................................22
 5.1 Planning Year 2020-2021 MISO Planning Reserve Margin Results ............................22
 5.1.1 LOLE Results Statistics .......................................................................................22
 5.2 Comparison of PRM Targets Across Eight Years ........................................................23
 5.3 Future Years 2020 through 2029 Planning Reserve Margins ......................................23
6 Local Resource Zone Analysis – LRR Results ...................................................................24
 6.1 Planning Year 2020-2021 Local Resource Zone Analysis ...........................................24
Appendix A: Comparison of Planning Year 2019 to 2020 ..........................................................28
 A.1 Waterfall Chart Details ....................................................................................................28
 A.1.1 Load .........................................................................................................................28
 A.1.2 Units .........................................................................................................................29
Appendix B: Capacity Import Limit source subsystem definitions (Tiers 1 & 2) ..........................30
Appendix C: Compliance Conformance Table ...........................................................................35
Appendix D: Acronyms List Table .............................................................................................39

 2
Tables
Table 1-1: Initial Planning Resource Auction Deliverables...........................................................5
Table 2-1: Example LRZ Calculation ...........................................................................................7
Table 3-1: Model assumptions ..................................................................................................10
Table 3-2: Example subsystem .................................................................................................11
Table 3-3: Planning Year 2020–2021 Capacity Import Limits ....................................................12
Table 3-4: Planning Year 2020–2021 Capacity Export Limits ....................................................14
Table 4-1: Historical Class Average Forced Outage Rates........................................................17
Table 4-2: Economic Uncertainty ..............................................................................................20
Table 4-3: 2019 Planning Year Firm Imports and Exports .........................................................21
Table 5-1: Planning Year 2020-2021 MISO System Planning Reserve Margins........................22
Table 5-2: MISO Probabilistic Model Statistics ..........................................................................23
Table 5-3: Future Planning Year MISO System Planning Reserve Margins ..............................24
Table 5-4: MISO System Planning Reserve Margins 2020 through 2029 ..................................24
Table 6-1: Planning Year 2020-2021 LRZ Local Reliability Requirements.................................25
Table 6-2: Planning Year 2023-2024 LRZ Local Reliability Requirements.................................25
Table 6-3: Planning Year 2025-2026 LRZ Local Reliability Requirements.................................26
Table 6-4: Time of Peak Demand for all 30 weather years ........................................................27

Figures
Figure 1-1: Local Resource Zones (LRZ) ....................................................................................6
Figure 3-1: Planning Year 2020-21 CIL Constraint Map ............................................................13
Figure 3-2: Planning Year 2020-21 CEL Constraint Map ...........................................................15
Figure 5-1: Comparison of PRM targets across eight years ......................................................23
Figure A-1: Waterfall Chart of 2019 PRM UCAP to 2020 PRM UCAP .......................................28

Equations
Equation 3-1: Total Transfer Capability .....................................................................................10
Equation 3-2: Machine 1 dispatch calculation for 100 MW transfer ...........................................11

 3
Revision History
 Reason for Revision Revised by: Date:
 Draft Posted MISO 10/16/2019
 Final Posted MISO 11/01/2019

 4

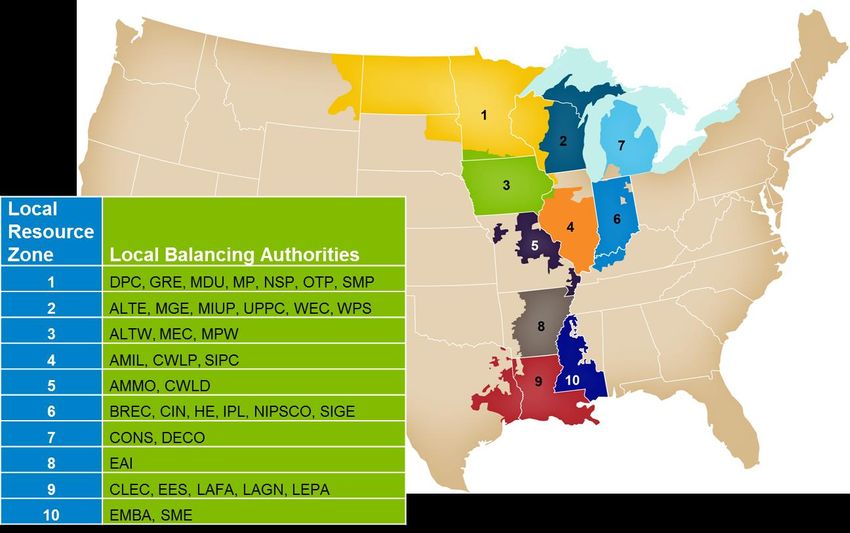
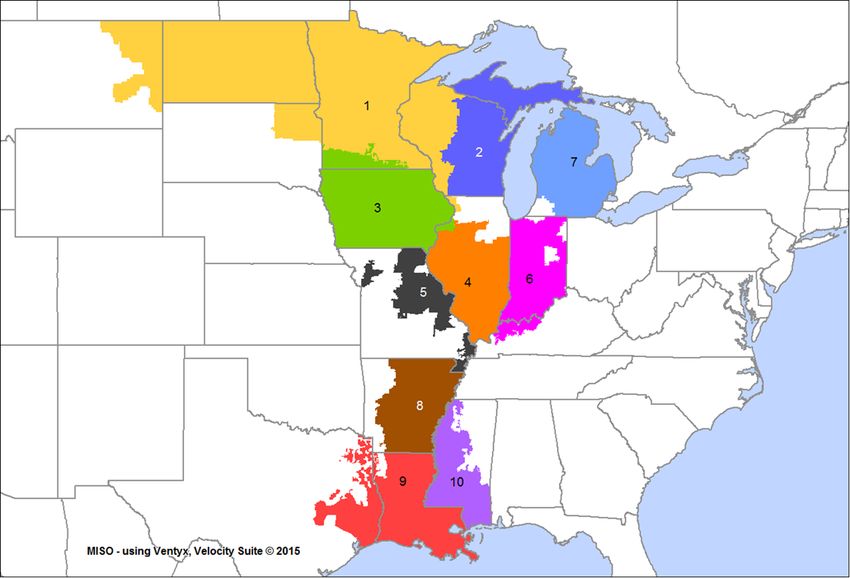
1 Executive Summary Midcontinent Independent System Operator (MISO) conducts an annual Loss of Load Expectation (LOLE) study to determine a Planning Reserve Margin Unforced Capacity (PRM UCAP), zonal per-unit Local Reliability Requirements (LRR), Zonal Import Ability (ZIA), Zonal Export Ability (ZEA), Capacity Import Limits (CIL) and Capacity Export Limits (CEL). The results of the study and its deliverables supply inputs to the MISO Planning Resource Auction (PRA). The 2020-2021 Planning Year LOLE Study: Establishes a PRM UCAP of 8.9 percent to be applied to the Load Serving Entity (LSE) coincident peaks for the planning year starting June 2020 and ending May 2021 Uses the Strategic Energy Risk Valuation Model (SERVM) software for Loss of Load analysis to provide results applicable across the MISO market footprint Provides initial zonal ZIA, ZEA, CIL and CEL for each Local Resource Zone (LRZ) (Figure 1-1). These values may be adjusted in March 2020 based on changes to MISO units with firm capacity commitments to non-MISO load, and equipment rating changes since the LOLE analysis. The Simultaneous Feasibility Test (SFT) process can further adjust CIL and CEL to assure the resources cleared in the auction are simultaneously reliable. Determines a minimum planning reserve margin that would result in the MISO system experiencing a less than one-day loss of load event every 10 years, as per the MISO Tariff.1 The MISO analysis shows that the system would achieve this reliability level when the amount of installed capacity available is 1.18 times that of the MISO system coincident peak. Sets forth initial zonal-based (Table 1-1) PRA deliverables in the LOLE charter. The stakeholder review process played an integral role in this study. The MISO staff would like to thank the Loss of Load Expectation Working Group (LOLEWG) for its help. Stakeholder advice led to revisions in LOLE results, including updated transfer limits due to improved redispatch, use of existing Op Guides, and constraint invalidation. PRA and LOLE Metrics LRZ 1 LRZ 2 LRZ 3 LRZ 4 LRZ 5 LRZ 6 LRZ 7 LRZ 8 LRZ 9 LRZ 10 PRM UCAP 8.90% 8.90% 8.90% 8.90% 8.90% 8.90% 8.90% 8.90% 8.90% 8.90% LRR UCAP per-unit of LRZ 1.142 1.168 1.150 1.292 1.240 1.149 1.195 1.330 1.164 1.459 Peak Demand Capacity Import Limit (CIL) 3,231 1,603 3,406 6,092 5,424 7,188 3,200 3,919 3,712 3,432 (MW) No No No No No Capacity Export Limit (CEL) 4,761 1,616 1,385 3,772 Limit Limit 3,771 Limit Limit Limit (MW) Found2 Found2,3 Found2,3 Found2,3 Found2 Zonal Import Ability (ZIA) 3,225 1,603 3,171 4,809 5,424 7,041 3,200 3,776 3,410 3,160 (MW) Zonal Export Ability (ZEA) 3,7783 NA2,3 NA2,3 5,0533 NA2,3 4,9076 NA2,3 NA2,3 1,918 1,6583 (MW) Table 1-1: Initial Planning Resource Auction Deliverables 1 A one-day loss of load in 10 years (0.1 day/year) is not necessarily equal to 24 hours loss of load in 10 years (2.4 hours/year). 2 “No Limit Found” reflects no valid constraint identified 3 Refer to Table 3-4 for further details 5

Figure 1-1: Local Resource Zones (LRZ)

2 LOLE Study Process Overview
In compliance with Module E-1 of the MISO Tariff, MISO performed its annual LOLE study to determine
the 2020-2021 PY MISO system unforced capacity (UCAP) Planning Reserve Margin (PRM) and the per-
unit Local Reliability Requirements (LRR) of Local Resource Zone (LRZ) Peak Demand.
In addition to the LOLE analysis, MISO performed transfer analysis to determine initial Zonal Import
Ability (ZIA), Zonal Export Ability (ZEA), Capacity Import Limits (CIL) and Capacity Export Limits (CEL).
CIL,CEL, and ZIA are used, in conjunction with the LOLE analysis results, in the Planning Resource
Auction (PRA). ZEA is informational and not used in the PRA.
The 2020-2021 per-unit LRR UCAP multiplied by the updated LRZ Peak Demand forecasts submitted for
the 2020-2021 PRA determines each LRZ’s LRR. Once the LRR is determined, the ZIA values and non-
pseudo tied exports are subtracted from the LRR to determine each LRZ’s Local Clearing Requirement
(LCR) consistent with Section 68A.62 of Module E-1. An example calculation pursuant to Section 68A.6 of
the current effective Module E-13 shows how these values are reached (Table 2-1).
The actual effective PRM Requirement (PRMR) will be determined after the updated LRZ Peak Demand
forecasts are submitted by November 1, 2019, for the 2020-2021 PRA. The ZIA, ZEA, CIL and CEL
values are subject to updates in March 2020 based on changes to exports of MISO resources to non-

2
 https://www.misoenergy.org/legal/tariff/
3
 Effective Date: October 28, 2019

 6
MISO load, changes to pseudo tied commitments, and updates to facility ratings since completion of the
LOLE.
Finally, the simultaneous feasibility test (SFT) is performed as part of the PRA to ensure reliability and is
maintained by adjusting CIL and CEL values as needed.

 Local Resource Zone (LRZ) EXAMPLE Example LRZ Formula Key
 Installed Capacity (ICAP) 17,442 [A]
 Unforced Capacity (UCAP) 16,326 [B]
 Adjustment to UCAP (1d in 10yr) 50 [C]
 Local Reliability Requirement (LRR) (UCAP) 16,376 [D]=[B]+[C]
 LRZ Peak Demand 14,270 [E]
 LRR UCAP per-unit of LRZ Peak Demand 114.8% [F]=[D]/[E]
 Zonal Import Ability (ZIA) 3,469 [G]
 Zonal Export Ability (ZEA) 2,317 [H]
 Proposed PRA (UCAP) EXAMPLE Example LRZ Formula Key
 Forecasted LRZ Peak Demand 14,270 [I]
 Forecasted LRZ Coincident Peak Demand 13,939 [J]
 Non-Pseudo Tied Exports UCAP 150 [K]
 Local Reliability Requirement (LRR) UCAP 16,376 [L]=[F]x[I]
 Local Clearing Requirement (LCR) 12,757 [M]=[L]-[G]-[K]
 Zone's System Wide PRMR 15,180 [N]=[1.089]X[J]
 PRMR 15,180 [O] = Higher of [M] or [N]
 Planning Reserve Margin (PRM) 8.9% [P]=[O]/[J]-1
 Table 2-1: Example LRZ Calculation

2.1 Future Study Improvement Considerations
In response to stakeholder feedback received through the LOLEWG, MISO modified the Generation
Limited Transfer methodology to report the Import or Export limits as “No Limit Found” if a valid constraint
does not emerge upon executing a Generation Limited Transfer. BPM-011 is being updated to reflect this
change.

Stakeholders have identified a process improvement regarding future firm imports. Currently, the LOLE
study only considers firm imports from the most recent Planning Resource Auction as outlined in section
4.4. Beginning with next year’s study MISO will begin to include known future Firm Imports as well.

3 Transfer Analysis
3.1 Calculation Methodology and Process Description
Transfer analyses determined preliminary CIL and CEL values for LRZs for the 2020-2021 Planning Year.
Adjustments are made for Border External Resources (BERs) and Coordinating Owner Resources (COs)
to determine the ZIA and ZEA. Further adjustments are made for exports to non-MISO Loads to arrive at
the initial CIL and CEL values. The objective of transfer analysis is to determine constraints caused by the

 7
transfer of capacity between zones and the associated transfer capability. Multiple factors impacted the analysis when compared to previous studies, including: Completion of MTEP transmission projects Generation retirements and commissioning of new units External system dispatch changes 3.1.1 Generation pools To determine an LRZ’s import or export limit, a transfer is modeled by ramping generation up in a source subsystem and ramping generation down in a sink subsystem. The source and sink definitions depend on the limit being tested. The LRZ studied for import limits is the sink subsystem and the adjacent MISO areas are the source subsystem. The LRZ studied for export limits is the source subsystem and the rest of MISO is the sink subsystem. Transfers can cause potential issues, which are addressed through the study assumptions. First, an abundantly large source pool spreads the impact of the transfer widely, which potentially masks constraints. Second, ramping up generation from remote areas could cause electrically distant constraints for any given LRZ, which should not determine a zone’s limit. For example, export constraints due to dispatch of LRZ 1 generation in the northwest portion of the footprint should not limit the import capability of LRZ 10, which covers the MISO portion of Mississippi. To address these potential issues, the transfer studies limit the source pool for the import studies to the areas adjacent to the study zone. Since export study subsystems are defined by the LRZ, these issues only apply to import studies. Generation within the zone studied for an export limit is ramped up and constraints are expected to be near the zone because the ramped-up generation concentrates in a particular area. 3.1.2 Redispatch Limited redispatch is applied after performing transfer analyses to mitigate constraints. Redispatch ensures constraints are not caused by the base dispatch and aligns with potential actions that can be implemented for the constraint in MISO operations. Redispatch scenarios can be designed to address multiple constraints as required and may be used for constraints that are electrically close to each other or to further optimize transfer limits for several constraints requiring only minor redispatch. The redispatch assumptions include: The use of no more than 10 conventional fuel units or wind plants Redispatch limit at 2,000 MW total (1,000 MW up and 1,000 MW down) No adjustments to nuclear units No adjustments to the portions of pseudo-tied units committed to non-MISO load 3.1.3 Generation Limited Transfer for CIL/CEL and ZIA/ZEA When conducting transfer analysis to determine import or export limits, the source subsystem might run out of generation to dispatch before identifying a constraint caused by a transmission limit. MISO developed a Generation Limited Transfer (GLT) process to identify transmission constraints in these situations, when possible, for both imports and exports. After running the First Contingency Incremental Transfer Capability (FCITC) analysis to determine limits for each LRZ, MISO will determine whether a zone is experiencing a GLT (e.g. whether the first constraint would only occur after all the generation is dispatched at its maximum amount). If the LRZ experiences a GLT, MISO will adjust the base model based on whether it is an import or export analysis and re-run the transfer analysis. 8
For an export study, when a transmission constraint has not been identified after dispatching all
generation within the exporting system (LRZ under study) MISO will decrease load and generation
dispatch in the study zone. The adjustment creates additional capacity to export from the zone. After the
adjustments are complete, MISO will rerun the transfer analysis. If a GLT reappears, MISO will make
further adjustments to the load and generation of the study zone.
For an import study, when a transmission constraint has not been identified after dispatching all
generation within the source subsystem, MISO will adjust load and generation in the source subsystem.
This increases the import capacity for the study zone. After the adjustments are complete, MISO will run
the transfer analysis again. If a GLT reappears, MISO will make further adjustments to the model’s load
and generation in the source subsystem.
FCITC could indicate the transmission system can support larger thermal transfers than would be
available based on installed generation for some zones. However, large variations in load and generation
for any zone may lead to unreliable limits and constraints. Therefore, MISO limits load scaling for both
import and export studies to 50 percent of the zone’s load. In a GLT, redispatch, or GLT plus redispatch
scenario, the FCITC of the most limiting constraint might exceed Zonal Export/Import Capability.
If the GLT does not produce a limit for a zone(s), due to a valid constraint not being identified, or due to
other considerations as listed in the prior paragraph, MISO shall report that LRZ as having no limit and
ensure that the limit will not bind in the first iteration of the Simultaneous Feasibility Test (SFT).

3.1.4 Voltage Limited Transfer for CIL/CEL and ZIA/ZEA
Zonal imports may be limited by voltage constraints due to a decrease in the generation in the zone prior
to the thermal limits determined by linear FCITC. LOLE studies may evaluate Power-Voltage curves for
LRZs with known voltage-based transfer limitations identified through prior MISO or Transmission Owner
studies. Such evaluation may also happen if an LRZ’s import reaches a level where the majority of the
zone’s load would be served using imports from resources outside of the zone. MISO will coordinate with
stakeholders as it encounters these scenarios.

3.2 Powerflow Models and Assumptions
3.2.1 Tools used
MISO used the Siemens PTI Power System Simulator for Engineering (PSS E) and Transmission
Adequacy and Reliability Assessment (TARA) as transfer analysis tools.

3.2.2 Inputs required
Thermal transfer analysis requires powerflow models and input files. MISO used contingency files from
MTEP4 reliability assessment studies. Single-element contingencies in MISO/seam areas were also
evaluated.
MISO developed a subsystem file to monitor its footprint and seam areas. LRZ definitions were
developed as sources and sinks in the study. See Appendix B for maps containing adjacent area
definitions (Tiers 1 and 2) used for this study. The monitored file includes all facilities under MISO
functional control and single elements in the seam areas of 100 kV and above.

3.2.3 Powerflow Modeling
The summer peak 2020 study model was built using MISO’s Model on Demand (MOD) model data
repository, with the following base assumptions (Table 3-1).

4
 Refer to the Transmission Planning BPM (BPM-20) for more information regarding MTEP input files.
https://www.misoenergy.org/legal/business-practice-manuals/

 9
Effective Load and Generation Scenario Projects Applied External Modeling Date Profile MTEP19 Appendix A and 2019 Series 2020 Summer 2020 6/1/2020 Summer Peak Target A ERAG MMWG Table 3-1: Model assumptions MISO excluded several types of units from the transfer analysis dispatch; these units’ base dispatch remained fixed. Nuclear dispatch does not change for any transfer Intermittent resources can be ramped down, but not up Pseudo-tied resources were modeled at their expected commitments to non-MISO load, although portions of these units committed to MISO could participate in transfer analyses System conditions such as load, dispatch, topology and interchange have an impact on transfer capability. The model was reviewed as part of the base model build for MTEP18 analyses, with study files made available on the MTEP ftp site. MISO worked closely with transmission owners and stakeholders in order to model the transmission system accurately, as well as to validate constraints and redispatch. Like other planning studies, transmission outage schedules were not included in the analysis. This is driven partly by limited availability of outage information as well as by current standard requirements. Although no outage schedules were evaluated, all single element contingencies were evaluated. This includes BES lines, transformers, and generators. Contingency coverage covers most of category P1 and some of category P2. 3.2.4 General Assumptions MISO uses TARA to process the powerflow model and associated input files to determine the import and export limits of each LRZ by determining the transfer capability. Transfer capability measures the ability of interconnected power systems to reliably transfer power from one area to another under specified system conditions. The incremental amount of power that can be transferred will be determined through FCITC analysis. FCITC analysis and base power transfers provide the information required to calculate the First Contingency Total Transfer Capability (FCTTC), which indicates the total amount of transferrable power before a constraint is identified. FCTTC is the base power transfer plus the incremental transfer capability (Equation 3-1). All published limits are based on the zone’s FCTTC and may be adjusted for capacity exports. ( ) = + Equation 3-1: Total Transfer Capability Facilities were flagged as potential constraints for loadings of 100 percent or more in two scenarios: the normal rating for system intact conditions and the emergency rating for single event contingencies. Linear FCITC analysis identifies the limiting constraints using a minimum transfer Distribution Factor (DF) cutoff of 3 percent, meaning the transfer must increase the loading on the overloaded element, under contingency conditions, by 3 percent or more. A pro-rata dispatch is used, which ensures all available generators will reach their maximum dispatch level at the same time. The pro-rata dispatch is based on the MW reserve available for each unit and the cumulative MW reserve available in the subsystem. The MW reserve is found by subtracting a unit’s base model generation dispatch from its maximum dispatch, which reflects the available capacity of the unit. Table 3-2 and Equation 3-2 show an example of how one unit’s dispatch is set, given all machine data for the source subsystem. 10
Base Minimum Reserve MW
 Maximum Unit
 Model Unit Unit (Unit Dispatch
 Machine Dispatch
 Dispatch Dispatch Max – Unit
 (MW)
 (MW) (MW) Dispatch Min)
 1 20 20 100 80
 2 50 10 150 100
 3 20 20 100 80
 4 450 0 500 50
 5 500 100 500 0
 Total Reserve 310
 Table 3-2: Example subsystem

 = ×

 80
 ℎ 1 ℎ = × 100 = 25.8
 310

 ℎ 1 ℎ = 25.8

 Equation 3-2: Machine 1 dispatch calculation for 100 MW transfer

 11
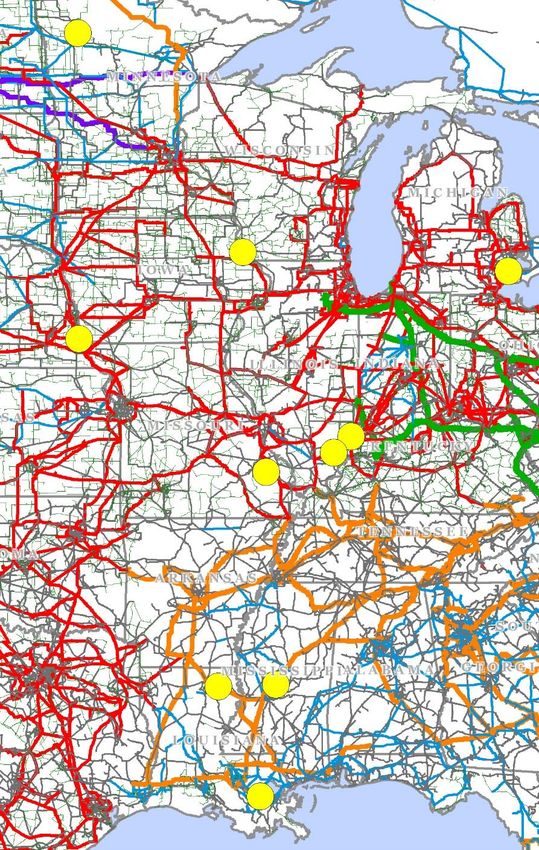
3.3 Results for CIL/CEL and ZIA/ZEA
 Constraints limiting transfers and the associated ZIA, ZEA, CIL, and CEL for each LRZ were presented
 and reviewed through the LOLEWG. Preliminary results for Planning Year 2020/21 were presented in the
 October 2019 WebEx/conference call.
 Detailed constraint and redispatch information for all limits is found in the Transfer Analysis section of this
 report. Table 3-3 presents a summary of the Planning Year 2020-21 Capacity Import Limits.

 Generation 19-20
 20-21 CIL 20-21 ZIA GLT 19-20 ZIA
LRZ Tier Monitored Element Contingent Element Redispatch CIL
 (MW)5 (MW) applied (MW)5
 (MW) (MW)5
 Plummer Pipeline 115 kV Buffalo to Jamestown
 1 N/A 3,231 3,225 No N/A 4,078 3,747
 bus voltage 345 kV

 Stoneman to Nelson Dewey North Rochester to
 2 1&2 1,603 1,603 No 284 1,713 1,713
 161 kV Briggs Road 345 kV

 Sub 3458 to Sub 3456 Sub 3455 to Sub 3740
 3 1 3,406 3,171 No 0 3,037 2,813
 345 kV 345 so I kV

 Mount Carmel 138 kV
 4 N/A 6,092 4,809 Gibson to Albion 345 kV No N/A 6,845 5,210
 bus voltage

 Heritage Gardens to Lutesville to St Francois
 5 1&2 5,424 5,424 No 1,440 5,013 5,013
 Fredericktown 161 kV 345 kV

 Norris City to Crossville
 6 1&2 7,188 7,041 Nelson to Xenia 345 kV No 1,129 7,066 6,924
 138 kV

 Praxair 120kV Wayne to Monroe
 7 N/A 3,200 3,200 No N/A 3,211 3,211
 bus voltage 345 kV

 Gypsy to Fairview RCT Michoud to Front Street
 8 1 3,919 3,776 No 2,000 4,424 4,185
 230 kV 230 kV

 Lakeover to McAdams
 9 1&2 3,712 3,410 Pickens to Canton 230 kV No 2,000 3,950 3,631
 500 kV

 Perryville to Baxter Wilson
10 1 3,432 3,160 Grand Gulf Unit 1 No 1,500 3,906 3,792
 500 kV

 Table 3-3: Planning Year 2020–2021 Import Limits

 5
 Results after applying redispatch and adjusted for exports to non-MISO load per the FERC locational filing.

 12
1

 2
 7

 3

 6
 4
 5

 10 9

 8

 Figure 3-1: Planning Year 2020-21 Import Constraint Ma

Capacity Exports Limits were found by increasing generation in the zone being studied and decreasing
generation in the rest of the MISO footprint. Table 3-4 summarizes Planning Year 2020-21 Capacity
Export Limits.

 13
20-21 20-21 Generation 19-20 19-20
LRZ CEL ZEA Monitored Element Contingent Element GLT applied Redispatch CEL ZEA
 (MW)6 (MW) (MW) (MW) (MW)
 Lakefield to Lakefield
 1 3,7727 3,778 Split Rock to White 345 kV Yes 140 3,048 3,379
 Jct 345 kV

 No Limit
 2 N/A No Constraint found No 985 979 979
 Found8
 No Limit
 3 N/A No Constraint found Yes 166 4,440 4,664
 Found9
 Brokaw to McLean Marion Plant to Marion S
 4 3,77110 5,053 Yes 0 3,693 5,332
 345 kV 161 kV
 No Limit
 5 N/A No Constraint found Yes 0 2,122 2,122
 Found11

 Cayuga to Eugene
 6 4,76112 4,907 Cayuga to Nucor 345 kV Yes 0 1,435 1,577
 345 kV

 No Limit
 7 N/A No Constraint found Yes 80 1,358 1,358
 Found13

 No Limit
 8 N/A No Constraint found No 1,010 5,089 5,328
 Found14

 White Bluff to Keo Sheridan to Mabelvale
 9 1,616 1,918 No 1,680 1,905 2,224
 500 kV 500 kV

 Batesville to
10 1,38515 1,658 Choctaw to Clay 500 kV Yes 0 1,607 1,721
 Tallahachie 161 kV

 Table 3-4: Planning Year 2020–2021 Export Limits

 6
 “No Limit Found” reflects no valid constraint identified
 7
 LRZ 1: 20% GLT Applied; Limit Found at generation limited transfer of Gen: 13686 MW / Load: 14846 MW
 8
 LRZ 2: “No Limit Found” after redispatch
 9
 LRZ 3: 25% GLT Applied; “No Limit Found” at generation limited transfer of Gen: 7884 MW / Load: 7555 MW
 10
 LRZ 4: 20% GLT Applied; Limit Found at generation limited transfer of Gen: 8742 MW / Load: 8104 MW
 11
 LRZ 5: 50% GLT Applied; “No Limit Found” at generation limited transfer of Gen: 4119 MW / Load: 4218 MW
 12
 LRZ 6: 25% GLT Applied; Limit Found at generation limited transfer of Gen: 13270 MW / Load: 13378 MW
 13
 LRZ 7: 2% GLT Applied; “No Limit Found” at generation limited transfer of Gen: 21795 MW / Load: 20572 MW
 14
 LRZ 8: “No Limit Found” after redispatch
 15
 LRZ 10: 25% GLT Applied; Limit Found at generation limited transfer of Gen: 3623 MW / Load: 3535 MW

 14
1

 4
 6

 9 10

 Figure 3-2: Planning Year 2020-21 Export Constraint Map

3.3.1 Out-Year Analysis
In 2018, MISO and its stakeholders redesigned the out-year LOLE transfer analysis process through the
LOLEWG and Resource Adequacy Subcommittee (RASC). The out-year analysis will now be performed
after the near-term analyses are complete. The out-year results will be documented outside of the LOLE
report and recorded in LOLEWG meeting materials.

 15
4 Loss of Load Expectation Analysis
4.1 LOLE Modeling Input Data and Assumptions
MISO uses a program managed by Astrapé Consulting called SERVM to calculate the LOLE for the
applicable planning year. SERVM uses a sequential Monte Carlo simulation to model a generation
system and to assess the system’s reliability based on any number of interconnected areas. SERVM
calculates the annual LOLE for the MISO system and each LRZ by stepping through the year
chronologically and taking into account generation, load, load modifying and energy efficiency resources,
equipment forced outages, planned and maintenance outages, weather and economic uncertainty, and
external support.

Building the SERVM model is the most time-consuming task of the PRM study. Many scenarios are built
in order to determine how certain variables impact the results. The base case models determine the
MISO PRM Installed Capacity (ICAP), PRM UCAP and the LRRs for each LRZ for years one, four and
six.

4.2 MISO Generation
4.2.1 Thermal Units
The 2020-2021 planning year LOLE study used the 2019 PRA converted capacity as a starting point for
which resources to include in the study. This ensured that only resources eligible as a Planning
Resources were included in the LOLE study. An exception was made for resources with a signed GIA
with an anticipated in-service date for the 2020-2021 PY. These resources were also included. All internal
Planning Resources were modeled in the LRZ in which they are physically located. Additionally,
Coordinating Owners and Border External Resources were modeled as being internal to the LRZ in which
they are committed to serving load.

Forced outage rates and planned maintenance factors were calculated over a five-year period (January
2014 to December 2018) and modeled as one value for each unit. Some units did not have five years of
historical data in MISO’s Generator Availability Data System (PowerGADS). However, if they had at least
12 consecutive months of data then unit-specific information was used to calculate their forced outage
rates and maintenance factors. Units with fewer than 12 consecutive months of unit-specific data were
assigned the corresponding MISO class average forced outage rate and planned maintenance factor
based on their fuel type. Any MISO class with fewer than 30 units were assigned the overall MISO
weighted class average forced outage rate of 9.24 percent.

Nuclear units have a fixed maintenance schedule, which was pulled from publicly available information
and was modeled for each of the study years.

The historical class average outage rates as well as the MISO fleet wide weighted average forced outage
rate are in Table 4-1.

 16
Pooled EFORd 2014-2018 2013-2017 2012-2016 2011-2015 2010-2014 2009-2013
 GADS Years (%) (%) (%) (%) (%) (%)

 LOLE Study 2020-2021 PY 2019-2020 PY 2018-2019 PY 2017-2018 PY 2016-2017 PY 2015-2016 PY
 Planning Year LOLE Study LOLE Study LOLE Study LOLE Study LOLE Study LOLE Study

Combined Cycle 5.7 5.37 4.62 3.56 3.78 3.92
 Combustion 40.39 23.18 29.02 24.2 23.58 18.39
 Turbine (0-20
 MW)
 Combustion 15.29 15.76 13.48 13.94 16.03 53.12
 Turbine (20-50
 MW)
 Combustion 4.65 5.18 6.19 5.94 5.69 5.61
Turbine (50+ MW)
 Diesel Engines 23.53 10.26 10.42 13.12 12.51 14.00
 Fluidized Bed * * * * * **
 Combustion
HYDRO (0-30MW) * * * * * **
HYDRO (30+ MW) * * * * * **
 Nuclear * * * * * **
Pumped Storage * * * * * **
Steam - Coal (0- 5.33 4.60 5.14 5.99 7.12 8.45
 100 MW)
 Steam - Coal * * * * * 6.39
 (100-200 MW)
 Steam - Coal 10.16 9.82 9.77 8.64 8.46 8.44
 (200-400 MW)
 Steam - Coal * * * * 7.04 6.99
 (400-600 MW)
 Steam - Coal * 8.22 7.90 7.42 7.58 7.36
 (600-800 MW)
 Steam - Coal * * * * * **
 (800-1000 MW)
 Steam - Gas 12.54 11.56 11.94 11.68 10.18 8.79
 Steam - Oil * * * * * **
 Steam - Waste * * * * * **
 Heat
 Steam - Wood * * * * * **
 MISO System 9.24 9.28 9.16 8.21 7.98 7.67
 Wide Weighted
 MISO Weighted 9.22 9.18 - - - -
 as seen in
 SERVM
*MISO system-wide weighted forced outage rate used in place of class data for those with
less than 30 units reporting 12 or more months of data
**Prior to 2015-2016PY the NERC class average outage rate was used for units with less
than 30 units reporting 12 or more months of data
 Table 4-1: Historical Class Average Forced Outage Rates

 17
4.2.2 Behind-the-Meter Generation
Behind-the-Meter generation data came from the Module E Capacity Tracking (MECT) tool. These
resources were explicitly modeled just as any other thermal generator with a monthly capacity and forced
outage rate. Performance data was pulled from PowerGADS.

4.2.3 Sales
The LOLE analysis incorporates firm sales to neighboring capacity markets as well as firm transactions
off system where information was available. For units with capacity sold off-system, the monthly
capacities were reduced by the megawatt amount sold. This totaled 2,565 MW UCAP for Planning Year
2020-2021. See Section 4.4 for a more detailed breakdown. These values came from PJM’s Reliability
Pricing Model (RPM) as well as exports to other external areas taken from the Independent Market
Monitor (IMM) exclusion list.

4.2.4 Attachment Y
For the 2020-2021 planning year, generating units with approved suspensions or retirements (as of June
1, 2019) through MISO’s Attachment Y process were removed from the LOLE analysis. Any unit retiring,
suspending, or coming back online at any point during the planning year was excluded from the year-one
analysis. This same methodology is used for the four- and six-year analyses.

4.2.5 Future Generation
Future thermal generation and upgrades were added to the LOLE model based on unit information in the
MISO Generator Interconnection Queue. The LOLE model included units with a signed interconnection
agreement (as of June 1, 2019). These new units were assigned class-average forced outage rates and
planned maintenance factors based on their particular unit class. Units upgraded during the study period
reflect the megawatt increase for each month, beginning the month the upgrade was finished. The LOLE
analysis also included future wind and solar generation at the MISO capacity accreditation amount (wind
at 15.7 percent and solar at 50 percent). Going forward, MISO will also include any future contracts for
firm imports in the LOLE analysis.

4.2.6 Intermittent Resources
Intermittent resources such as run-of-river hydro, biomass and wind were explicitly modeled as demand-
side resources. Non-wind intermittent resources, such as run-of-river hydro and biomass, provide MISO
with up to 15 years of historical summer output data for the hours ending 15:00 EST through 17:00 EST.
This data is averaged and modeled in the LOLE analysis as UCAP for all months. Each individual unit is
modeled and put in the corresponding LRZ.

Each wind-generator Commercial Pricing Node (CPNode) received a capacity credit based on its
historical output from MISO’s top eight peak days in each of the past years for which data were available.
The megawatt value corresponding to each CPNode’s wind capacity credit was used for each month of
the year. Units new to the commercial model without a wind capacity credit as part of the 2019 Wind
Capacity Credit analysis received the MISO-wide wind capacity credit of 15.7 percent as established by
the 2019 Wind Capacity Credit Effective Load Carrying Capability (ELCC) study. The capacity credit
established by the ELCC analysis determines the maximum percent of the wind unit that can receive
credit in the PRA while the actual amount could be less due to other factors such as transmission
limitations. Each wind CPNode receives its actual wind capacity credit based on the capacity eligible to
participate in the PRA. Only Network Resource Interconnection Service or Energy Resource
Interconnection Service with firm point-to-point is considered an eligible capacity resource. The final value
from the 2019 PRA for each wind unit was modeled at a flat capacity profile for the planning year. The
detailed methodology for establishing the MISO-wide and individual CPNode Wind Capacity Credits can
be found in the 2019 Wind Capacity Credit Report.

 18
4.2.7 Demand Response
Demand response data came from the MECT tool. These resources were explicitly modeled as dispatch-
limited resources. Each demand response program was modeled individually with a monthly capacity,
limited to the number of times each program can be called upon, and limited by duration.

4.3 MISO Load Data
The 2020-2021 LOLE analysis used a load training process with neural net software to create a neural-
net relationship between historical weather and load data. This relationship was then applied to 30 years
of hourly historical weather data to create 30 different load shapes for each LRZ in order to capture both
load diversity and seasonal variations. The average monthly loads of the predicted load shapes were
adjusted to match each LRZ’s Module E 50/50 monthly zonal peak load forecasts for each study year.
The results of this process are shown as the MISO System Peak Demand (Table 5-1) and LRZ Peak
Demands (Table 6-1).

Direct Control Load Management and Interruptible Demand types of demand response were explicitly
included in the LOLE model as resources. These demand resources are implemented in the LOLE
simulation before accumulating LOLE or shedding of firm load.

4.3.1 Weather Uncertainty
MISO has adopted a six-step load training process in order to capture the weather uncertainty associated
with the 50/50 load forecasts. The first step of this process requires the collection of five years of
historical real-time load modifying resource (LMR) performance and load data, as well as the collection of
30 years of historical weather data. Both the LMR and load data are taken from the MISO market for each
LBA, while the historical weather data is collected from the National Oceanic and Atmospheric
Administration (NOAA) for each LRZ. After collecting the data the hourly gross load for each LRZ is
calculated using the five years of historical data.

The second step of the process is to normalize the five years of load data to consistent economics. With
the load growth due to economics removed from 5 years of historical LRZ load, the third step of the
process utilizes neural network software to establish functional relationships between the five years of
historical weather and load data. In the fourth step of the process the neural network relationships are
applied to the 30 years of historical weather data in order to predict/create 30 years’ worth of load shapes
for each LRZ.

In the fifth step of the load training process, MISO undertakes extreme temperature verification on the 30
years of load shapes to ensure that the hourly load data is accurate at extremely hot or cold
temperatures. This is required since there are fewer data points available at the temperature extremes
when determining the neural network functional relationships. This lack of data at the extremes can result
in inaccurate predictions when creating load shapes, which will need to be corrected before moving
forward.

The sixth and final step of the load training process is to average the monthly peak loads of the predicted
load shapes and adjust them to match each LRZ’s Module E 50/50 monthly zonal peak load forecasts for
each study year. In order to calculate this adjustment, the ratio of the first year’s non-coincident peak
forecast to the zonal coincident peak forecast is applied to future year’s non-coincident peak forecast.

By adopting this new methodology for capturing weather uncertainty MISO is able to model multiple load
shapes based off a functional relationship with weather. This modeling approach provides a variance in
load shapes, as well as the peak loads observed in each load shape. This approach also provides the
ability to capture the frequency and duration of severe weather patterns.

 19
4.3.2 Economic Load Uncertainty
To account for economic load uncertainty in the 2020-2021 planning year LOLE model MISO utilized a
normal distribution of electric utility forecast error accounting for projected and actual Gross Domestic
Product (GDP), as well as electricity usage. The historic projections for GDP growth were taken from the
Congressional Budget Office (CBO), the actual GDP growth was taken from the Bureau of Economic
Analysis (BEA), and the electric use was taken from the U.S. Energy Information Administration (EIA).
Due to lack of statewide projected GDP data MISO relied on United States aggregate level data when
calculating the economic uncertainty.

In order to calculate the electric utility forecast error, MISO first calculated the forecast error of GDP
between the projected and actual values. The resulting GDP forecast error was then translated into
electric utility forecast error by multiply by the rate at which electric load grows in comparison to the GDP.
Finally, a standard deviation is calculated from the electric utility forecast error and used to create a
normal distribution representing the probabilities of the load forecast errors (LFE) as shown in Table 4-2.

 LFE Levels

 -2.0% -1.0% 0.0% 1.0% 2.0%

 Standard Deviation in LFE Probability assigned to each LFE
 0.95% 5.7% 24.2% 40.1% 24.2% 5.7%
 Table 4-2: Economic Uncertainty

As a result of stakeholder feedback MISO is exploring possible alternative methods for determining
economic uncertainty to be used in the LOLE process.

4.4 External System
Within the LOLE study, a 1 MW increase of non-firm support from external areas leads to a 1 MW
decrease in the reserve margin calculation. It is important to account for the benefit of being part of the
eastern interconnection while also providing a stable result. Historically, MISO modeled the external
system, including non-firm imports, in the LOLE study which resulted in year-over-year volatility in the
PRM. In order to provide a more stable result and remove the false sense of precision, the external non-
firm support was set at an ICAP of 2,987 MW and a UCAP of 2,331 MW.

Firm imports from external areas to MISO are modeled at the individual unit level. The specific external
units were modeled with their specific installed capacity amount and their corresponding Equivalent
Forced Outage Rate demand (EFORd). This better captures the probabilistic reliability impact of firm
external imports. These units are only modeled within the MISO PRM analysis and are not modeled when
calculating the LRZ LRRs. Due to the locational Tariff filing, Border and Coordinating Owners External
Resources are no longer considered firm imports. Instead, these resources are modeled as internal MISO
units and are included in the PRM and LRR analysis. The external resources to include for firm imports
were based on the amount offered into the 2019-20 planning year PRA. This is a historically accurate
indicator of future imports. For 2019-20 planning year this amount was 1,626 MW ICAP.
Firm exports from MISO to external areas were modeled the same as previous years. As stated in
Section 4.2.3, capacity ineligible as MISO capacity due to transactions with external areas is removed
from the model. Table 4-3 shows the amount of firm imports and exports in this year’s study.

 20
Contracts ICAP (MW) UCAP (MW)
 Imports (MW) 1,626 1,572
 Exports (MW) 2,798 2,565
 Net -1,172 -993
 Table 4-3: 2019 Planning Year Firm Imports and Exports

4.5 Loss of Load Expectation Analysis and Metric Calculations
Upon completion of the SERVM database, MISO determined the appropriate PRM ICAP and PRM UCAP
for the 2020-2021 planning year as well as the appropriate Local Reliability Requirement for each of the
10 LRZ’s. These metrics were determined by a probabilistic LOLE analysis such that the LOLE for the
planning year was one day in 10 years, or 0.1 day per year.

4.5.1 MISO-Wide LOLE Analysis and PRM Calculation
For the MISO-wide analysis, generating units were modeled as part of their appropriate LRZ as a subset
of a larger MISO pool. The MISO system was modeled with no internal transmission limitations. In order
to meet the reliability criteria of 0.1 day per year LOLE, capacity is either added or removed from the
MISO pool. The minimum amount of capacity above the 50/50 net internal MISO Coincident Peak
Demand required to meet the reliability criteria was used to establish the PRM values.

The minimum PRM requirement is determined using the LOLE analysis by either adding or removing
capacity until the LOLE reaches 0.1 day per year. If the LOLE is less than 0.1 day per year, a perfect
negative unit with zero forced outage rate is added until the LOLE reaches 0.1 day per year. The perfect
negative unit adjustment is akin to adding load to the model. If the LOLE is greater than 0.1 day per year,
proxy units based on a unit of typical size and forced outage rate will be added to the model until the
LOLE reaches 0.1 day per year.

For the 2020-2021 planning year, the MISO PRM analysis removed capacity (7,950 MW) using the
perfect unit adjustment.

The formulas for the PRM values for the MISO system are:

 PRM ICAP = ((Installed Capacity + Firm External Support ICAP + ICAP Adjustment to meet a
 LOLE of 0.1 days per year) – MISO Coincident Peak Demand)/MISO Coincident Peak
 Demand
 PRM UCAP = (Unforced Capacity + Firm External Support UCAP + UCAP Adjustment to meet a
 LOLE of 0.1 days per year) – MISO Coincident Peak Demand)/MISO Coincident Peak
 Demand
 Where Unforced Capacity (UCAP) = Installed Capacity (ICAP) x (1 – XEFORd)

4.5.2 LRZ LOLE Analysis and Local Reliability Requirement Calculation
For the LRZ analysis, each LRZ included only the generating units within the LRZ (including Coordinating
Owners and Border External Resources) and was modeled without consideration of the benefit of the
LRZ’s import capability. Much like the MISO analysis, unforced capacity is either added or removed in
each LRZ such that a LOLE of 0.1 day per year is achieved. The minimum amount of unforced capacity
above each LRZ’s Peak Demand that was required to meet the reliability criteria was used to establish
each LRZ’s LRR.

 21
The 2020-2021 LRR is determined using the LOLE analysis by either adding or removing capacity until
the LOLE reaches 0.1 day per year for the LRZ. If the LOLE is less than 0.1 day per year, a perfect
negative unit with zero forced outage rate will be added until the LOLE reaches 0.1 day per year. If the
LOLE is greater than 0.1 day per year, proxy units based on a unit of typical size and forced outage rate
will be added to the model until the LOLE reaches 0.1 day per year.

For the 2020-2021 planning year, only LRZ-3, LRZ-4, and LRZ-8 had sufficient capacity, internal to the
LRZ to achieve the LOLE of 0.1 day per year as an island. In the seven zones without sufficient capacity
as an island, proxy units of typical size (160 MW) and class-average EFORd (4.65 percent) were added
to the LRZ. When needed, a fraction of the final proxy unit was added to achieve the exact LOLE of 0.1
day per year for the LRZ.

5 MISO System Planning Reserve Margin Results
5.1 Planning Year 2020-2021 MISO Planning Reserve Margin Results
For the 2020-2021 planning year, the ratio of MISO capacity to forecasted MISO system peak demand
yielded a planning ICAP reserve margin of 18.0 percent and a planning UCAP reserve margin of 8.9
percent. These PRM values assume 1,572 MW UCAP of firm and 2,331 MW UCAP of non-firm external
support. Numerous values and calculations went into determining the MISO system PRM ICAP and PRM
UCAP (Table 5-1).

 2020/2021 PY
 MISO Planning Reserve Margin (PRM) (June 2020 - May Formula Key
 2021)
 MISO System Peak Demand (MW) 124,625 [A]
 Installed Capacity (ICAP) (MW) 156,426 [B]
 Unforced Capacity (UCAP) (MW) 144,456 [C]
 Firm External Support (ICAP) (MW) 1,626 [D]
 Firm External Support (UCAP) (MW) 1,572 [E]
 Adjustment to ICAP {1d in 10yr} (MW) -7,950 [F]
 Adjustment to UCAP {1d in 10yr} (MW) -7,950 [G]
 Non-Firm External Support (ICAP) (MW) 2,987 [H]
 Non-Firm External Support (UCAP) (MW) 2,331 [I]
 ICAP PRM Requirement (PRMR) (MW) 147,115 [J]=[B]+[D]+[F]-[H]
 UCAP PRM Requirement (PRMR) (MW) 135,748 [K]=[C]+[E]+[G]-[I]
 MISO PRM ICAP 18.0% [L]=([J]-[A])/[A]
 MISO PRM UCAP 8.9% [M]=([K]-[A])/[A]
 Table 5-1: Planning Year 2020-2021 MISO System Planning Reserve Margins

5.1.1 LOLE Results Statistics
In addition to the LOLE results SERVM has the ability to calculate several other probabilistic metrics
(Table 5-2). These values are given when MISO is at its PRM UCAP of 8.9 percent. The LOLE of 0.1
day/year is what the model is driven to and how the PRM is calculated. The loss of load hours is defined
as the number of hours during a given time period where system demand will exceed the generating

 22
capacity during a given period. Expected Unserved Energy (EUE) is energy-centric and analyzes all hours of a particular planning year. Results are calculated in megawatt-hours (MWh). EUE is the summation of the expected number of MWh of load that will not be served in a given planning year as a result of demand exceeding the available capacity across all hours. MISO LOLE Statistics Loss of Load Expectation - LOLE [Days/Yr] 0.100 Loss of Load Hours - LOLH [hrs/yr] .309 Expected Unserved Energy - EUE [MWh/yr] 797.5 Table 5-2: MISO Probabilistic Model Statistics 5.2 Comparison of PRM Targets Across 10 Years Figure 5-1 compares the PRM UCAP values over the last 10 planning years. The last endpoint of the blue line shows the Planning Year 2020-2021 PRM value. Comparison of Recent Module E PRM Targets 10% 8.8% 8.8% 8.9% 9% 7.8% Planning Reserve Margin 8% 7.6% 7.1% 8.4% 7.9% 7% 7.3% 6% 6.2% 5% 4% 3% 2% 1% 0% 2011 2012 2013 2014 2015 2016 2017 2018 2019 2020 Planning Year Unforced Capacity Planning Reserve Margin Figure 5-1: Comparison of PRM targets across ten years 5.3 Future Years 2020 through 2029 Planning Reserve Margins Beyond the planning year 2020-2021 LOLE study analysis, an LOLE analysis was performed for the four- year-out planning year of 2023-2024, and the six-year-out planning year of 2025-2026. Table 5-3 shows all the values and calculations that went into determining the MISO system PRM ICAP and PRM UCAP values for those years. Those results are shown as the underlined values of Table 5-4. The values from the intervening years result from interpolating the 2020, 2023, and 2025 results. Note that the MISO system PRM results assume no limitations on transfers within MISO. 23
The 2023-2024 planning year PRM decreased slightly from the 2020-2021 planning year driven mainly by
new unit additions and retirements. The forecasts for the 2025-2026 Planning Year PRM increased
primarily because of additional new units and retirements.

 2023/2024 PY 2025/2026 PY
 MISO Planning Reserve Margin (PRM) (June 2023 - May (June 2025 - May Formula Key
 2024) 2026)
 MISO System Peak Demand (MW) 125,308 125,600 [A]
 Installed Capacity (ICAP) (MW) 160,125 161,228 [B]
 Unforced Capacity (UCAP) (MW) 148,152 148,922 [C]
 Firm External Support (ICAP) (MW) 1,626 1,626 [D]
 Firm External Support (UCAP) (MW) 1,572 1,572 [E]
 Adjustment to ICAP {1d in 10yr} (MW) -11,000 -11,360 [F]
 Adjustment to UCAP {1d in 10yr} (MW) -11,000 -11,360 [G]
 Non-Firm External Support (ICAP) (MW) 2,987 2,987 [H]
 Non-Firm External Support (UCAP) (MW) 2,331 2,331 [I]
 ICAP PRM Requirement (PRMR) (MW) 147,764 148,507 [J]=[B]+[D]+[F]-[H]
 UCAP PRM Requirement (PRMR) (MW) 136,393 136,804 [K]=[C]+[E]+[G]-[I]
 MISO PRM ICAP 17.9% 18.2% [L]=([J]-[A])/[A]
 MISO PRM UCAP 8.8% 8.9% [M]=([K]-[A])/[A]
 Table 5-3: Future Planning Year MISO System Planning Reserve Margins

 Metric 2020 2021 2022 2023 2024 2025 2026 2027 2028 2029
 ICAP
 (GW) 158.1 161.4 161.6 161.8 161.8 162.9 162.9 162.9 162.9 162.9
 Demand
 (GW) 124.6 124.8 125.1 125.3 125.3 125.6 125.8 126.0 126.2 126.5
 PRM ICAP 18.0% 18.0% 17.9% 17.9% 18.2% 18.2% 18.1% 18.2% 18.2% 18.3%
 PRM UCAP 8.9% 8.9% 8.8 % 8.8% 8.8% 8.9% 8.9% 8.9% 8.9% 8.9%
 Table 5-4: MISO System Planning Reserve Margins 2020 through 2029
 (Years without underlined results indicate PRM values that were calculated through interpolation)

6 Local Resource Zone Analysis – LRR Results
6.1 Planning Year 2020-2021 Local Resource Zone Analysis
MISO calculated the per-unit LRR of LRZ Peak Demand for years one, four and six (Table 6-1, Table 6-2,
and Table 6-3). The UCAP values in Table 6-1 reflect the UCAP within each LRZ, including Border
External Resources and Coordinating Owners. The adjustment to UCAP values are the megawatt
adjustments needed in each LRZ so that the reliability criterion of 0.1 days per year LOLE is met. The
LRR is the summation of the UCAP and adjustment to UCAP megawatts. The LRR is then divided by
each LRZ’s Peak Demand to determine the per-unit LRR UCAP. The 2020-2021 per unit LRR UCAP
values will be multiplied by the updated demand forecasts submitted for the 2020-2021 PRA to determine
each LRZ’s LRR. The zonal peak demand timestamps for all 30 weather years modeled in SERVM is
shown in table 6-4. These peak demand timestamps are the result of the SERVM load training process
and are not necessarily the actual peaks for each year.

 24
LRZ-1 LRZ-2 LRZ-3 LRZ-4 LRZ-5 LRZ-6 LRZ-7 LRZ-8 LRZ-9 LRZ-10
Local Resource Zone (LRZ) Formula Key
MN/ND WI IA IL MO IN MI AR LA/TX MS
2020-2021 Planning Reserve Margin (PRM) Study
Installed Capacity (ICAP) (MW) 21,442 15,112 11,957 13,387 8,735 19,249 24,158 11,616 25,248 5,536 [A]
Unforced Capacity (UCAP) (MW) 20,332 14,252 11,371 12,128 7,860 17,846 22,111 10,876 23,091 4,600 [B]
Adjustment to UCAP {1d in 10yr} (MW) 19 610 -380 -260 1,847 2,356 3,258 -655 1,227 2,218 [C]
LRR (UCAP) (MW) 20,352 14,862 10,991 11,868 9,707 20,202 25,370 10,221 24,318 6,818 [D]=[B]+[C]
Peak Demand (MW) 17,815 12,728 9,558 9,185 7,830 17,585 21,226 7,685 20,885 4,673 [E]
LRR UCAP per-unit of LRZ Peak Demand 114.2% 116.8% 115.0% 129.2% 124.0% 114.9% 119.5% 133.0% 116.4% 145.9% [F]=[D]/[E]
Table 6-1: Planning Year 2020-2021 LRZ Local Reliability Requirements
LRZ-1 LRZ-2 LRZ-3 LRZ-4 LRZ-5 LRZ-6 LRZ-7 LRZ-8 LRZ-9 LRZ-10
Local Resource Zone (LRZ) Formula Key
MN/ND WI IA IL MO IN MI AR LA/TX MS
2023-2024 Planning Reserve Margin (PRM) Study
Installed Capacity (ICAP) (MW) 21,992 15,256 12,198 13,681 8,791 20,136 23,509 11,766 27,019 5,793 [A]
Unforced Capacity (UCAP) (MW) 20,854 14,392 11,612 12,372 7,878 18,694 21,757 11,026 24,783 4,794 [B]
Adjustment to UCAP {1d in 10yr} (MW) 181 467 -450 -285 1,774 1,688 3,204 -680 -95 2,241 [C]
LRR (UCAP) (MW) 21,036 14,859 11,162 12,087 9,652 20,381 24,961 10,346 24,688 7,035 [D]=[B]+[C]
Peak Demand (MW) 18,472 12,726 9,755 8,926 7,767 17,721 20,931 7,838 21,030 4,749 [E]
LRR UCAP per-unit of LRZ Peak Demand 113.9% 116.8% 114.4% 135.4% 124.3% 115.0% 119.3% 132.0% 117.4% 148.1% [F]=[D]/[E]
Table 6-2: Planning Year 2023-2024 LRZ Local Reliability Requirements
25You can also read