Ways of incorporating active learning experiences: an exploration of worksheets over five years in a first year Thai physics courses - IOPscience
←
→
Page content transcription
If your browser does not render page correctly, please read the page content below
European Journal of Physics

PAPER • OPEN ACCESS

Ways of incorporating active learning experiences: an exploration of
worksheets over five years in a first year Thai physics courses
To cite this article: A Eambaipreuk et al 2021 Eur. J. Phys. 42 035703

View the article online for updates and enhancements.

                               This content was downloaded from IP address 46.4.80.155 on 28/05/2021 at 06:19
European Journal of Physics
Eur. J. Phys. 42 (2021) 035703 (17pp)                                        https://doi.org/10.1088/1361-6404/abcdde

Ways of incorporating active learning
experiences: an exploration of worksheets
over five years in a first year Thai physics
courses
                    A Eambaipreuk1,∗ , K Arayathanitkul1 , N Emarat1
                    and M D Sharma2
                    1
                      Department of Physics, Faculty of Science, Mahidol University, Bangkok 10400,
                    Thailand
                    2
                      SUPER, School of Physics, The University of Sydney, NSW 2006, Australia

                    E-mail: eam.arunee@gmail.com

                    Received 22 April 2020, revised 19 October 2020
                    Accepted for publication 25 November 2020
                    Published 1 March 2021

                    Abstract
                    It has been established that the incorporation of active learning experiences in
                    the context of university lectures increases overall student learning. This study
                    contributes to the literature by examining iterations of incorporating interactiv-
                    ity where the ‘intensity’, in terms of the content, structure and time spent on
                    different in-class activities is varied. The study described in this paper deals
                    in some depth with the use of worksheets during lectures on the topic of cir-
                    cular motion. The study was done with a total of 1405 students studying first-
                    year physics over five years at Mahidol University, Thailand. Over these years,
                    the style of the worksheets as well as the in-class activities were modified. In
                    the first year, the worksheet contained a subsection for note taking as well as
                    problem-solving practice; in the second year, a problem-solving strategy was
                    introduced; in the third year, a lecture demonstration with associated free-body
                    diagrams was included; in the final two years, these diagrams were modified.
                    There was a statistically significant difference between student performance on
                    an examination question of circular motion between the first-year cohort and
                    the cohorts of later years. However, the results for later years indicate a sat-
                    uration of mean scores. This saturation level needs to be further investigated
                    under different topics, with different cohorts and with different types of active
                    learning.

∗
    Author to whom any correspondence should be addressed.
                    Original content from this work may be used under the terms of the Creative Commons
                    Attribution 4.0 licence. Any further distribution of this work must maintain attribution
                    to the author(s) and the title of the work, journal citation and DOI.

0143-0807/21/035703+17$33.00 © 2021 European Physical Society   Printed in the UK                                   1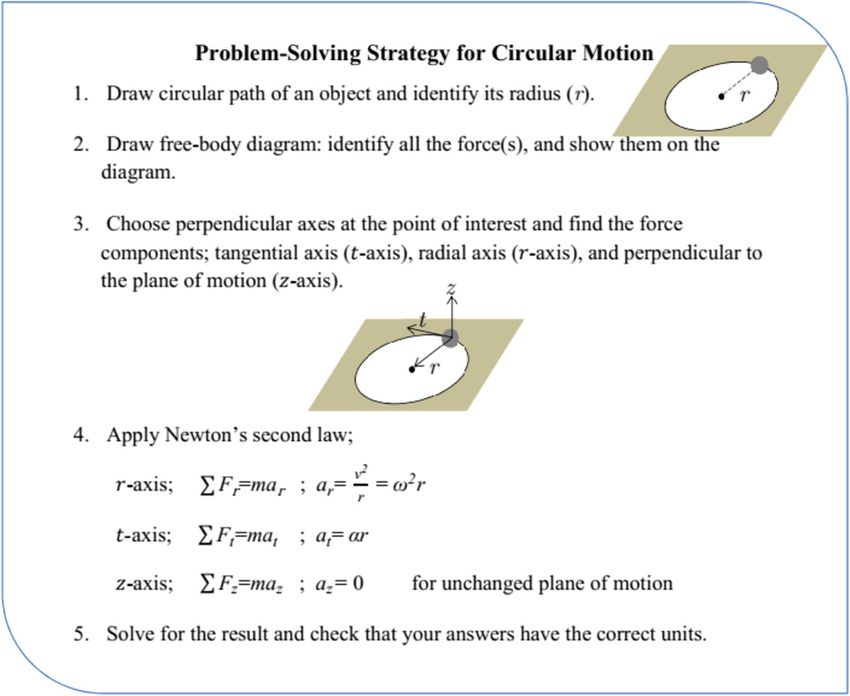
Eur. J. Phys. 42 (2021) 035703                                                     A Eambaipreuk et al

                  Keywords: active learning, free-body diagrams, Newton’s second law, problem-
                  solving strategy, worksheets, note taking, circular motion

                  (Some figures may appear in colour only in the online journal)

1. Introduction

Two decades of effort has established the efficacy of active learning experiences in assisting
student learning (Hake 1998, Tanahoung et al 2009, Wieman 2014), with calls to investigate
different types of active learning and the intensity of that learning (Freeman et al 2014). How-
ever, to our knowledge, to date, the response to Freeman’s call has been minimal, if any. We
seek to address this gap in the literature. Particular ‘types’ of active learning, from online
polling to just-in-time, can be selected to capture the students’ attention, leading them to ‘think
and apply’, ‘hands-on and minds-on’, both conceptually and in problem solving (Redish 1994,
Hake 1998, Novak et al 1999, Wutchana and Emarat 2011). A popular, low-cost and relatively
easy to implement way of facilitating active learning is the worksheet (Biehler and Snowman
1986, Mihas and Gemousakakis 2007, Konrad et al 2009); the worksheet is the subject of this
study.
    Active learning can differ in content, structure and time spent on different in-class activities;
this is what Freeman et al (2014) described as the ‘intensity’ of the active learning. Often there
is significant variation in intensity. At one extreme, we have note taking in lectures. Research
for around half a century has shown that the act of taking notes requires specific cognitive
processing. Thus, taking notes is better for learning than simply having notes (Carter and Van
Matre 1975). More recently, Mueller and Oppenheimer (2014) have shown that longhand note
taking is better for learning than laptop note taking. Three specific cognitive processes are
important: transcription fluency, verbal working memory and identifying main ideas. Of these,
transcription fluency is a significant predictor of test performance (Peverly et al 2007). Note
taking is inherently an individual activity, but note taking can sharpen cognitive processes
with the potential to influence performance. Using strategies that require behavioral, social
and emotional engagement (Sinatra et al 2015), note taking can enter the realm of active learn-
ing, albeit of low intensity. In particular, the lecturer can introduce a level of interactivity and
make use of peer discussions to identify main ideas on a worksheet where note taking occurs.
Collaborative note taking modifies the in-class activities and the development of the student’s
transcription fluency is facilitated. Note taking is still scaffolding students through steps of
the process via the worksheet, but it is done in a free-flowing discursive manner with peer and
whole-class discussions interspersed with questions and summaries by the lecturer (Mayo et al
2009, Narjaikaew et al 2009, Wutchana and Emarat 2011).
    The content and structure of the lecture can be modified to provide class time to focus on
student understanding or on problem solving by using strategies such as polling, think-pair-
share and predict-observe-explain demonstrations, invoking ‘hands-on and minds-on’ learning
(Sokoloff and Thornton 1997, Sharma et al 2005, Wattanakasiwich et al 2012, Georgiou and
Sharma 2014). In all of these endeavors, worksheets are constructed and used to optimize
student learning and performance (Duit 2000, Duit et al 2012, Sujarittham et al 2016). The
creation of in-class activities and crafting how to facilitate active learning using worksheets
normally takes several iterations and can become an ongoing process.
    A pair of lecturers at Mahidol University in Thailand have been using worksheets for over
ten years to facilitate active learning in their large lecture groups of first-year students studying
physics. Those worksheets were collaboratively prepared in the pursuit of improving student

                                                 2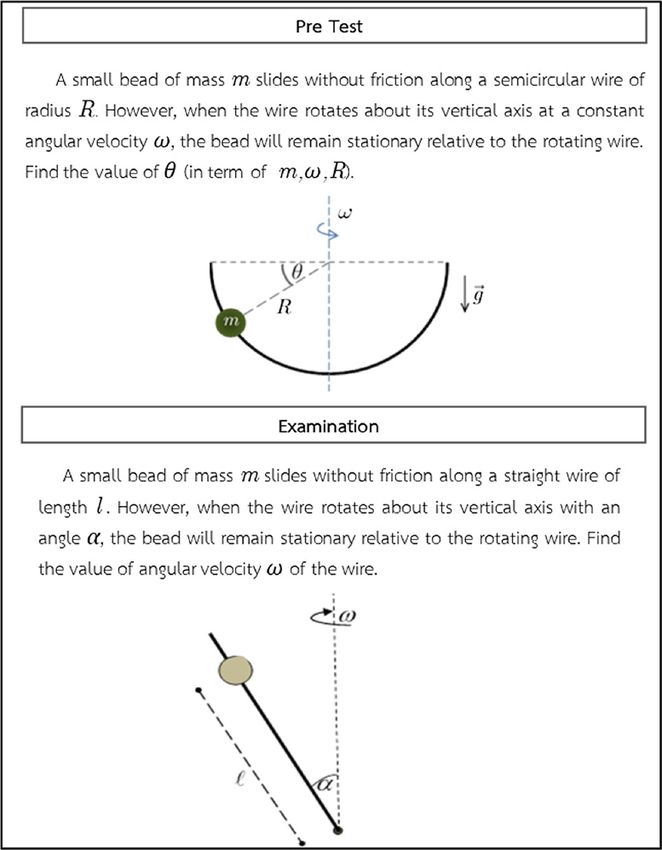
Eur. J. Phys. 42 (2021) 035703                                                     A Eambaipreuk et al

understanding and engagement. The story of this pair of lecturers purposefully collaborating
is in itself an uncommon occurrence, not often articulated in the literature. Such collaborations
are found to be important and often underpin sustained improvements in teaching and learning
(Sharma and Georgiou 2017, Sharma et al 2017). This paper presents the story of how the pair’s
use of worksheets and in-class activities to facilitate active learning on the topic of circular
motion amongst science students evolved over five years. In all versions of the worksheets,
note taking was retained as a distinct subsection. We provide an in-depth description of the
changes over five years in content, structure and time spent on aspects of in-class activities
(intensity) facilitated by worksheets and an investigation to see if those changes in intensity
made a difference in student performance in various tests.

2. Method

2.1. Context—course, lecture style and sample

Our research, to date, affirms the efficacy of worksheets for facilitating active learning and
improving students’ learning (Narjaikaew et al 2009, Wutchana and Emarat 2011, Sujarittham
et al 2016). This study is a description of one particular venture documenting ‘the ways of
incorporating active learning experiences’ and seeking to shed light on the question, ‘how
much is enough?’. The course is an introductory calculus-based physics course that covers
mechanics, thermodynamics, waves and optics in the first semester. The course uses a textbook
written by the lecturers (Emarat et al 2012) as well as other suggested textbooks available in the
library. The course is lecture based with regular homework. There are no tutorials or recitation
sessions. Another parallel but different course covers the laboratory component.
    The pair has developed an interactive team-teaching style, where each has a specific role.
One stays at the front of the class, maintaining oversight, keeping track, ensuring important
ideas are covered, directing the class to write on their worksheet and writing on transparen-
cies as needed. The other lecturer walks up and down the aisle, interacting with the students,
providing explanations when asked by individual students or groups of students, prompting
students to talk to each other and involving students in whole class discussions. At times,
they have a conversation with each other across the lecture hall on key ideas, including com-
mon inconsistent ideas. Together, they orchestrate the whole class, focusing on asking ques-
tions, guiding discussions, collaboratively identifying main ideas and engaging students in
transcribing.
    Worksheets are handed out with the expectation that students will write ideas, concepts,
equations and attempt questions on the worksheet. In essence, the worksheets require students
to solve simple problems on their own, then compare and discuss their answers with their
peers and, under the guidance of the lecturers, modify them as needed. With more difficult
problems, students would discuss them with their peers first or sometimes solve the problems
collaboratively. With some problems, the lecturer at the front would show the whole class how
to solve the problem. Consistently, students were encouraged not to delete their own solutions,
but to keep alternative solutions so they could compare them when revising. Every so often,
they would collaborate or check-in their transcriptions with their peers.
    This study is the story of this pair of lecturers, using their style of interactive teaching with
worksheets to facilitate active learning over five years on the topic of circular motion, the fourth
lecture of their particular Mechanics course. The numbers of students enrolled in the science
program, from year 1 to year 5, respectively, were 287, 273, 287, 270 and 288.

                                                 3
Eur. J. Phys. 42 (2021) 035703 A Eambaipreuk et al
2.2. Pre-test, post-test, examination question, scoring and analysis
The measurement instruments in exploratory studies such as these need to serve the purpose
of identifying trends. Our aim was to probe student performance when the style of lectures on
the topic of circular motion was varied. We focused on students’ understanding and how their
understanding was utilized in solving problems. The research was based on the data provided
by the students in their answers to a pre-test, post-test and to a question in their examination.
The same tests and processes were used each year: a 10 min supervised pre-test before the
lecture, a post-test at the beginning of the next lecture and an examination question on the
topic. All tests were taken individually by each student in a hall, with several staff supervising.
The pre-test and post-test had the same question, shown in appendix A. A similar question,
also shown in appendix A, was used in the examination. The tests and examinations were
administered and collected. They were not released, so students in following years did not
have prior access to them.
Scoring of the pre-test, post-test and examination question occurred as follows:
0 = no answer provided or the answer does not relate to the question.
1 = concepts and/or variables relevant to the question are listed, but no attempt is made to
answer the question.
2 = concepts relevant to the question are used in attempting to answer the question, but not
applied consistently in solving the problem.
3 = concepts and variables relevant to the question are used in attempting to answer the
question and the process is predominantly correct, perhaps with simple slips or errors.
A mark of 1 was added to any of the above for a correctly drawn free-body diagram. Hence, a
total of 4 was possible by satisfying the third criterion and drawing a correct free-body diagram.
The mean scores of the pre-test, post-test and examination question were compared for
the five years. First, the data were perused to identify instances of incomplete or ‘obviously
silly’ responses. None were found and all data were retained. Second, graphs with standard
errors of the mean marked as ‘error bars’ were plotted. Third, the data were checked to see
which assumptions of the various statistical approaches could be satisfied, informing which
statistical test to conduct. Levene’s test for homogeneity of variance showed that at p = 0.01
the assumption of equal variances was satisfied for only the scores on the examination ques-
tion. Hence, one-way Welch’s ANOVA was conducted for pre-test and post-test and one-way
ANOVA for examination scores. Finally, the Bonferroni correction, regarded as a conservative
test to avoid false positives, was used when undertaking multiple comparisons of means.
3. Changes in ‘intensity’ over the five years
First, the science content of circular motion was examined to probe what was being taught.
Textbooks were surveyed and analyzed (Hewitt 2002, Giambattista et al 2006, Knight 2008)
to extract what content should be presented. The lecturers’ notes were analyzed to complement
the analysis of the textbooks. It was decided that the essential content was as follows:
• the identification of circular motion,
• variables such as Δθ, r, s, ω and v,
• acceleration and Newton’s laws—problem solving in uniform and non-uniform circular
motion.
This content was kept consistent over the five years of study.
Second, research on teaching and learning in this field was examined to probe evidence-
based approaches for the topic of circular motion. The literature points to the use of free-body
4Eur. J. Phys. 42 (2021) 035703 A Eambaipreuk et al
diagrams and representations such as graphs, diagrams and mathematical equations (e.g. Court
1999, Roberts et al 2008, Hill et al 2014). The research on circular motion showed that free-
body diagrams could help interpret the situation in terms of mathematical equations (Sherwood
1971, Berg and Brouwer 1991). The major conceptual struggle was with linking Newton’s laws
with the forces acting on bodies and how a centripetal force and consequent acceleration is
produced (Stinner 2001). Further research links multiple representations, free-body diagrams
and problem solving; for example, see Rosengrant et al (2009), Savinainen et al (2013) and
Hill and Sharma (2015).
In year 1 of the study, an independent observer recorded the students’ and lecturers’ activi-
ties. The worksheet used in year 1 is shown in appendix B. Items 1, 2 and 3 of the worksheet
form a subsection on note taking requiring 30 min of class time and covering concepts and
equations as well as some examples. This section consisted of headings, some basic informa-
tion and diagrams, with a focus on explaining the content listed above. There was missing
information and blank spaces for students to take notes. Items 4 and 5 were devoted to in-class
problem-solving practice taking another 30 min of class time. The observations were used to
seek answers to questions such as the following: how was the existing worksheet used? What
were the students doing? Were student difficulties articulated in the literature evident? One
of the observations pertained to the design and evaluation of the teaching and learning envi-
ronment. Particular attention was paid to time spent on each activity and the sequence of the
activities. These answers give a measure of the ‘intensity’ of the active learning experiences
being facilitated through the use of worksheets.
A summary of the observations, which informed how the authors decided to make modifica-
tions, is as follows. For the note-taking subsection, the lecturers interacted with each other and
the students as described earlier, creating a free-flowing conversational atmosphere. During
peer discussions, students were asked to check-in on each other’s worksheets, while during
whole-class discussions students were sharing and extending prior understanding. For the
in-class problem-solving practice, students were spontaneously checking-in on each other’s
worksheets as they struggled to make sense of the content. Both lecturers walked around the
class giving time for students to work through the problems with their peers, fielding questions
and dropping hints but refraining from providing too much scaffolding. The observation was
made that students struggled when it came to applying content from note taking in problem
solving (Rosengrant et al 2009, Savinainen et al 2013); this informed the modifications in
year 2. The worksheet with a subsection, which is identified in the literature as note taking
combined with in-class practice, was used to facilitate relatively low-intensity active learning.
Table 1 shows the structure, sequence and time spent in year 1 and in subsequent years for the
lecture class time of 80 min.
In year 2, the structure was changed with the addition of a new element immediately after the
subsection note taking: a problem-solving strategy combined with a ‘worked example’ taking
30 min of class time, see table 1. This modification was based on the observation in year 1
that students struggled with problem solving. The five-step problem-solving strategy, shown
in figure 1, was outlined by the lecturer at the front of the lecture hall. The lecturer then showed
them a problem, explained it and gave students time to discuss the problem-solving strategy
with their peers. The lecturers then proceeded to illustrate how the problem-solving strategy
could be used by solving the problem while talking through what they were doing—a ‘worked
example’. Student discussions, questioning and answering, as well as whole-class discussion
occurred during this process. In the next 20 min, the students applied themselves to the same
two in-class problems as in year 1, and in the same manner. The observation that students
struggled with identifying and drawing forces on a free-body diagram (Sherwood 1971, Berg
and Brouwer 1991, Stinner 2001) informed the modifications in year 3. All in all, in year 2,
5Eur. J. Phys. 42 (2021) 035703 A Eambaipreuk et al
Table 1. Structure, sequence and time spent on various in-class activities from year 1 to
year 5, not showing the 10 min for the pre-test in years 2 to 5
Year 1 Year 2 Year 3 Year 4 Year 5
Demonstration + 5 Demonstration + 5
FBDa questions 15 FBD questions
min modified 15 min
Note taking 30 min Note taking 30 min Note taking 30 min Note taking 30 min Note taking 30 min
Demonstration + 1
FBD question 10
min
In-class Lecturer outlines Lecturer discusses Lecturer discusses Lecturer discusses
problem-solving five-step five-step five-step five-step
practice 30 min problem-solving problem-solving problem-solving problem-solving
strategy with no strategy with strategy with strategy with
diagram diagrams diagrams diagrams
Finished early
Worked example Worked example Worked example Worked example
using the strategy using the strategy using the strategy using the strategy
30 min 20 min 15 min 15 min
In-class In-class In-class In-class
problem-solving problem-solving problem-solving problem-solving
practice 20 min practice 20 min practice 20 min practice 20 min
a
FBD = Free-body diagram
more was expected of the students as a different type of engagement was utilized, making use
of the worksheet to facilitate active learning, making it more intense.
In year 3, the structure of the lectures was changed with the addition of yet another new ele-
ment immediately after note taking: a demonstration with a free-body diagram question. This
modification was based on the observation in year 2 that students struggled with identifying
and drawing forces on a free-body diagram. The demonstration was created collaboratively by
the lecturers and a student volunteer. The student walked in a straight line, the lecturer held
the student’s arm, exerting a force and the student turned around in a circle while the lec-
turer rotated. During this demonstration, the lecturer asked questions. The student answered
by describing the force they ‘felt’ and why they were turning. The other lecturer asked ques-
tions and provided explanations from the perspective of the students watching and vicariously
engaging. The interaction was used to seed a discussion of forces, directions and how to draw
free-body diagrams. A free-body diagram question on the worksheet accompanied the demon-
stration. Around 10 min were spent on the demonstration and free-body question. This was
followed by 20 min on the five-step problem-solving strategy. The strategy had been modified
slightly based on well-known textbooks (Hewitt 2002, Knight 2008) and validated by experts.
The first three steps of the strategy were emphasized in the discussion as these are shown to
be particularly helpful (Eambaipreuk et al 2015). Last, the students did in-class practice prob-
lems as in the previous years. The observations showed that the students were more adept at
problem solving and that the demonstration, combined with free-body practice, was useful.
However, it was noted that many students still struggled with the detail necessary for actually
drawing, using and interpreting free-body diagrams (Court 1999, Hill et al 2014), informing
the modifications in year 4.
6Eur. J. Phys. 42 (2021) 035703 A Eambaipreuk et al
Figure 1. Problem-solving strategy in the circular motion worksheet used to facilitate
active learning. Version used in year 2 had no diagram while those used in later years
had diagrams. In years 3 to 5, steps 1 to 3 were emphasized.
In year 4, the structure was changed by reordering the sequence of activities: modification
based on observations in year 3. Since the lecture before had discussed free-body diagrams, and
given the observation that students continued to struggle with these diagrams, the demonstra-
tion and free-body question were placed at the beginning. The demonstration, still conducted
in the same interactive manner as in year 3, came first, followed by a set of five questions in
which students needed to draw free-body diagrams; see table 1. For the first two free-body
diagram questions, the lecturers identified the path of the motion and radius as well as the
magnitude and direction of the forces acting on the object. The particular technique was con-
structed based on methods in textbooks and other literature (Hewitt 2002, Giambattista et al
2006, Knight 2008, Mazur et al 2015). Emphasis was placed on steps 1 to 3 of the five-step
problem-solving strategy without explicitly referring to the strategy. The students were then
asked to discuss the remaining three free-body diagram questions with their peers and the lec-
turers guided the students with whole-class discussion, questions and answers. The time for
the demonstration and full free-body diagram was increased to 15 min. Next, there was 30 min
of note taking, as in previous years, culminating in the application of Newton’s second law
to the three axes. This was followed by the discussion of the problem-solving strategy and an
accompanying worked example similar to previous years but with a reduced time of 15 min.
The last 20 min were spent on the in-class practice, which included the consideration of the
force needed to make the object move in a circular path—centripetal force.
7Eur. J. Phys. 42 (2021) 035703 A Eambaipreuk et al
Figure 2. Mean score on pre-test and post-test for years 1 to 4 and mean score on the
examination question from years 1 to 5. Error bars represent the SEM. Dashed line
illustrates the saturation level within the bounds of the SEM.
The worksheet used to facilitate active learning in year 5 is presented in appendix B. It
is much the same as that used in year 4, starting off with the demonstration, item 1. Minor
modifications were made to the manner in which the free-body diagram questions, item 2,
was undertaken. Items 3 to 6 constituted note taking with clear articulation of Newton’s sec-
ond law, followed by the problem-solving strategy, item 7 and in-class practice, item 8. There
is a stark contrast between the worksheet for year 1 with that for year 5. There is not only
more scaffolding, but more collaborative and interactive elements utilizing prompts on the
worksheet.
4. Results and discussion
In this section, we point to key findings visible graphically and supported by statistics and
follow this with a discussion on ‘intensity’ in the context of using worksheets that include a
distinct subsection on note taking for facilitating active learning.
4.1. Comparison of pre-test, post-test, examination question scores
Figure 2 shows the mean examination scores from years 1 to 5 and mean test scores for years
2 to 5. The error bars represent standard errors of the mean (SEM). We note substantive dif-
ferences between the post-test score and examination score, which we hypothesize is likely
due to students having time to consolidate their learning. Furthermore, none of the other fea-
tures in the course and its teaching had changed. The combination of these would give rise to
a consistent difference from year to year. Appendix A shows the questions; they are similar
in form, but the examination question is more nuanced. It is appropriate to note the trend of
increasing mean examination question scores with the suggestion of a saturation level, albeit
with variations.
The first decision was regarding which statistical approach to use when comparing means.
As mentioned previously, one-way Welch’s ANOVA was used for mean pre-test and post-
test scores, revealing a statistically significant difference between groups, Welch’s F(3,605) =
6.26, p < 0.001 and Welch’s F(3616) = 7.75, p < 0.001, respectively. One-way ANOVA was
8Eur. J. Phys. 42 (2021) 035703 A Eambaipreuk et al
used for mean examination question scores, again revealing a statistically significant difference
between groups, F(41 405) = 11.94, p < 0.001. Post hoc comparisons were conducted using
the Bonferroni correction and are presented below. Descriptive statistics and the results of the
statistical tests can be found in appendix C.
For the pre-test scores, post hoc comparisons using Bonferroni correction indicate that
means scores for both year 2 (M = 0.40, SD = 0.96) and year 3 (M = 0.35, SD = 0.82)
are statistically significantly higher than year 4 (M = 0.17, SD = 0.55) at p < 0.05. We note
that the mean pre-test score in year 4 is anomalously low. For the post-test scores, post hoc
comparisons using Bonferroni correction indicate that the mean scores for year 2 (M = 0.80,
SD = 1.14) are statistically significantly lower than year 3 (M = 1.20, SD = 1.39) as well as
year 5 (M = 1.30, SD = 1.44). We note that the year 4 (M = 0.93, SD = 1.25) cohort, which
came in with the lowest pre-test scores, is not statistically significantly different to the others
at p < 0.05.
Figure 2 shows that the mean examination question score for year 1 does not fall within
the limits of the SEM of the other years. This is confirmed by the post hoc comparisons using
Bonferroni correction at p < 0.05; year 1 (M = 1.61, SD = 1.55) is statistically significantly
lower compared to all other years, year 2 (M = 1.99, SD = 1.51), year 3 (M = 2.11, SD =
1.72), year 4 (M = 2.42, SD = 1.59) and year 5 (M = 2.26, SD = 1.50). We note that there
is overlap of SEM between years 2 and 3, years 3 and 5 and years 4 and 5, while years 2 and
4 clearly have no overlap. Post hoc comparisons return a statistically significant difference
between years 2 and 4 at p < 0.05 and no statistically significant difference between years 3, 4
and 5. The dashed lines in figure 2 illustrate the bounds of the SEM capturing this effect—the
saturation of the mean examination question scores.
We conclude from these data that there is a trend for improvements as the intensity increases,
but when examined statistically, there is a saturation level. This supports the conjecture that
introducing more active learning combined with scaffolding or rearranging the activities has
not really had an effect on the mean examination scores beyond a certain level. It should be
remembered that the class time in year 1 was shorter. We note that year 4 came in with the
lowest mean pre-test scores and exhibits no statistically significant difference in examination
scores compared with those for years 2 to 5.
4.2. ‘Intensity’ of active learning in the context of worksheets with a distinct subsection on
note taking
There is substantial literature on the effectiveness of note taking in lectures, with Mueller and
Oppenheimer (2014) showing that longhand note taking offers particular advantages for learn-
ing while Peverly et al (2007) point to the importance of the identification of main ideas and
transcription fluency. In this study, the identification of main ideas as well as checking-in on
transcription fluency with peers is orchestrated by the pair of lecturers in a collaborative man-
ner, sourcing the students’ prior knowledge and bouncing ideas around in peer groups with
whole-class interactions (Mayo et al 2009, Narjaikaew et al 2009), making the learning more
active.
While the act of inserting a worksheet does not predicate active learning it can form the
backbone for structuring the content, pacing and time keeping so that time and space are
available for scaffolding as well as for the students’ sense making. In short, it makes it eas-
ier for the lecturer to identify when they need to simply remain quiet. This is not dissimi-
lar to the worksheets used in interactive lecture demonstrations with clear demarcations for
different activities (Sokoloff and Thornton 1997). In this study, the worksheet provided the
impetus to focus on the problem-solving strategy the students were struggling with, using the
9Eur. J. Phys. 42 (2021) 035703 A Eambaipreuk et al
drawing of free-body diagrams and a lecture demonstration with a student volunteer (Berg and
Brouwer 1991, Roberts et al 2008, Sujarittham et al 2016). In particular, collaborative tech-
niques were used abundantly. Hence, the ‘intensity’ of the active learning has been modified
in a measured manner, incorporating different ways of incorporating active learning utilizing
worksheets as a tool. Our study also shows that there is a saturation level, both from the point
of view of how much can be fitted in and what the mean examination scores on the topic
are. This possibly reflects the tension between scaffolding and time for making sense of the
material.
5. Summary of results
This paper focuses on worksheets with a distinct subsection on note taking for facilitating active
learning with the intent of shedding light on the intensity of active learning. Improvements
were made to enhance student understanding and problem-solving skills on the topic of cir-
cular motion, a topic where students often face difficulties. The enhancements included using
lecture demonstrations, increased use of free-body diagrams and a problem-solving strategy.
Observations were made and physics education literature was used to inform the development.
Pre-test, post-test and an examination question with simple scoring were used with large cohort
sizes. The results show a trend for the mean scores to increase as the intensity of the active learn-
ing facilitated by worksheets increased. From years 2 to 5, the intensity had increased, but the
mean examination scores were not statistically significantly different, suggesting a saturation
level.
Our in-depth investigation indicates that the study of intensity can be a fruitful path to follow
for researchers to examine how and which changes in intensity lead to better learning outcomes.
For practitioners, it suggests that explicitly engaging students with problem-solving strategies
may be a worthwhile endeavor. We suggest that the practitioner makes it clear that problem-
solving requires a ‘strategy’. Searching for an equation is a strategy, but it is not as useful as
other strategies. However, just saying this once is not enough. The critical aspect is lecturers
integrating the problem-solving strategy effectively into the teaching, taking time to introduce
the problem-solving strategy as well as diligently and consistently using it themselves. Further-
more, they need to give students time to practise using the strategy; supporting and rewarding
the students in their use of the strategy. Once the students are used to the idea of a ‘strategy’,
other strategies can be introduced. The learner needs to grow into the idea that ‘strategies’ are
important and be open to ‘strategizing’. Our study also indicates that gradual modifications can
lead to increases in student performance, but these results may well saturate. Finally, we would
take the liberty of speculating why there is saturation. Is it because of the ceiling effect, where
there is not much room for further improvement? Is it because of the attention span because so
much has been packed in that students do not really have sufficient time to focus before being
moved on? Is it because there is a subset of the cohort for whom this approach does not work?
From the authors’ experiences, a possibility is the role the problem-solving strategy played in
enabling more students to engage with homework problems in this lecture-based course. In
year 1 and 2, few students were engaging with homework. The problem-solving strategy pro-
vided a pathway for more students to apply themselves to their homework problems in later
years. However, only a certain number of students could be reached via the problem-solving
strategy, resulting in saturation in later years. We note that these possibilities all need further
research. It is likely that the presence of saturation may differ for different topics and contexts.
It is important to find a balance that works for most students, most of the time. Studies such as
this assist in scoping the balance.
10Eur. J. Phys. 42 (2021) 035703 A Eambaipreuk et al
This study has occurred in one institution and on one topic, affirming current findings on
active learning as well as providing new insight. It also provides some ideas of how research-
based approaches can be used in large lecture cohorts. Further studies on different topics and
with different cohorts investigating the intensity of active learning approaches could offer more
possibilities for improving teaching practice.
Acknowledgments
The authors would like to thank participating staff, students and the Physics Education Net-
work of Thailand for their help in data collecting and the Sydney University Physics Education
Research group. We would also like to thank the Science Achievement Scholarship of Thailand,
Department of Physics, Faculty of Science, Mahidol University. Ian Sefton, Brian McInnes and
referees have provided constructive feedback. Approval from the Human Ethics Committee of
the Institution was granted.
Appendix A. The pre-test, post-test and the examination question; the same
question was used for the pre-test and post-test (from Eambaipreuk et al 2015)
11Eur. J. Phys. 42 (2021) 035703 A Eambaipreuk et al
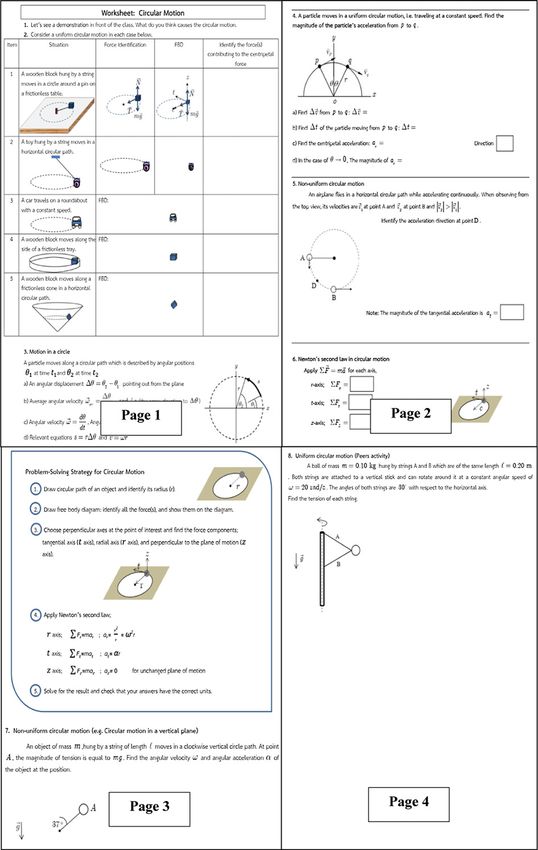
Appendix B. The worksheets for year 1 and year 5 on circular motion used to
facilitate active learning
Year1
12Eur. J. Phys. 42 (2021) 035703 A Eambaipreuk et al
Year 5
13Eur. J. Phys. 42 (2021) 035703 A Eambaipreuk et al
Appendix C. Descriptive statistics, Welch’s ANOVA test of the mean pre-test
and post-tests scores, ANOVA test for mean examination question score and
post hoc multiple comparisons using Bonferroni correction
Descriptive statistics for pre-test, post-test and examination question.
Statistic Mean Std error of mean (SEM) Std deviation (SD)
Year 1 Total 4 exam 1.61 0.092 1.555
n = 287
Year 2 Total 4 pre 0.40 0.059 0.963
n = 273 Total 4 post 0.80 0.069 1.137
Total 4 exam 1.99 0.092 1.512
Year 3 Total 4 pre 0.35 0.049 0.816
n = 287 Total 4 post 1.20 0.083 1.394
Total 4 exam 2.11 0.102 1.722
Year 4 Total 4 pre 0.16 0.033 0.546
n = 270 Total 4 post 0.93 0.077 1.248
Total 4 exam 2.42 0.097 1.595
Year 5 Total 4 pre 0.33 0.046 0.789
n = 288 Total 4 post 1.30 0.085 1.439
Total 4 exam 2.26 0.089 1.502
Welch’s ANOVA for pre-test
a
Statistic df1 df2 Sig
Welch 6.259 3 604.71 0.000
Welch’s ANOVA for post-test
Statistica df1 df2 Sig
Welch 7.748 3 616.49 0.000
ANOVA for examination question
Sum of squares df Mean square F Sig
Total score (4) Between groups 113.95 4 28.49 11.94 0.000
Within groups 3352.87 1405 2.39
Total 3466.83 1409
a
Asymptotically F distributed
Multiple comparisons using Bonferroni correction—output from SPSS version 24.
The first column is the dependent variable, second and third columns are the years being
compared, fourth column is the difference between the means indicating the direction of the
difference, fifth column the standard error, sixth column the statistical significance with those
marked in red indicating p values < 0.05 and the last two columns are the lower and upper
bounds of the 95% confidence interval.
14Eur. J. Phys. 42 (2021) 035703 A Eambaipreuk et al
Multiple comparisons using Bonferroni corrections
95% Confidence interval
Dependent variable Compared years Mean difference Std error Sig Lower bound Upper bound
Pre-test total score 4 Year 2 Year 3 0.048 0.068 1.000 −0.13 0.23
Year 4 0.230a 0.069 0.05 0.41
Year 5 0.056 0.068 1.000 −0.12 0.24
Year 3 Year 2 −0.048 0.068 1.000 −0.23 0.13
Year 4 0.182a 0.068 0.00 0.36
Year 5 0.008 0.067 1.000 −0.17 0.19
Year 4 Year 2 −0.230 a
0.069 −0.41 −0.05
Year 3 −0.182a 0.068 −0.36 0.00
Year 5 −0.174 0.068 0.066 −0.35 0.01
Year 5 Year 2 −0.056 0.068 1.000 −0.24 0.12
Year 3 −0.008 0.067 1.000 −0.19 0.17
Year 4 0.174 0.068 0.066 −0.01 0.35
Post-test total score 4 Year 2 Year 3 −0.367a 0.112 −0.66 −0.07
Year 4 −0.193 0.114 0.542 −0.49 0.11
Year 5 −0.488a 0.112 −0.78 −0.19
Year 3 Year 2 0.367a 0.112 0.07 0.66
Year 4 0.174 0.112 0.719 −0.12 0.47
Year 5 −0.121 0.110 1.000 −0.41 0.17
Year 4 Year 2 0.193 0.114 0.542 −0.11 0.49
Year 3 −0.174 0.112 0.719 −0.47 0.12
Year 5 −0.295 0.112 0.050 −0.59 0.00
Year 5 Year 2 0.488a 0.112 0.19 0.78
Year 3 0.121 0.110 1.000 −0.17 0.41
Year 4 0.295 0.112 0.050 0.00 0.59
Exam total score 4 Year 1 Year 2 −0.375a 0.131 −0.74 −0.01
Year 3 −0.644a 0.128 −1.00 −0.28
Year 4 −0.812a 0.131 −1.18 −0.45
Year 5 −0.632a 0.128 −0.99 −0.27
Year 2 Year 1 0.375a 0.131 0.01 0.74
Year 3 −0.269 0.131 0.398 −0.64 0.10
Year 4 −0.437a 0.133 −0.81 −0.06
Year 5 −0.257 0.131 0.500 −0.62 0.11
a
Year 3 Year 1 0.644 0.128 0.28 1.00
Year 2 0.269 0.131 0.398 −0.10 0.64
Year 4 −0.168 0.131 1.000 −0.54 0.20
Year 5 0.012 0.128 1.000 −0.35 0.37
Year 4 Year 1 0.812a 0.131 0.45 1.18
Year 2 0.437a 0.133 0.06 0.81
Year 3 0.168 0.131 1.000 −0.20 0.54
Year 5 0.180 0.131 1.000 −0.19 0.55
Year 5 Year 1 0.632a 0.128 0.27 0.99
Year 2 0.257 0.131 0.500 −0.11 0.62
Year 3 −0.012 0.128 1.000 −0.37 0.35
Year 4 −0.180 0.131 1.000 −0.55 0.19
a
The mean difference is significant at the 0.05 level
15Eur. J. Phys. 42 (2021) 035703 A Eambaipreuk et al
ORCID iDs
A Eambaipreuk https://orcid.org/0000-0001-6555-9823
References
Berg T and Brouwer W 1991 Teacher awareness of student alternate conceptions about rotational motion
and gravity J. Res. Sci. Teach. 28 3–18
Biehler R F and Snowman J 1986 Psychology Applied to Teaching (Boston: Houghton Mifflin)
Carter J F and van Matre N H 1975 Note taking versus note having J. Educ. Psychol. 67 900–4
Court J E 1999 Free-body diagrams revisited: I Phys. Teach. 37 427–33
Duit R 2000 A model of educational reconstruction as a framework for designing and validating teaching
and learning sequences Meeting on Research-Based Teaching Sequences (Paris)
Duit R, Gropengießer H, Kattmann U, Komorek M and Parchmann I 2012 The model of educational
reconstruction—a framework for improving teaching and learning Science Sci. Educ. Pract. Eur. 5
13–37
Eambaipreuk A, Emarat N and Arayathanitkul K 2015 Teaching problem-solving strategy in circular
motion to first-year science students Siam Physics Congress 2015 (Thailand: Krabi) 27–30
Emarat N, Chitaree R, Arayathanitkul K and Soankwan C 2012 Physics I 8th edn (Bangkok: Mahidol
University)
Freeman S, Eddy S L, Mcdonough M, Smith M K, Okoroafor N, Jordt H and Wenderoth M P 2014 Active
learning increases student performance in science, engineering, and mathematics Proc. Natl Acad.
Sci. 111 8410–15
Georgiou H and Sharma M D 2014 Does using active learning in thermodynamics lectures improve
students’ conceptual understanding and learning experiences? Eur. J. Phys. 36 015020
Giambattista A, Richardson R C and Richardson-Mccarthy B 2006 College Physics (New York: McGraw-
Hill)
Hake R R 1998 Interactive-engagement versus traditional methods: a six-thousand-student survey of
mechanics test data for introductory physics courses Am. J. Phys. 66 64–74
Hewitt P G 2002 Conceptual Physics 9th ed. (San Francisco: Addison Wesley)
Hill M, Sharma M D, O’Byrne J and Airey J 2014 Developing and evaluating a survey for representational
fluency in science Int. J. Innovat. Sci. Math. Educ. 22 22–42
Hill M and Sharma M D 2015 Research-based worksheets on using multiple representations in science
classrooms Teach. Sci. 61 37–46
Konrad M, Joseph L M and Eveleigh E 2009 A meta-analytic review of guided notes Educ. Treat. Child.
32 421–44
Knight R D 2008 Physics for Scientist and Engineers with Modern Physics: A Strategic Approach (San
Francisco: Pearson Addison Wesley)
Mayo A, Sharma M D and Muller D A 2009 Qualitative differences between learning environments using
videos in small groups and whole class discussions: a preliminary study in physics Res. Sci. Educ.
39 447–93
Mazur E, Crouch C H, Pedigo D, Dourmashkin P A and Bieniek R J 2015 Principles and Practice of
Physics (Boston: Pearson)
Mihas P and Gemousakakis T 2007 Difficulties that students face with two-dimensional motion Phys.
Educ. 42 163
Mueller P A and Oppenheimer D M 2014 The pen is mightier than the keyboard Psychol. Sci. 25 1159–68
Narjaikaew P, Emarat N and Cowie B 2009 The effect of guided note taking during lectures on Thai
university students’ understanding of electromagnetism Res. Sci. Technol. Educ. 27 75–94
Novak G M, Patterson E, Garvin A and Christian W 1999 Just-in-Time Teaching: Blending Active
Learning with Web Technology (Upper Saddle River: Prentice Hall)
Peverly S T, Ramaswamy V, Brown C, Sumowski J, Alidoost M and Garner J 2007 What predicts skill
in lecture note taking? J. Educ. Psychol. 99 167–80
Redish E F 1994 Implications of cognitive studies for teaching physics Am. J. Phys. 62 796–803
Roberts A L, Sharma M D, Sefton I M and Khachan J 2008 Differences in two evaluations of answers to
a conceptual physics question: a preliminary analysis CAL-laborate Int. 16 28–38
16Eur. J. Phys. 42 (2021) 035703 A Eambaipreuk et al
Rosengrant D, Van Heuvelen A and Etkina E 2009 Do students use and understand free-body diagrams?
Phys. Rev. Spec. Top. Phys. Educ. Res. 5 010108
Savinainen A, Mäkynen A, Nieminen P and Viiri J 2013 Does using a visual-representation tool foster
students’ ability to identify forces and construct free-body diagrams? Phys. Rev. Spec. Top. Phys.
Educ. Res. 9 010104
Sharma M D and Georgiou H 2017 More active lecture approaches in science and mathematics: using
expert cultural capital to drive change Report for the Australian Government Office for Teaching and
Learning The University of Sydney https://altf.org/wp-content/uploads/2017/06/Sharma_NTF_-
Report_2017.pdf
Sharma M, Khachan J, Chan B and O’Byrne J 2005 An investigation of the effectiveness of electronic
classroom communication systems in large lecture classes Australas. J. Educ. Technol. 21 137–54
Sharma M D et al 2017 Implementing and investigating distributed leadership in a national university
network–SaMnet J. High. Educ. Pol. Manag. 39 169–82
Sherwood B A 1971 Free-body diagrams (a PLATO lesson) Am. J. Phys. 39 1199–202
Sinatra G M, Heddy B C and Lombardi D 2015 The challenges of defining and measuring student
engagement in science Educ. Psychol. 50 1–13
Sokoloff D R and Thornton R K 1997 Using interactive lecture demonstrations to create an active learning
environment Phys. Teach. 35 340
Stinner A 2001 Linking ‘the book of nature’ and ‘the book of science’: using circular motion as an
exemplar beyond the textbook Sci. Educ. 10 323–44
Sujarittham T, Emarat N, Arayathanitkul K, Sharma M D, Johnston I and Tanamatayarat J 2016
Developing specialized guided worksheets for active learning in physics lectures Eur. J. Phys. 37
025701
Tanahoung C, Chitaree R, Soankwan C, Sharma M D and Johnston I D 2009 The effect of interactive
lecture demonstrations on students’ understanding of heat and temperature: a study from Thailand
Res. Sci. Technol. Educ. 27 61–74
Wattanakasiwich P, Khamcharean C, Taleab P and Sharma M D 2012 Interactive lecture demonstration
in thermodynamics Lat. Am. J. Phys. Educ. 6 507–14
Wieman C E 2014 Large-scale comparison of science teaching methods sends clear message Proc. Natl
Acad. Sci. 111 8319–20
Wutchana U and Emarat N 2011 Student effort expectations and their learning in first-year introductory
physics: a case study in Thailand Phys. Rev. Spec. Top. Phys. Educ. Res. 7 010111
17You can also read