Country Chapter State of the 3Rs in Asia and the Pacific - the United Nations
←
→
Page content transcription
If your browser does not render page correctly, please read the page content below
State of the 3Rs in Asia and the Pacific

 Country Chapter
 State of the 3Rs in Asia and the Pacific

                               November 2017

Author:
Institute for Global Environmental Strategies (IGES)
With inputs from
Christopher Lee Yew Binn
National Environment Agency
Co-ordinated by:
The Secretariat of the Regional 3R Forum in Asia and the Pacific,
United Nations Centre for Regional Development (UNCRD),
Institute for Global Environmental Strategies (IGES)
Financially Supported by:
Ministry of the Environment, Government of Japan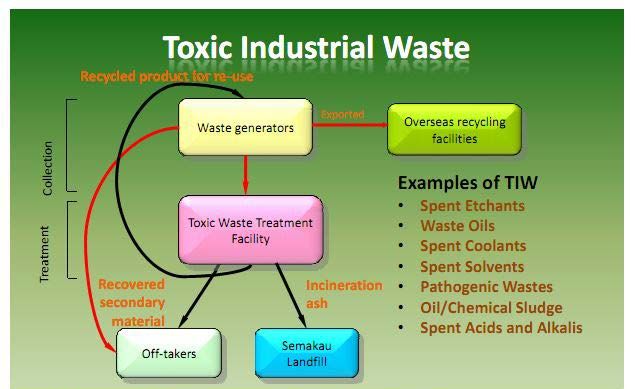
No parts of this publication may be reproduced or transmitted in any form or by any means,
electronic or mechanical, including photocopying, recording, or any information storage and
retrieval system, without prior permission of the Secretariat of the Regional 3R Forum in Asia
and the Pacific (3R@uncrd.or.jp).

Although every effort is made to ensure objectivity and balance, the publication of research
results or translations thereof does not imply the endorsement of the United Nations or MOEJ,
or the government of the Republic of Singapore, hereinafter referred to as “Singapore”. The
United Nations, MOEJ, as well as the government of Singapore, maintains a position of
neutrality at all times on issues concerning public policy. Hence conclusions that are reached
in this publication should be understood to be those of the individual authors and not attributed
to officers of United Nations, MOEJ, or the government of Singapore.

Further, the designations employed and the presentation of the material in this publication do
not imply the expression of any opinion whatever on the part of the Secretariat of the United
Nations concerning the legal status of any country, territory, city or area or of its authorities, or
concerning the delimitation of its frontiers or boundaries.

                                           Disclaimer
 This country chapter for Singapore was prepared as an input for the 8th 3R
 Forum in Asia and the Pacific. Purpose of this country report is to assess the
 status of 3R implementation in Asia and the Pacific and to share the knowledge
 of 3R activities among the region.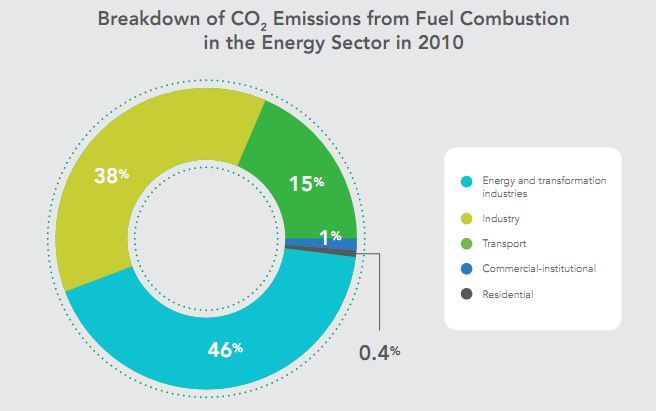
ACKNOWLEDGEMENT

This publication is intended to provide expert-based assessment of regional progress of 3R policy
implementation in selected countries and regions in Asia and the Pacific, particularly in response to
the Hanoi 3R Goals (2013-2023) adopted at the 4th Regional 3R Forum in Asia and the Pacific in
Hanoi in March 2013.

The State of the 3Rs in Asia and the Pacific project is a collaborative initiative involving Institute
for Global Environmental strategies (IGES) and United Nations Centre for Regional Development
(UNCRD), supported by the Ministry of Environment. We acknowledge expert contributions from
the Institute for Global Environmental Strategies (IGES), Institute of Developing Economies –
Japan External Trade Organization (IDE-JETRO), Kyoto University, Tottori University, University
of Tokyo, National Institute for Environmental Studies (NIES) of Japan, Japan Waste Management
& 3Rs Research Foundation, ISPONRE of Viet Nam, Green Amity Co., Ltd., Chulalongkorn
University, Tsinghua University, University of the Philippines Los Baños (UPLB), North South
University, BRAC University, SPREP, Anna University, Royal University of Phnom Penh, CSIR
Indian Institute of Petroleum, National Environment Agency of Singapore, University of Malaya
(UM), Asia Institute of Technology (AIT) and Institut Teknologi Bandung.

Special acknowledgement for the knowledge contribution by Mr. Christopher Lee Yew Binn, Waste
& Resource Management Department, National Environment Agency, Singapore. We also express
gratitude for drafting works made by the Institute for Global Environmental strategies (IGES). This
project is financially supported by the Ministry of the Environment of Japan (MOEJ) with intention
to support the policy consultations at the Regional 3R Forum in Asia and the Pacific.

                                      United Nations Centre for Regional Development (UNCRD).

                                                  i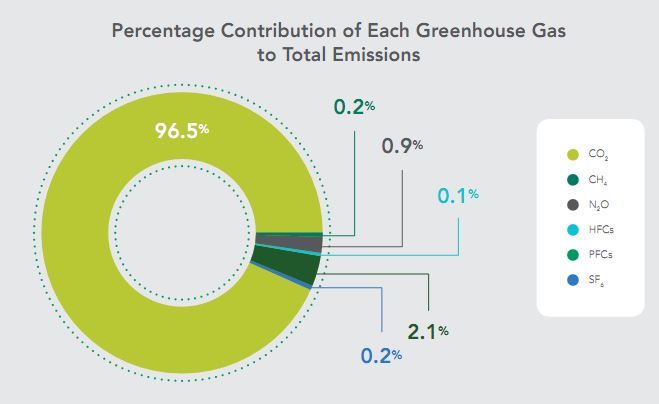
Author
Institute for Global Environmental Strategies (IGES)

With inputs from
Dr. Christopher Lee Yew Binn, National Environment Agency, Singapore

Editor
Dr. Chen Liu                        IGES
Dr. Yasuhiko Hotta                  IGES
Mr. Yoshiaki Totoki                 IGES

Editorial Support
Ms. Emma Fushimi                    IGES
Ms. Miki Inoue             IGES

Coordinated by:
The Secretariat of the Regional 3R Forum in Asia and the Pacific,
United Nations Centre for Regional Development (UNCRD)
Nagono 1-47-1, Nakamura-ku, Nagoya 450-0001, JAPAN
Tel: (+81-52) 561-9377
Fax: (+81-52) 561-9375
E-mail: rep@uncrd.or.jp

Institute for Global Environmental Strategies (IGES)
2108-11, Kamiyamaguchi, Hayama, Kanagawa, 240-0115, Japan
Tel: +81-46-855-3700 Fax: +81-46-855-3709
E-mail: iges@iges.or.jp
URL: http://www.iges.or.jp

                                                ii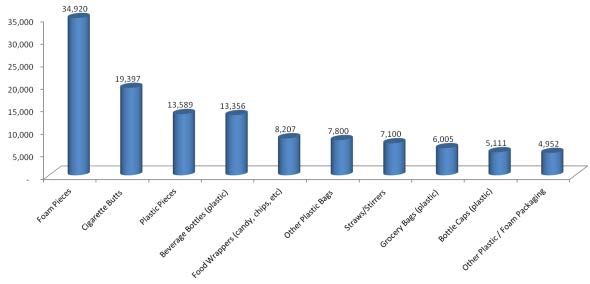
ABBREVIATION
    EDB        Economic Development Board
    CGNPC      China Guangdong Nuclear Power Holding Corporation
    CH4        Methane
    CO2        Carbon dioxide
    EPR        Extended Producer Responsibility
    GDP        Gross Domestic Product
    Gg         gigagram
    GHG        Greenhouse Gas
    ICCS       International Coastal Cleanup Singapore
    IMCSD      Inter-Ministerial Committee on Sustainable Development
    IPCC       Inter-governmental Panel on Climate Change
    MEWR       Ministry of the Environment and Water Resources
    MPA        Maritime and Port Authority of Singapore
    MSW        Municipal Solid Waste
    NEA        National Environment Agency
    N2O        Nitrous oxide
    RC         Residents’ Committee
    SPA        Singapore Packaging Agreement
    SSB        Sustainable Singapore Blueprint
    TIW        Toxic industrial wastes

                                  iii
CONTENTS
ACKNOWLEDGEMENT ................................................................................................................ i
ABBREVIATION ........................................................................................................................... iii
A: WASTE DEFINITION................................................................................................................ 1
B: COUNTRY SITUATION ............................................................................................................ 2
C: 3R INDICATORS ....................................................................................................................... 4
I. Total MSW Generated and Disposed and MSW Generation per Capita................................... 4
II. Overall Recycling Rate and Target (%) and Recycling Rate of Individual Components of MSW
...................................................................................................................................................... 6
III. Amount of Hazardous Waste Generated and Disposed in Environmentally Sound Manner.. 8
IV. Amount of Agricultural Biomass Used ................................................................................... 9
V. Marine and Coastal Plastic Waste........................................................................................... 10
VI. E-Waste Management ............................................................................................................11
VII. Principle of Extended Producer Responsibility (EPR)-Singapore Packaging Agreement .. 13
VIII. Greenhouse Gas (GHG) Emissions from Waste Sector ..................................................... 14
D: EXPERT’S ASSESSMENT ON 3R POLICY IMPLEMENTATION ..................................... 18
REFERENCES .............................................................................................................................. 19
ivA: WASTE DEFINITION
Wastes in Singapore can be classified as general waste and toxic industrial waste. General wastes
consist mainly of waste from households, trade, commercial and industrial premises. Toxic
industrial wastes are hazardous wastes generated from industrial activities. A total of 3.04 million
tonnes of general wastes was disposed of in 2014. The bulk of these wastes include paper/cardboard,
food, plastic, horticultural trimmings, wood/timber, etc.
The following table shows the waste characterisation.
Wastes
Toxic Industrial Waste
General Waste
Hazardous Waste
(Mostly Solid Waste)
(Solid/Liquid Waste)
Generated from residential,
Mainly generated from
trade, commercial and
industrial activities and
industrial premises.
hospitals. Includes:
Comprises inorganic and
Toxic Industrial Waste such as
organic waste, e.g.
spent etchants, waste oils, spent
paper/cardboard,
coolants, oil/chemical sludge,
construction debris, plastic,
spent acids and alkalis, and
food, horticultural
Biohazardous Waste such as
trimmings, wood/timber, etc
infectious waste, pathological
waste, contaminated sharps,
Source: Data obtained from NEA Website
Figure A-1 Waste Characterisation
1B: COUNTRY SITUATION
The Republic of Singapore is a small island state of approximately 718 km2 and stands at the
crossroads of South East Asia. The city state is made up of mainland Singapore and some 60 islets.
In 2014, the city state had an estimated population of 5.54 million. At 7,697 per square kilometre,
Singapore has one of the highest population densities in the world. The main economic drivers for
Singapore are the manufacturing and service industries, including finance, aviation, tourism,
petrochemicals, electronics and biotechnologies. Singapore’s port and airport facilities are amongst
the busiest in the world, making it a major trading centre.
The extensive industrialisation has dictated the need for effective governance in environmental
management and pollution prevention. Through policy intervention since the 1960s, Singapore is a
well-planned and clean city. Waste management in Singapore is achieved through an efficient
system of planning controls, licensing and enforcement.
Singapore’s waste management system is motivated by two guiding principles:
a) Maintaining high levels of public health; and
b) Optimising resource utilisation.
In short, the waste collection, disposal and treatment methods must safeguard public health and
maximise the value recovered from waste. In Singapore, waste that is not recycled or reused is
classified either as incinerable or non-incinerable waste. Incinerable waste is sent to the incineration
plants, where the waste is incinerated and turned into an ash residue. The volume of residual ash is
just 10% of the volume of the waste. This mitigates the need for landfill space. The incineration
process produces heat energy, which is in turn converted to electricity that is fed into the national
grid. The residual ash is sent to the Semakau landfill. The non-incinerable waste fraction goes
straight to the Semakau landfill after treatment if necessary.
As a small city state, Singapore has to make prudent use of land to house its growing population
and support economic growth. Continual building of waste disposal facilities to meet increasing
amounts of waste requires land that could be put to better use for industries, housing, water
catchments, and transportation, which are important for Singapore’s progress. Furthermore,
investments in waste disposal facilities are costly and lead to higher waste disposal costs.
Recognising the need to reduce waste disposal, the then Ministry of the Environment started to
actively promote waste minimisation from 1991. To drive waste minimisation efforts, the National
Environment Agency (NEA), a statutory board formed in 2002, adopted waste management
strategies based on the 3Rs, that is, Reduce waste at source (or waste avoidance), Reuse waste, and
Recycle waste. Such an approach helps to defer the construction of new disposal facilities and hence
reduce the demand for land to build these facilities.
An Inter-Ministerial Committee on Sustainable Development (IMCSD) that was set up in January
2008 to develop key strategies for Singapore’s sustainable development drew up a Sustainable
Singapore Blueprint (SSB) with recommendations for a sustainable Singapore. Among the goals
identified in the SSB are targets for Singapore to improve the overall waste recycling rate to 70%
2by 2030.
The Ministry of the Environment and Water Resources (MEWR) and the NEA have embarked on
a ‘Towards Zero Waste’ vision under the Sustainable Singapore Blueprint. Resource and land scarce
Singapore must find ways to extend the lifespan of its landfills and maximise the use of its resources.
A ‘Towards Zero Waste’ mindset and culture encapsulate these ideas. By building a unifying vision,
Singapore hopes to expand awareness of its waste situation significantly and spur “reduce, reuse
and recycle” efforts in every sphere (Source: Ministry of the Environment and Water Resources,
Our Waste Situation 2014).
3C: 3R INDICATORS
I. Total MSW Generated and Disposed and MSW Generation per Capita
Singapore’s growing population, which increased from 2.1 million in 1970 to 5.47 million in 2014,
and sustained economic growth have contributed to a 7-fold increase in solid waste disposal
quantities from 1,260 tonnes a day in the 1970s to 8,338 tonnes a day in 2014.
The figure below shows the amount of solid waste disposed of at the disposal facilities from 1999
to 2014.
3000.0
2500.0
2000.0
Thousand Tonnes
Landfilled
1500.0
Incineration
Total
1000.0
500.0
0.0
1999
2000
2001
2002
2003
2004
2005
2006
2007
2008
2009
2010
2011
2012
2013
2014
Source: Data obtain from NEA Website, Waste Management, Refuse Disposal Figures
Figure C-1 Disposal of Incinerable vs Non-Incinerable Waste (1999-2014)
4Total Refuse Disposal Vs GDP (2000 - 2014)
3100 400.00
3000
2900 350.00
2800
Thousand Tonnes
300.00
2700
2600
250.00
2500
2400 200.00
2300
2200 150.00
2000 2001 2002 2003 2004 2005 2006 2007 2008 2009 2010 2011 2012 2013 2014
Total Waste (k tonnes) 2797.22802.22625.6 2505 2482.62548.72563.62566.82627.62628.92759.52859.52934.03025.63043.4
GDP (Billion S$) 183.38181.63189.28197.68216.55232.77253.40276.48281.43279.73322.36342.37354.06369.79380.59
Source: Data obtain from NEA Website, Waste Management, Refuse Disposal Figures & Singapore Department of Statistics, GDP
Figure C-2 Total Refuse Disposal Vs GDP (2000-2014)
Total Waste Disposed Of Per Capita Per Day (2000 - 2014)
2.00
1.90
1.90
1.85
1.80
1.72
Kg/Capita/Day
1.70
1.67 1.64
1.60 1.60
1.63 1.54 1.52
1.54 1.51 1.51
1.50 1.47
1.49
1.40 1.44
1.30
1.20
2000 2001 2002 2003 2004 2005 2006 2007 2008 2009 2010 2011 2012 2013 2014
Kg/Capita/Day 1.90 1.85 1.72 1.67 1.63 1.64 1.60 1.54 1.47 1.44 1.49 1.51 1.51 1.54 1.52
Source: Data obtained from NEA Website, Waste Management, Refuse Disposal Figures & Singapore Department of Statistics,
Population
Figure C-3 Total Waste Disposed Of Per Capita Per Day (2000-2014)
5The main sources of incinerable wastes include municipal waste (trade, commercial and residential),
wastes generated from factories and industries, construction and various organizations such as
hospitals and educational institutions. It is estimated that half of the incinerable wastes disposed of
in Singapore come from the industrial and commercial sectors.
Based on 2014 waste statistics, approximately 60% of the total waste generated were recycled, 38%
incinerated and 2% landfilled.
Source: NEA website, waste statistics and overall recycling, 2014
Figure C-4 Recycling Rate for 2014
II. Overall Recycling Rate and Target (%) and Recycling Rate of Individual
Components of MSW
To attain the SSB targets and achieve the long-term “towards zero waste” vision, the NEA engages
and works in partnership with various organisations in the people, private and public sectors to plan
and implement waste minimisation and recycling programmes.(Source: NEA, 3R Guidebook for
6Hotels Published on 1 July 2011)
The statistics (Figure C-5) show that there is an upward trend in waste recycling from 2007 (54%)
to 2014 (60%) and Singapore is on track to achieve the SSB 2030 target of 70%. There was little
variation in total waste disposed of per capita (kg/day/person) at 1.51 – 1.54 over the last four years.
Source: Key Environment Statistics, Ministry of the Environment and Water Resources
Figure C-5 Key Statistics of Solid Waste Management (2007-2014)
7Of the 7.51 million tonnes of waste generated in 2014, the majority of construction and demolition
wastes, used slag, scrap tyres, ferrous/non-ferrous metals and wood wastes were recycled at rates of
between 80-99%. Food waste at 0.79 million tonnes/year and plastic waste at 0.87 million tonnes/year
accounted for approximately 10% and 12% of total waste generated respectively. Food and plastic
wastes constitute approximately 23% and 26% respectively of the total wastes disposed of at the disposal
facilities. The recycling rates of food and plastic wastes at 13% and 9% respectively are relatively low.
The low recycling rates of food and plastic wastes for the past ten years show that more efforts are needed
to reduce and recycle these wastes.
III. Amount of Hazardous Waste Generated and Disposed in Environmentally
Sound Manner
Toxic industrial wastes (TIW) are defined as industrial wastes which may be potentially detrimental
to human health and/or the environment and which require special management, treatment and
disposal. There are currently more than 2,000 companies in Singapore which handle or use
hazardous chemicals. The use of these chemicals generates a wide variety of toxic industrial wastes.
The main types of toxic industrial wastes are spent acids, spent solvents, spent etchants, waste oil
and other waste sludge. In 2014, approximately 1,136,240 m3 of TIW were generated. The valuable
components of a large amount of TIW generated and collected in Singapore by the licensed
collectors are extracted and recovered before the TIW is disposed. Such wastes include spent
solvents, spent etchants and waste oils. Those wastes that cannot be recycled or recovered are treated
and the residues are disposed of at the Semakau Landfill. The TIW collectors are required to be
licensed by NEA and the waste movement is tracked by an e-Tracking System. Currently, there are
approximately 200 TIW collectors which are licensed to collect specific types of TIW. Of the 200
collectors, about 10 also operate a wide range of TIW treatment facilities.
Source: NEA, presentation for Asia Pacific Workshop, 2011
Figure C-6 Toxic Industrial Waste Management
8IV. Amount of Agricultural Biomass Used
In 2000, about 3.3% of Singapore's land area was classified as forest. There is little productive
forestry left on the island, but Singapore continues to have a fairly sizable sawmilling industry,
processing timber imported largely from Malaysia and Indonesia. Urbanization and
industrialization have taken ever larger amounts of land away from agricultural activity in
Singapore. Housing for a growing population and factories stand where rubber and coconut trees
used to grow. Nonetheless, agriculture remains part of Singapore's total economic activity. About
3% of the land area is used for farming, primarily for vegetables (Source: Worldmark Encyclopedia
of Nations |2007 |).
Sembcorp launched a waste-to-energy facility on Jurong Island in 2012 which incinerates wood
waste to produce steam for customers on Jurong Island. In early 2014, a unique integrated biomass-
solar power generation plant by the China Guangdong Nuclear Power Holding Corporation
(CGNPC) was also completed. Also located in the Jurong area, this US$33.6 million hybrid facility
is capable of generating up to 9.9-megawatts of electricity by drawing from a unique mix of waste
biomass and solar energy. Elsewhere in Singapore, local firm ecoWise runs one of the country’s
most recognisable biomass projects, the Biomass Co-generation System at the iconic Gardens by
the Bay. Horticultural and wood wastes sourced and processed by ecoWise serve as feedstock for
the co-generation plant, which can produce up to 0.9 megawatts of electricity and 5.4 megawatts of
heat.
However, there is a limited quantity of wood and horticultural wastes from local sources.
Based on the waste statistics 2014 (Figure C-4), approximately 201,300 tonnes of wood/timber and
horticulture wastes were used as fuel for biomass power plants. As a highly urbanized city-state,
except for small scale vegetable farming, agriculture is not a major sector in Singapore. It is unlikely
that wood and horticultural wastes will have a major role in the energy sector.
Singapore has been investing substantially in clean technology capabilities in order to address
climate change and reduce reliance on fossil fuel sources. Of interest is the development of its solar
energy capabilities, given the country’s location in the tropical sunbelt and strong semiconductor
manufacturing and innovation base. In Singapore, clean technology (cleantech) was identified as a
key economic growth area by the government as early as 2007. Today, the city-state is aiming to
develop the sector so that it contributes S$3.4 billion to Singapore’s gross domestic product (GDP)
and provides 18,000 jobs by 2015 (Source: Altenative Energy/Clean Technology, EDB,
http://www.edb.gov.sg/).
9V. Marine and Coastal Plastic Waste
In Singapore, the Maritime and Port Authority of Singapore (MPA) enforces strict regulations on
pollution of the sea from ships within our port waters for ships visiting Singapore. MPA also
monitors the ships in port to ensure compliance to the regulations. Under Singapore’s Prevention of
Pollution of the Sea Act, it is an offence for any person to throw or deposit into Singapore waters
any refuse, garbage, plastics or waste matter. If convicted, offenders are liable to be fined up to a
maximum of S$10,000 or imprisoned for up to 2 years or both.
Marine plastic waste in Singapore waters and along Singapore’s coastline could be from inland
sources or brought in from elsewhere by tides.
The MPA employs a contractor to collect garbage from ships to ensure proper disposal and flotsam
retrieval. This ensures that waters are clean and safe for navigation. Garbage collection and flotsam
retrieval operations are conducted on a daily basis by a fleet of nine craft (four for garbage
collection, 5 for flotsam retrieval). In 2015, a total of 4257.89 tonnes of flotsam and garbage waste
was collected.
In 2013, the non-profit organization International Coastal Cleanup Singapore (ICCS) conducted
annual beach and mangrove cleanups and published the data on marine trash in Singapore. For the
ICCS 2013 study alone, 3,473 volunteers covered 19,476 meters of coastline and collected 14,448
kg (153,147 pieces) of marine trash. The average weight of marine trash collected by each volunteer
increased by 32% from 3.1 kg/person in 2002 to 4.2 kg/person in 2013. The average weight of
marine trash collected for each meter of coastline increased by 194% from 0.25 kg/m in 2002 to
0.74 kg/m in 2013 (Insights on Marine Trash in Singapore, August 12, 2014 by Eugene Tay, data
from ICCS).
The top 10 marine trash items collected in 2013 are shown in the following figure:
Figure C-7 Top 10 Marine Trash
10(Source: International Coastal Cleanup Singapore, ICCS)
Figure C-8 Types of Marine Trash Retrieved
The data shows that almost all the waste, other than cigarette butts, are related to plastic products.
VI. E-Waste Management
In 1996, Singapore acceded to the Basel Convention on the control of export, import and transit of
hazardous wastes which may include e-waste. Although its transboundary movement is restricted,
e-waste generated by households (such as used televisions, refrigerators, washing machines, hand
phones, computers, printers, batteries, electronic items, etc.) in Singapore is not regulated as toxic
industrial waste. There is currently no formal regulatory framework dealing with the management
of e-waste in Singapore. Reportedly, Singapore has an active second-hand market and effective
recycling initiatives, resulting in minimal e-waste ending up in its disposal facilities. Valuable
electronic scrap generated by industries are normally sold to local e-waste recycling facilities where
precious metals such as gold and platinum are extracted, and recovered materials such as plastics
are sent to local recycling companies (Source: E-waste disposal challenge 'not serious' in
Singapore, By Jamie Yap, April 3, 2013).
The statistical data (2014) published by NEA (Figure C-4) show that the amount of e-waste
generated is not significant. The amount of e-waste grouped under other wastes (together with
ceramics, silt, etc.) generated was 0.36 million tonnes/year and accounted for about 4.8% of total
waste streams of 7.51 million tonnes. NEA estimates that about 60,000 tonnes of electronic waste
(e-waste) are generated annually in Singapore, of which about 50 per cent are common household
IT products and home appliances while the rest are ICT equipment generated from the commercial
and industrial sectors (NEA, 12 November 2014, News Releases, Electronic Waste Management
Made Easier with Implementation of National Standard, http://www.nea.gov.sg).
11As there is no formal system of e-waste collection and recycling, there is no robust data on recycling
rates of e-waste available. It is assumed that the large second-hand market and informal recycling
sector handles most of the post-consumer e-waste in Singapore. Current e-waste recycling efforts
are voluntary initiatives launched by the private companies with the support of the government
agencies. One example is the joint effort by telecommunications company StarHub, e-waste
recycler TES-AMM and courier firm DHL that encourages consumers to dispose unwanted
cellphones, laptops and other electronics in collection bins (called RENEW bins) at various location
in Singapore. There are currently 235 RENEW bins at 180 locations around Singapore. (NEA’s
website on e-waste recycling, http://www.nea.gov.sg/energy-waste/3rs/e-waste-lamp-battery-
recycling/e-waste-recycling)
Another programme is a six-month trial initiated by Panasonic Asia-Pacific in partnership with
South East Community Development Council, the National Environmental Agency (NEA), Best
Denki, Cimelia and SembWaste. The programme’s recycling and participation rates will be
evaluated to determine the feasibility of extending it nationwide. The recycling initiative, called the
Heartland E-Waste Recycling Programme pilot, will try to reduce the quantity of heavy metals that
will go into the landfill, said the Director-General of the Environmental Protection Division at the
National Environment Agency (NEA). The mayor of South East District, said consumer e-waste is
less frequently recycled due to the lack of convenient collection options. The pilot will feature a
wide range of collection points, including 10 Residents’ Committee (RC) centres, five schools and
the Best Denki, retail outlet at Parkway Parade. The RC centres will also collect general recyclables
such as paper and plastic bottles. The Town Council will be providing removal services for bulky
items such as refrigerators to housing board residents in the district, while Best Denki will collect
bulky e-waste islandwide for a fee upon the purchase and delivery of new appliances. E-waste
collected under the programme will be sent to a recycler, Cimelia, to be segregated and for essential
raw materials, such as plastics and precious metals, to be retrieved. The general recyclables are then
sent to SembWaste, a private waste management company, for regular recycling (News released by
Panasonic Asia Pacific, July 2013).
In November 2014, a national standard on the management of end-of-life technology in ICT
equipment, Singapore Standard SS587:2013, was jointly announced by the National Environment
Agency (NEA) and the Singapore Standards Council at the Electronics Recycling Asia Conference
2014. The establishment of the standard aims to promote the adoption of best practices by
businesses and industries in managing their electronic waste, and raise awareness among businesses
and industries on environmentally responsible electronic waste management. To encourage the
adoption of SS587, SPRING Singapore is offering co-funding assistance for small and medium
enterprises (SMEs) through the Capability Development Grant, which supports up to 70 per cent of
the qualifying costs for the standard adoption. NEA also recognises the achievements of
organisations that have been successfully certified to the standard. A dedicated portal on NEA’s
website provides information and resources on SS587 and how to attain the certification (Source:
News Releases, Electronic Waste Management Made Easier with Implementation of National
Standard http://www.nea.gov.sg/corporate-functions/newsroom/news-releases/electronic-waste-
management-made-easier-with-implemention-of-national-standard).
12In November 2015, the National Environment Agency called for a tender to conduct a study on the
collection, recycling and management of e-waste.
http://www.nea.gov.sg/corporate-functions/newsroom/advisories/nea-to-conduct-study-on-
collection-recycling-and-management-of-e-waste
VII. Principle of Extended Producer Responsibility (EPR)-Singapore
Packaging Agreement
At present, Singapore does not have legislation on EPR. Nonetheless, Singapore has been exploring
new avenues such as establishing 3P (People, Private and Public) partnerships to achieve its
ambitious environmental goals.
Singapore packaging agreement
In 2007, NEA signed a voluntary agreement, the Singapore Packaging Agreement (SPA), with
industry and other parties to reduce packaging waste, which constitutes about one-third by weight
of Singapore’s domestic waste. The Agreement aims at creating an opportunity for the industry to
assume greater corporate responsibility to reduce their packaging waste and enjoy cost savings
through process and product improvements. At the same time, it offers a platform where companies
can share their experiences, exchange practical ideas and collaborate to develop cost-effective
solutions to reduce waste. 177 organisations, including industry associations, companies, and
NGOs, have signed this Agreement to date.
From 2007 to 2016, the signatories have cumulatively reduced about 32,000 tonnes of packaging
waste, resulting in cumulative savings of more than S$75 million in the material costs of locally
consumed products. Every year, the 3R Packaging Awards are presented to deserving SPA
signatories for their notable efforts and successful packaging waste reduction initiatives, such as
reduction of the thickness, weight or size of packaging, optimisation of production processes,
elimination of unnecessary packaging and changing the way of product package1.
On 22 October 2015, a packaging benchmarking database was launched to enable businesses to
discover the potential for improving their packaging design and use of materials, and spur them to
take action to reduce the amount of packaging in their products. This will ultimately help conserve
resources and reduce waste generation. To date, the database displays the packaging weight
benchmarks for sixteen product categories.
1 More details on the SPA, as well as the work done by the award winners in reducing waste may
be found at NEA’s website, http://www.nea.gov.sg/SPA.
13VIII. Greenhouse Gas (GHG) Emissions from Waste Sector
The most significant greenhouse gas (GHG) emitted in Singapore is carbon dioxide, primarily
produced by the burning of fossil fuels to generate energy used by the industry, commercial,
residential and transport sectors. The greenhouse gas emissions from agriculture, land-use change
and forestry sectors are negligible in comparison with the size of carbon stocks and in comparison
with other economic sectors.
Singapore’s emissions of carbon dioxide (CO2), methane (CH4) and nitrous oxide (N2O) were
estimated using the Revised 1996 Inter-governmental Panel on Climate Change (IPCC) Guidelines
for National Greenhouse Gas Inventories, in line with the user manual for the guidelines on national
communications from non-Annex I Parties.
Singapore’s greenhouse gas emissions for 2010 totalled 46,831.68 gigagram (Gg) CO2-equivalent.
The breakdown of emissions by type of gas is as shown.
Source: SINGAPORE’S THIRD NATIONAL COMMUNICATION AND FIRST BIENNIAL UPDATE REPORT, Under the United
Nations Framework Convention on Climate Change, December 2014, PUBLISHED BY National Environment Agency
Figure C-9 Percentage Contribution of Each Greenhouse Gas to Total Emissions
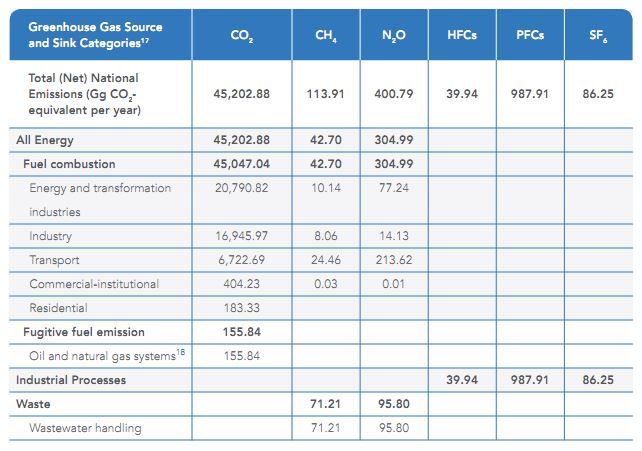
A breakdown of the total greenhouse gas emissions by sources for 2010 in gigagram (Gg) CO2
equivalent is shown in the table below.
14Source: SINGAPORE’S THIRD NATIONAL COMMUNICATION AND FIRST BIENNIAL UPDATE REPORT, Under the United
Nations Framework Convention on Climate Change, December 2014, PUBLISHED BY National Environment Agency
Figure C-10 Breakdown of the Total Greenhouse Gas Emissions 2010
1. Breakdown of emissions in the energy section
The combustion of fossil fuels to generate energy is the major source of CO2 emissions in Singapore.
The amount of CO2 emitted from the energy sector (fuel combustion) in 2010 was 45,047.04Gg.
The contribution of CO2 emissions from fuel combustion in the energy sector in 2010 is as shown.
15Source: SINGAPORE’S THIRD NATIONAL COMMUNICATION AND FIRST BIENNIAL UPDATE REPORT, Under the United
Nations Framework Convention on Climate Change, December 2014, PUBLISHED BY National Environment Agency
Figure C-11 Breakdown of CO2 Emissions from Fuel Combustion in the Energy Sector
2010
As heat from the incineration of waste is recovered to produce electricity in Singapore, CO2 and
N2O emissions from waste incineration are reported in the energy sector. According to the
IPCC Guidelines, CO2 emissions from waste incineration are estimated from the portion of the
waste that is fossil fuel based and the biomass fraction is excluded. Waste incineration was
estimated to contribute 1,183.86Gg of CO2 to the total greenhouse gas emissions in 2010.
2. Measures to reduce emissions
The Singapore Government will continue to raise awareness and build capabilities to improve
energy efficiency across the sectors. A major part of this effort involves addressing sector-specific
barriers using incentives or regulatory measures where appropriate. In order to reduce emissions,
the Singapore government has undertaken several measures as described as follows:
Shifting to Cleaner Energy Sources
Improving Industrial Energy Efficiency
Greening Buildings
Shifting Travel Demand to Low-Emission modes and Reducing vehicular Emissions
Improving Energy Performance Standards of Household Appliances and Promoting Energy
Efficiency to Households
Reducing Emissions from Waste and Wastewater Treatment
163. Reducing emissions from waste sector
The Singapore Government is also looking to reduce emissions from the waste and wastewater
sectors. Apart from incinerating our solid waste and used water sludge which reduces methane
emissions from landfills, the government also intend to increase the recycling rate to 70% by 2030
and are exploring more energy efficient technologies.
The government projects the mitigation measures in the solid waste and used water sector to achieve
0.15MT of CO2 eq abatement by 2020, with an estimated 0.06MT of CO2-eq in 2012.
Source: SINGAPORE’S THIRD NATIONAL COMMUNICATION AND FIRST BIENNIAL
UPDATE REPORT, Under the United Nations Framework Convention on Climate Change,
December 2014, PUBLISHED BY National Environment Agency
17D: EXPERT’S ASSESSMENT ON 3R POLICY IMPLEMENTATION
With limited land resources available for waste disposal, the National Environment Agency (NEA)
has adopted the following strategies to manage the growth in solid waste generation:
Minimise and segregate waste at source;
Develop cost-effective collection, recycling and disposal systems;
Build a resource-efficient society; and
Maximise energy and resource recovery as well as landfill lifespan
Today, Singapore has in place an integrated solid waste management system. Waste that is not
reused or segregated at source for recycling, is collected and sent to disposal facilities. All
incinerable waste is disposed of safely at waste-to-energy plants, while non-incinerable waste and
ash residues from the incineration process are disposed of at the offshore Semakau Landfill.
Singapore’s overall recycling rate has increased from 40% in 2000 to 60% in 2014. There is an
overall waste recycling rate target of 70% by 2030, as prescribed under the Sustainable Singapore
Blueprint. Singapore has achieved this through a combination of initiatives, including voluntary
partnerships, continued education and outreach on the 3Rs, funding schemes, industry development
and legislation. With more waste minimisation and recycling, less resources need to be set aside to
build disposal facilities, including freeing up land which can be used for other purposes.
18REFERENCES
EDB information on Altenative Energy/Clean Technology, Accessed October 30, 2017,
http://www.edb.gov.sg/
Gall, T.L. (ed.) (2007), Worldmark Encyclopedia of the Nations, 2007, Thomson Gale
International Coastal Cleanup Singapore (ICCS), Accessed October 30, 2017,
http://coastalcleanup.nus.edu.sg/
Green Future Solutions, Insights on Marine Trash in Singapore, August 12, 2014, Accessed October
30, 2017,
http://www.greenfuture.sg/2014/08/12/insights-on-marine-trash-in-singapore/
Ministry of the Environment and Water Resources (2014), Our Waste Situation 2014
Ministry of the Environment and Water Resources (2015), Sustainable Singapore Blueprint 2015,
Accessed October 30, 2017
http://www.mewr.gov.sg/ssb/files/ssb2015.pdf
NEA (2014), “Electronic Waste Management Made Easier with Implementation of National
Standard”, News Release on 12 November 2014
Accessed October 30, 2017
http://www.nea.gov.sg/corporate-functions/newsroom/news-releases/electronic-waste-
management-made-easier-with-implemention-of-national-standard
NEA (2014): SINGAPORE’S THIRD NATIONAL COMMUNICATION AND FIRST BIENNIAL
UPDATE REPORT, Under the United Nations Framework Convention on Climate Change,
December 2014, National Environment Agency
NEA (2015), “NEA to conduct study on collection, recycling and management of E-waste”,
Advisories released on 18 September 2015
http://www.nea.gov.sg/corporate-functions/newsroom/advisories/nea-to-conduct-study-on-
collection-recycling-and-management-of-e-waste
NEA (2017), 3R Guidebook for Hotels, Published on 1 July 2011 and updated on 24 January 2017
Accessed October 30, 2017
http://www.nea.gov.sg/docs/default-source/energy-waste/recycling/3r-guidebook-for-hotels
NEA (N.D.), E-waste recycling website
Accessed October 30, 2017
http://www.nea.gov.sg/energy-waste/3rs/e-waste-lamp-battery-recycling/e-waste-recycling
19Panasonic Asia Pacific (2013), “Panasonic Initiates Pilot Heartland E-Waste Recycling Programme
for Home Appliances in Singapore” News release on 5 July 2013
Accessed October 30, 2017
https://www.panasonic.com/sg/corporate/news/article/201307-panasonic-initiates-pilot-
heartland-e-waste-recycling-programme-.html#.WfaMmFt-phE
Singapore National Environment Agency (NEA) website
Accessed October 30, 2017
http://www.nea.gov.sg/
Singapore Packaging Agreement website
Accessed October 30, 2017
http://www.nea.gov.sg/energy-waste/3rs/singapore-packaging-agreement
Singapore Department of Statistics website
Accessed October 30, 2017
http://www.singstat.gov.sg/
Yap, “J. E-waste Disposal challenge ‘not serious’ in Singapore”, ZD-NET, April 3, 2013
http://www.zdnet.com/article/e-waste-disposal-challenge-not-serious-in-singapore/
20You can also read