Western Sydney Waste Management: Capacity, Needs and Infrastructure - A submission to the Australian Council of Recycling 7/12/2018 - Australian ...
←
→
Page content transcription
If your browser does not render page correctly, please read the page content below
Western Sydney Waste
Management: Capacity,
Needs and Infrastructure
A submission to the Australian Council of Recycling

7/12/2018
Mike Ritchie & Associates Pty Ltd trading as MRA Consulting Group (MRA)
ABN 13 143 273 812
Suite 409 Henry Lawson Building
19 Roseby Street, Drummoyne NSW 2047
AUSTRALIA
P +61 2 8541 6169
E info@mraconsulting.com.au
mraconsulting.com.au

This report is intended to be a set of information, ideas and recommendations to foster debate about
optimal resource recovery in Western Sydney only.
All data estimates on waste flows are provisional only, based on key assumptions, subject to sensitivity
analysis and necessarily limited by data access and management issues in NSW.

Document

Author                Nav Grewal, Matt Hyatt, Jess Braun, Esther Hughes

Checker               Mike Ritchie

Approver              Mike Ritchie

Document history

Version no.            Status                Date
1                      Draft                 20/11/18

2                      Draft                 22/11/18

3                      Draft                 22/11/18

4                      Draft                 23/11/18

5                      Draft                 30/11/18

6                      Final Draft           7/12/18

Disclaimer
This report has been prepared by Mike Ritchie and Associates Pty Ltd (trading as MRA Consulting Group
(MRA)) for the Australian Council of Recycling. MRA (ABN 13 143 273 812) cannot accept any responsibility
for any use of or reliance on the contents of this document by any third party.

                                     ACOR – Western Sydney Waste Management                                 ii
Executive Summary
Western Sydney is experiencing a significant increase waste generation due to population increases and
high-levels of infrastructure development. This growth offers enormous potential for job growth
opportunities in Western Sydney. This report evaluates current waste flows in the region and the
forecasted demand for additional waste processing capacity by 2021-22.
Waste infrastructure Requirements
Western Sydney is considered the “waste hub” of Greater Sydney, due to the high concentration of waste
processing facilities in the region. Facilities in Western Sydney do not just process waste generated in the
Western Sydney region, but for the rest of Greater Sydney as well.
As waste generation rates across municipal, commercial, and construction waste streams increase, it is
necessary to ensure that there is sufficient waste processing capacity to meet the region’s (and broader
Sydney’s) needs in the future.
The NSW Waste Strategy has set the following resource recovery targets for 2021-22:
     •    70% for municipal solid waste (MSW)
     •    70% for commercial and industrial (C&I) waste
     •    80% for construction & demolition (C&D) waste
Table 1 below summarises the estimated 2021-22 capacity and investment requirements for MSW, C&I and
C&D waste, and the high-level economic benefits of investment in the sector.
There are 3 key caveats for this analysis:
     1. C&I on-site sorting is assumed to be constant but increases in the levy will drive additional on-site
        sorting.
     2. It is assumed that 9.2 jobs are created for every 10,000 tonnes per annum of additional recycling
        capacity built (Deloitte Access Economics, 2009). This figure is an average across all waste streams
        and is likely to be an overestimate for C&D job creation.
     3. The analysis on current processing capacity does not include facilities in the pipeline. These
        proposals still need government to champion approval, particularly through local government.
A total of 5.18 million tonnes per annum of additional capacity from 36 new facilities will be required by
2021-22 to meet state resource recovery targets. Up to 4,7661 jobs will be created through the
development of this infrastructure. $994 million of capital investment is required, and $1.1 billion of
economic value per annum will be generated from gate fees.

1It is unlikely that all the identified infrastructure needs will be met by 2021-22. Therefore, these figures for job creation will be
spread over the time it takes to build and commission these facilities.

                                           ACOR – Western Sydney Waste Management                                                        iii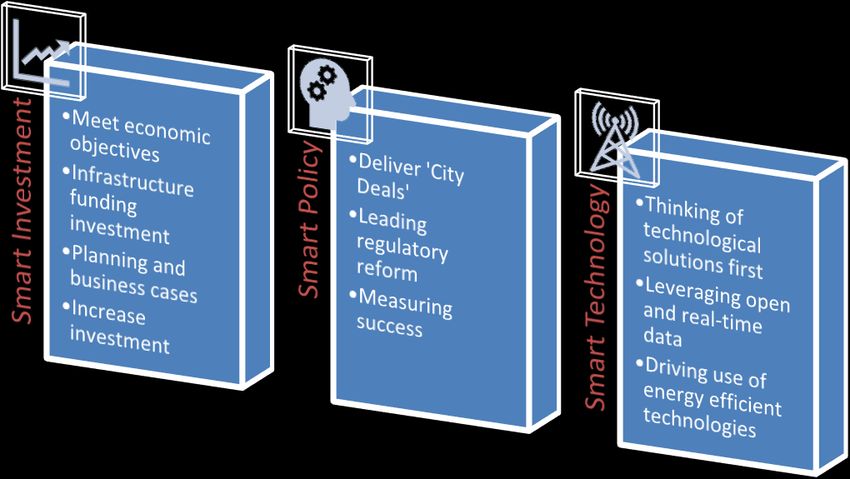
Table 1: 2021-22 infrastructure requirements and economic benefits
                       Residual       Residual
                                                   Recyclable         Organic
                       MSW to         MSW to                                         C&I           C&D           Total
                                                     MSW               MSW
                        AWT             EfW
    Additional
   processing
  capacity (tpa)
   required to
                       120,000        140,000        90,000            80,000      1,500,000    3,250,000     5,180,000
  meet 2021-22
     resource
     recovery
      targets
                                                                        Two         Fifteen      Thirteen
                         Two            One          Three
                                                                     40,000 tpa    100,000       250,000
     Facilities       60,000 tpa      140,000      30,000 tpa
                                                                      organics      tpa C&I      tpa C&D          36
     required            AWT          tpa EfW         MRF
                                                                     processing       MRF       processing
                       facilities      facility     facilities
                                                                      facilities   facilities    facilities
   Jobs created          111            129             83               74         1,380         2,990          4,766
      Capital           $120           $300                                         $450                         $994
                                                   $18 million       $60 million                $46 million
    investment          million        million                                      million                     million
 Economic value                                                                     $390          $585
                     $36 million    $42 million    $14 million       $14 million                              $1.1 billion
   per annum                                                                        million       million

Recommendations to government
    •    Government should recognise the significant economic benefits and jobs growth potential that the
         recycling industry offers for Western Sydney.
    •    Plan the investment horizon to facilitate development of new infrastructure worth $1 billion of
         capital investment
    •    The waste and recycling industry requires government leadership in the form of planning and policy
         to achieve waste diversion targets in Sydney:
              o    The development of industrial ecology parks should be considered to co-locate new waste
                   processing infrastructure and provide synergies for resource recovery operations in
                   Western Sydney. These will also serve to preserve buffers around waste assets.
              o    Focus more of the Waste Less Recycle More grant funding on infrastructure
              o    Develop a priority infrastructure plan
              o    Coordinate with industry via new governance and engagement processes
              o    Accelerate government procurement of recycled content products in infrastructure
                   developments.

                                       ACOR – Western Sydney Waste Management                                             iv
Contents
Executive Summary .......................................................................................................................................... iii
Contents ............................................................................................................................................................ v
List of Tables ..................................................................................................................................................... vi
1 Introduction................................................................................................................................................... 1
2 Waste processing infrastructure ................................................................................................................... 2
3 Waste generation forecasts and infrastructure gaps in Sydney ................................................................... 4
   3.1 Municipal Solid Waste ........................................................................................................................... 4
           3.1.1 AWT facilities – Household Residual Waste ................................................................................ 4
           3.1.2 EfW facilities – Household Residual Waste ................................................................................. 5
           3.1.3 MRF – Household Recycling ......................................................................................................... 6
           3.1.4 Composting – Household Organic Waste .................................................................................... 6
   3.2 Commercial & Industrial Waste ............................................................................................................ 6
   3.3 Construction & Demolition Waste ........................................................................................................ 7
   3.4 Summary ............................................................................................................................................. 12
4 Other recommendations to government .................................................................................................... 13
   4.1 Industrial Ecology Parks ...................................................................................................................... 13
   4.2 Focus grant funding on waste processing infrastructure development ............................................. 13
   4.3 Develop priority infrastructure plan ................................................................................................... 14
   4.4 Governance and engagement with industry ....................................................................................... 14
   4.5 Positive procurement of recycled content products in infrastructure developments ....................... 15
5 Conclusion ................................................................................................................................................... 16
Appendix A               Other key considerations ...................................................................................................... 18

                                                    ACOR – Western Sydney Waste Management                                                                           v
List of Tables
Table 1: 2021-22 infrastructure requirements and economic benefits ............................................................ iv
Table 2: List of selected waste facilities in Greater Sydney............................................................................... 2
Table 3: MSW waste generation forecasts ........................................................................................................ 4
Table 4: Residual waste generation forecast .................................................................................................... 4
Table 5: Approved major infrastructure projects in Greater Sydney (Currently in development) ................... 7
Table 6: Potential upcoming infrastructure projects in Greater Sydney (Possible future developments) ....... 8
Table 7: 2021-22 infrastructure requirements and economic benefits .......................................................... 12
Table 8: Waste Less Recycle More grant program summary .......................................................................... 13
Table 9: 2021-22 infrastructure requirements and economic benefits .......................................................... 16
Table 10: Key reforms enforced by the Protection of the Environment Operations Legislation Amendment
(Waste) Regulation 2018 ................................................................................................................................. 20
Table 11: Richmond Review recommendations .............................................................................................. 22
List of Figures
Figure 1: Selected waste facilities in Greater Sydney........................................................................................ 3
Figure 2: Estimated waste generation from major infrastructure projects (MRA) ........................................... 9
Figure 3: Approved major infrastructure projects for Greater Sydney ........................................................... 10
Figure 4: Three pillars of Smart Cities Plan...................................................................................................... 19
ACOR – Western Sydney Waste Management vi1 Introduction
The Australia Council of Recycling (ACOR) has organised a roundtable discussion on the materials
management opportunity in Western Sydney inviting key stakeholders including government ministers,
government advisors, waste industry representatives, consultants, and other government agency
representatives.
ACOR engaged MRA Consulting Group to present a brief on the needs and opportunities for resource
recovery infrastructure in Sydney at present and in the near future.
The resource recovery sector provides significant opportunities for job creation. Jobs in resource recovery
are largely recession proof as recycling rates do not generally swing as high or as low as the broader
economy. According to the Federal Department of the Environment and Energy, resource recovery
generates many more jobs than landfill for managing the same quantity of waste. The estimated direct Full
Time Equivalent (FTE) employment per 10,000 tonnes of waste is 9.2 for recycling and 2.8 for landfill
disposal (Access Economics, 2009).
Currently the recycling sector employs over 50,000 people and is worth over $14 billion per year while it
also is one of the fastest growing manufacturing sectors in Australia. These are green, sustainable jobs
covering technical (engineering, chemistry, science), commercial (sales, business) and operational skills.
The predicted population and housing growth in the Sydney Metropolitan Area, construction of major
infrastructure projects such as the Badgerys Creek Airport as well as the flow of waste back to NSW with
the introduction of the waste levy in Queensland is expected to provide many challenges and opportunities
for the resource recovery industry in Sydney, particularly the lack of sufficient processing capacity for the
future.
The majority of Sydney’s resource recovery infrastructure is located in Western Sydney. Government
should recognise the essential services provided by the sector and its significant contribution to economic
growth. Investment in the resource recovery sector provides opportunities for increased employment,
better environmental outcomes and increased rates of diversion from landfill.
Finding solutions to the barriers to entry for new resource recovery infrastructure and the expansion or
modification of existing resource recovery infrastructure is key to unlocking the potential of the sector in
the near term.
The structure of the report is as follows:
1. List and map of current waste processing infrastructure in Sydney
2. Waste generation forecasts and infrastructure gaps in Sydney
3. Other recommendations to government
4. Conclusion
5. Appendix (Other considerations)
ACOR – Western Sydney Waste Management 12 Waste processing infrastructure
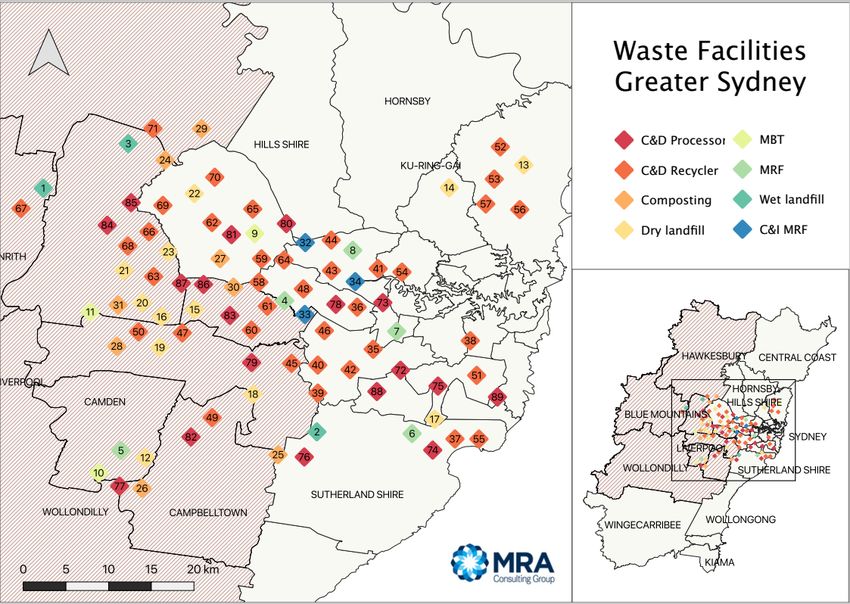
The Western Sydney region hosts the majority of Greater Sydney’s waste management facilities. There are
also a number of facilities outside of Western Sydney that serve the region. Major waste facilities servicing
the Western Sydney region are pictured in Figure 1 and listed in Table 2.
Table 2: List of selected waste facilities in Greater Sydney
No. Name and No. Name and No. Name and Operator No. Name and Operator
Operator Operator
Blaxland Waste
Scotts Australia
1 Management 24 47 Brandown 70 Back to Earth The Mulch Makers
Berkshire Park
Facility
2 SUEZ Lucas Heights 25 SUEZ Lucas Heights 48 The Brick Pit 71 Rock & Dirt Recycling
Hawkesbury City
Waste
3 26 SUEZ Camden 49 Affordable Pallets 72 Loumbos
Management
Facility
4 VISY Smithfield 27 SUEZ Eastern Creek 50 ANL Badgerys Creek 73 SUEZ Auburn
Sell & Parker
5 SUEZ Spring Farm 28 ANL Badgerys Creek 51 74 Remondis Taren Point
Banksmeadow
6 VISY Taren Point 29 Bettergrow 52 Kimbriki 75 SUEZ Rockdale
7 Polytrade Enfield 30 Veolia Horsley Park 53 ANL Terrey Hills 76 SUEZ Lucas Heights
Polytrade
8 31 SUEZ Kemps Creek 54 Darvin 77 SUEZ Spring Farm
Rydalmere
Global Renewables
9 32 Wastefree 55 ReGYP Kurnell 78 Bingo Auburn
UR-3R
Liverpool Community Recycling
10 SUEZ Spring Farm 33 Doyle Bros 56 A E Biggs 79
Centre
Benedict Recycling
11 SUEZ Kemps Creek 34 SUEZ Camellia 57 80 SUEZ Seven Hills
Belrose
12 SUEZ Spring Farm 35 Has-a-bin 58 Boral Recycling 81 Cleanaway Blacktown
Cooke's Metal
13 Kimbriki 36 59 IS Recycling 82 Cleanaway Environmental
Recyclers
Kurnell Landfill
14 Greenwood Landfill 37 60 Abbey Pallets 83 SUEZ Wetherill Park
(Breen)
Sims Metal Sustainable Resource
15 Veolia Horsley Park 38 61 84 Cardboard King
Alexandria Centre
Sydney Recycling Sims Metal Cleanaway
16 39 62 85 Bingo St Marys
Park Wanless Milperra Glendinning
Kurnell Landfill Expanded Polymer Cleanaway Erskine
17 40 63 86 Veolia Horsley Park
(Breen)* Solutions Park
Glenfield Waste
18 41 Concrete Recyclers 64 ANL Seven Hills 87 Genesis Xero Waste
Services
Gow Street Sell & Parker Kings
19 Brandown 42 65 88 Bingo Mortdale
Recycling Centre Park
SUEZ Elizabeth
20 43 Thuroona Services 66 Enviro Pallets 89 Bingo Banksmeadow
Drive
Parramatta Scrap Blaxland Waste
21 Patons Lane 44 67
Metal Management Facility
Blacktown Waste Benedict Recycling
22 45 68 Sims Metal St Marys
Services Chipping Norton
Dial a Dump Total Scrap Metals
23 46 69 Camel's Bins
Industries Recycling
ACOR – Western Sydney Waste Management 2Figure 1: Selected waste facilities in Greater Sydney
ACOR – Western Sydney Waste Management 33 Waste generation forecasts and infrastructure gaps in
Sydney
There are 3 significant caveats for this analysis:
1. C&I on-site sorting is assumed to be constant (but increases in the levy will drive additional on-site
sorting).
2. It is assumed that 9.2 jobs are created for every 10,000 tonnes per annum of additional recycling
capacity built (Deloitte Access Economics, 2009). This figure is an average across all waste streams
and is likely to be an overestimate for C&D job creation.
3. The analysis on current processing capacity does not include facilities in the pipeline. These
proposals still need government to champion approval, particularly through local government.
3.1 Municipal Solid Waste
The number of dwellings in the Sydney Metropolitan Area in 2014-15 was 1,549,281 and is forecasted to
increase by 22% to 1,891,500 by 2021. Applying the 22% growth to municipal waste generation in the SMA
gives the forecasted MSW waste generation by stream summarised in Table 3 below.
Table 3: MSW waste generation forecasts
Year No of Residual Recyclable Organic waste
households waste waste generated
generated generated
2014-15 1,549,281 1,092,207 384,319 326,140
2021 1,891,500 1,333,463 469,211 398,181
forecast
Increase 342,219 241,256 84,892 72,041
New developments in the region will be both Multi Unit Dwellings (MUDs) and Single Unit Dwellings (SUDs).
High density dwellings are expected in the urban centres while the suburbs projected to be created as
multiple greenfield sites are released will predominantly be standalone houses and row houses. In view of
the high population growth of the Western Sydney region, the pressure on waste management systems will
grow significantly.
3.1.1 AWT facilities – Household Residual Waste
Approximately 500,000 tpa of residual MSW is sent to AWT (Alternative Waste Treatment) facilities, with
the remaining 592,207 tonnes to landfill. The forecasted increases in demand for AWT and disposal of
residual waste are listed in Table 4 below.
Table 4: Residual waste generation forecast
Year Residual waste Residual waste
to AWT direct to
disposal
2014-15 500,000 592,207
ACOR – Western Sydney Waste Management 42021 610,444 723,019
forecast
Increase 110,444 130,812
There will be a 110,444 tpa increase in demand for additional AWT facilities. AWT capacity for Sydney is
currently constrained with the 4 facilities servicing the region already operating at capacity.
To meet this additional demand by 2021, two 60,000 tpa AWT facilities would be required.
AWT summary
An additional two 60,000 tpa AWT facilities are required by 2021.
The economic benefits of meeting the additional capacity requirement for AWT facilities is as follows:
• 111 jobs created
• $120 million2 capital investment
• $36 million3 in gate fee revenues per year
[MRA notes the October 2018 decision of the NSW EPA to restrict the application of AWT Municipal Waste
Organic Outputs (MWOO) to land in NSW. This has significantly altered the potential future growth in the
AWT sector and particularly investment in new plants. If the limitation on the use of MWOO is maintained
then all of the diversion attributed to AWT will need to be achieved through commensurate growth in
FOGO processing. The current absence of policy clarity makes the allocation task impractical.]
3.1.2 EfW facilities – Household Residual Waste
An additional 130,812 tpa of residual waste will be disposed directly by 2021. The two main putrescible
landfills servicing the SMA are Suez Lucas Heights and Veolia Woodlawn. These facilities currently accept a
combined 1.6 million tonnes per annum (including approximately 500,000 tpa of C&I waste). It is expected
that there is sufficient capacity to accept this additional waste by 2021.
An alternative solution for disposal of the additional residual waste is the development of an energy-from-
waste (EfW) facility. A single 140,0004 tpa capacity facility would be able to meet this additional demand.
EfW summary
One additional 140,000 tpa EfW facility is required by 2021.
The economic benefits of a 140,00 tpa EfW facility are summarised below:
• 129 jobs created
• $300 million capital investment
• $42 million5 in gate fee revenues per year
2 Capital expenditure of $60 million per AWT facility
3 Gate fee revenue of $300/t
4 Note that this does not include further potential demand for incineration of C&I waste
5 Gate fee revenue of $300/t
ACOR – Western Sydney Waste Management 53.1.3 MRF – Household Recycling
384,319 tonnes of MSW recyclables was generated in the SMA in 2014-15 and is forecasted to increase to
469,211 by 2021. The four Material Recovery Facilities (MRFs) servicing the SMA are operating close to or
at capacity.
There will be an 84,892 tpa increase in demand for additional MRF capacity by 2021. To meet this
additional demand, three new 30,000 tpa MRF facilities would be required.
MRF summary
An additional three 30,000 tpa MRF facilities are required by 2021.
The economic benefits of meeting the additional capacity requirement for MRF facilities is as follows:
• 83 jobs created
• $18 million6 capital investment
• $14 million7 in gate fee revenues per year
3.1.4 Composting – Household Organic Waste
326,140 tonnes of organic waste were generated in the SMA in 2014-15 and is forecasted to increase to
398,181 by 2021. Organics processing infrastructure servicing the SMA is at capacity.
There will be a 72,041 increase in demand for additional organics processing capacity by 2021. To meet this
additional demand, two new 40,000 tpa organics processing facilities would be required.
Composting summary
An additional two 40,000 tpa organics processing facilities are required by 2021.
The economic benefits of meeting the additional capacity requirement for composting facilities is as
follows:
• 74 jobs created
• $60 million8 capital investment
• $14 million9 in gate fee revenues per year
3.2 Commercial & Industrial Waste
Commercial and Industrial (C&I) waste remains a major challenge with recycling rates in the sector
remaining relatively low. The NSW EPA’s WARR Strategy targets a 70% recycling rate for C&I waste by 2021-
22.
The 2016 National Waste Report10 reported that only 56% of C&I waste was recovered in 2014-15. This
amounts to approximately 1.85 million tonnes currently being recovered in Sydney. By 2021-2022,
approximately 3.7 million tonnes of C&I waste will be generated in Sydney. To meet the 70% target, 2.59
million tonnes must be recovered in 2021-22.
6 Capital expenditure of $6 million per MRF facility
7 Gate fee revenue of $150/t
8 Assumed capital expenditure of $30 million per composting facility
9 Assumed gate fee revenue of $180/t
10 http://www.environment.gov.au/protection/waste-resource-recovery/national-waste-reports/national-waste-report-2016
ACOR – Western Sydney Waste Management 6There are only three small C&I MRFs in Sydney (SUEZ Camellia, Waste Free and Doyle Bros) sorting mixed
commercial waste into reusable products for sale. The combined processing capacity of these facilities is
approximately 100,000 tonnes per annum.
The majority of C&I recycling happens on site at waste generator locations via source separation. Assuming
that the C&I sector has achieved maximum source separation potential, an additional 740,000 tpa of C&I
waste must be recovered in 2021-22 to meet the 70% target.
Assuming a C&I MRF efficiency of 50%, an additional 1.47 million tonnes of C&I processing capacity is
required. Fifteen 100,000 tpa facilities at 50% recovery rate would be required to meet the 70% target.
C&I MRF summary
An additional fifteen 100,000 tpa C&I processing facilities are required by 2021-22 to meet the 70%
diversion target.
The economic benefits of meeting the additional capacity requirement for C&I MRFs is as follows:
• 1,380 jobs created
• $450 million11 capital investment
• $390 million12 in gate fee revenues per year
3.3 Construction & Demolition Waste
The construction industry in Sydney is currently experiencing an unprecedented level of investment and
activity. The government has significantly increased spending on large infrastructure projects such as
WestConnex, Sydney Metro and the Western Sydney Airport. These projects are currently generating and
will continue to generate large amounts of C&D waste for the foreseeable future.
The forecasted cost and delivery date of the approved major waste generating projects in the Greater
Sydney area are provided in Table 5, and potential waste generating projects in Table 6 13,14.
Table 5: Approved major infrastructure projects in Greater Sydney (Currently in development)
Project Forecasted Costs Delivery due date
Western Sydney Airport $5.3 billion 2026 at earliest
WestConnex $16 billion Finishes 2023
Sydney Metro (Northwest Stage) $10.5 billion Mid 2019
Sydney Metro (City & South West) $8.9 billion 2024
Pacific Highway Upgrades $4.9 billion 2019
Parramatta Light Rail $1 billion Stage 1 – 2023; Stage 2/3 - unknown
NorthConnex $3.1 billion 2020
Westmead Redevelopment Project $1 billion 2022
Western Sydney Infrastructure Plan – road projects $3.6 billion Early 2020’s
Education Infrastructure NSW $6.8 billion Funds committed in 2018-19 budget and
tenders expected to progressively put to
market
11 Assumed capital expenditure of $30 million per C&I MRF facility
12 Assumed gate fee revenue of $260/t
13 http://www.infrastructure.nsw.gov.au/media/1682/nsw_infrastructure_pipeline_july-2018-web-version.pdf
14 https://ia-priority-list.herokuapp.com/pdf
ACOR – Western Sydney Waste Management 7Project Forecasted Costs Delivery due date
M4 Smart Motorways Stage 1-3 $470 million Late 2020
Moorebank intermodal freight terminal $1.8 billion 2030
Easing Sydney’s congestion $1.7 billion 2021
Other projects $10.2 billion Various
Table 6: Potential upcoming infrastructure projects in Greater Sydney (Possible future developments)
Project Forecasted Costs Stage of Development
F6 Extension Stage 1 $2.2 to 2.6 billion Investment approved
Campbelltown Hospital Redevelopment (Stage 2) $632 million Final business case
Nepean Hospital Redevelopment (Stages 1 & 2) $1 billion Procurement
Rouse Hill Health Service $300 million Planning
Randwick Campus Redevelopment $720 million Progress planning
Concord Hospital Redevelopment $341 million Investment approved
New Museum of Applied Arts and Sciences (MAAS) $645 million Investment approved
government
contribution
Stadium Australia $810 million Business case development
Liverpool Health and Academic Precinct $740 million Business case development
Port Botany Rail Line Duplication $400 million Planning
Central Station Precinct Renewal Over $1 billion Planning
Circular Quay Upgrade $200 million Procurement
Badgerys Creek Aerotropolis precinct unknown Planning
Western Harbour Tunnel and Beaches Link unknown Final business case
Sydney Gateway – Airport and Port Botany unknown Business case development
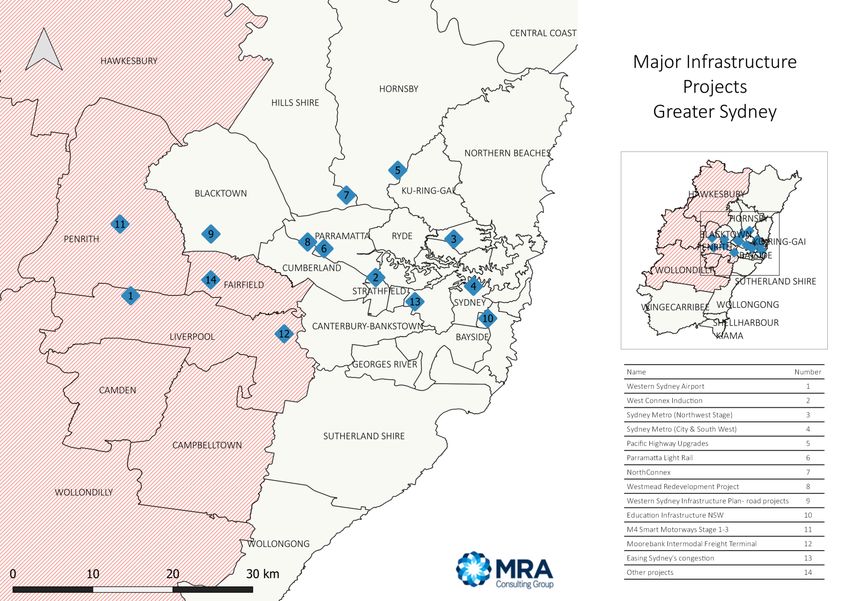
ACOR – Western Sydney Waste Management 8Figure 2 below shows the estimated C&D waste generation from these projects over time. Figure 3 on page
10 shows the locations of the approved projects.
Figure 2: Estimated waste generation from major infrastructure projects (MRA)
Other Projects
4
Easing Sydney's congestion
3.5 Moorebank intermodal freight terminal
M4 Smart Motorways Stage 1-3
Waste Generated (million tonnes)
3
Education Infrastructure NSW
2.5 Western Sydney Infrastructure Plan –
road projects
Westmead Redevelopment Project
2
NorthConnex
1.5
Parramatta Light Rail
Pacific Highway upgrades
1
Sydney Metro North West (NWRL)
0.5
Sydney Metro
0 WestConnex
Western Sydney Airport
ACOR – Western Sydney Waste Management 9Figure 3: Approved major infrastructure projects for Greater Sydney
ACOR – Western Sydney Waste Management 10Based on historical correlations between C&D waste generation and construction spending, MRA estimates
that 0.4 million tonnes of C&D waste is generated for every $1 billion spent. On the basis of announced
government expenditure on infrastructure projects we predict that 2.73 million tonnes of C&D waste will
be generated by these projects in 2021-22.
MRA estimates that a total of 9.5 million tonnes of C&D waste will be generated in the SMA in 2021-22,
including the return of waste to Queensland. The WARR Strategy sets an 80% recycling rate target for C&D
waste by 2021-22. To meet the 80% recycling target, 7.64 million tonnes need to be recovered.
MRA estimates that 5.13 million tonnes of C&D waste was processed in the SMA in 2018. An additional
2.51 million tonnes of C&D waste must be recovered in 2021-22 to meet the 80% target. Assuming a C&D
processing yard efficiency of 80%, an additional 3.13 million tonnes of C&D processing capacity is required.
Thirteen 250,000 tpa facilities at 80% recovery rate would be required to meet the 80% diversion target.
C&D Summary
An additional thirteen 250,000 tpa C&D processing facilities are required by 2021-22 to meet the 80%
diversion target.
The economic benefits of meeting the additional capacity requirement for C&D processing facilities is as
follows:
• 2,990 jobs created
• $46 million15 capital investment
• $585 million16 in gate fee revenues per year
15 Assumed capital expenditure of $3.5 million per C&D processing facility
16 Assumed gate fee revenue of $180/t
ACOR – Western Sydney Waste Management 113.4 Summary
Table 7 below summarises the estimated 2021-22 capacity and investment requirements for MSW, C&I and
C&D waste, and the high-level economic benefits of investment in the sector.
Table 7: 2021-22 infrastructure requirements and economic benefits
Residual Residual
Recyclable Organic
MSW to MSW to C&I C&D Total
MSW MSW
AWT EfW
Additional
processing
capacity (tpa)
required to
120,000 140,000 90,000 80,000 1,500,000 3,250,000 5,180,000
meet 2021-22
resource
recovery
targets
Thirteen
Two One Three Two 40,000 Fifteen
250,000 tpa
Facilities 60,000 140,000 30,000 tpa tpa organics 100,000 tpa
C&D 36
required tpa AWT tpa EfW MRF processing C&I MRF
processing
facilities facility facilities facilities facilities
facilities
Jobs created 111 129 83 74 1,380 2,990 4,766
Capital $120 $300 $450 $994
$18 million $60 million $46 million
investment million million million million
Economic value $36 $390 $1.1
$42 million $14 million $14 million $585 million
per annum million million billion
ACOR – Western Sydney Waste Management 124 Other recommendations to government
4.1 Industrial Ecology Parks
Industrial Ecology (IE) provides a useful framework for planning waste infrastructure. Waste from one
industrial process can serve as the raw material for another, thereby reducing the impact of industry on the
environment (Frosch and Gallopoulos, 1989).
IE parks contains multiple facilities in which businesses cooperate with one another to reduce waste and
pollution, efficiently share resources (such as information, materials, water, energy, infrastructure, and
natural resources), and help achieve sustainable development, with the intention of increasing economic
gains and improving environmental quality.
IE parks allow for potentially shared logistics, shipping/receiving facilities, and even shared local education
and resource centres. This systematic approach allows for integrated activities between facilities and
ensures the recovery of valuable resources generated by waste streams on-site and offsite, which would
otherwise be lost. This helps to bring about a step-change towards a circular economy.
Local industry would significantly benefit from the development of new waste infrastructure in industrial
ecology parks.
MRA recommends that the Department of Planning consider the establishment of IE parks to collocate
waste processing infrastructure.
4.2 Focus grant funding on waste processing infrastructure development
A proportion of NSW waste levy is used to support the waste and recycling industry by providing funding
for grants under the Waste Less Recycle More (WLRM) program. Phase 2 of WLRM will cover July 2017-
June 2021 and is expected to award $337 million over 4 years. A number of grant packages have been
announced focusing on different sectors of waste management.
Table 8 below is a summary of the funding breakdown of the WLRM program.
Table 8: Waste Less Recycle More grant program summary
Grant Package Grant value
Local Government Waste & $70m
Resource Recovery Program
Waste and Recycling $168m
Infrastructure Package
Illegal Dumping Fund $65m
Litter Prevention and $30m
Enforcement Fund
Heads of Asbestos Coordination $4m
Authorities programs
ACOR – Western Sydney Waste Management 13Of the $337 m Waste Less Recycle More package, $168 million is allocated to the Waste and Recycling
Infrastructure Package. However, of this only $47 million is for actual new waste processing facilities or
upgrades. That is, infrastructure development receives only 13.9% of WLRM funding yet is the most urgent
requirement to achieve the State Government landfill diversion targets.
To help achieve landfill diversion targets, Government should redirect further funding into the
infrastructure package and prioritise projects that target the identified gaps in processing infrastructure.
The NSW Government is missing out on over $126m annually in landfill levy revenues due to the transport
of waste to QLD (900,000t/yr transport of waste to QLD landfills). If and when waste to Queensland is
constrained (via the proposed Queensland levy) it is likely that a significant component of these tonnes will
be landfilled in NSW contributing to additional landfill levy revenues. A significant proportion of these funds
(up to the $126m) could and should be used to fund the necessary new infrastructure. This would have no
effect on the current allocations of landfill levy monies to other State programs such as roads and hospitals.
4.3 Develop priority infrastructure plan
The NSW Government should consider the development of a priority infrastructure plan to ensure waste
management/processing infrastructure is developed in a timely manner to cope with the current and
future needs of NSW.
A priority infrastructure plan is needed to assess, prioritise, and support the development of waste
management/processing infrastructure as required and is important to ensure that future resource
recovery targets are met. It is a precursor to a pipeline of investment and the growth in resource recovery
jobs creation.
4.4 Governance and engagement with industry
The NSW Government should consider more focussed Governance arrangements such as those applied in
VIC, SA and WA, wherein dedicated agencies pursue the waste reduction and improved recycling programs
independent of the EPA regulatory enforcement function. The NSW EPA struggles to fulfil both functions
with clarity.
Irrespective of governance structures, the Government should recognise industry’s willingness to invest in
the infrastructure necessary to achieve the State Government waste targets and engage proactively with
industry leaders to fast-track the necessary investment. All too often the main interaction between industry
and Government is through lengthy planning approval processes or enforcement proceedings via the EPA.
This insufficiently recognises the strategic role of infrastructure and the investment required to achieve the
State Government’s objectives for landfill diversion, economic growth and jobs creation.
Government should:
• Examine options to facilitate industry investment via the Industry and Planning portfolios as well as
the Environment Department;
• Enhance ongoing communication with industry representative bodies; and
• Separate the roles of Chair of the EPA from that of CEO of the EPA so that there is continuity of
relationships with industry when one role is vacant.
ACOR – Western Sydney Waste Management 144.5 Positive procurement of recycled content products in infrastructure
developments
There is potential for a large proportion of C&D materials and to a lesser degree MSW and C&I materials to
be recycled into new products for use in infrastructure projects, examples include:
• the use of tunnelling spoil and excavated materials as clean fill;
• the production of recycled aggregate which consists on crushed concrete, bricks and ceramics for
pipe embedment works, retaining walls and drainage;
• the use of recycled glass fines trademarked as GlassSand for pipe embedment works by Sydney
Water17;
• Sutherland Shire Council and Downer in collaboration with Close the Loop, RED Group and Plastic
Police used waste products soft plastics, glass and toner as well as recycled asphalt to build a road,
the first in NSW to use soft plastics in road construction18;
• the use of bollards, decking, fences, outdoor furniture and signs manufactured from recycled
plastic waste by Replas19.
The NSW EPA has provided a funding framework for the continued and improved use of recycled content
products thorough the following programs20:
• grants from $50,000 - $1 million for the Product Improvement Program;
• grants up to $150,000 for the Industrial Ecology Program; and
• grants up to $250,000 for the Civil Construction Market Program.
Whilst the procurement of recycled content products is common in industry and government infrastructure
projects in Sydney, there is anecdotally still a hesitance to use recycled products derived from C&D waste
due to asbestos contamination risk.
MRA recommends that government develop procurement policies to facilitate the reuse of recyclable
materials in the economy.
17https://www.sydneywater.com.au/Publications/Reports/AnnualReport/2009/docs/compliance/Waste_Reduction_and_Purchasin
g_Policy_Statement_V0.3_1210909.pdf
18 http://www.sutherlandshire.nsw.gov.au/Council/News-and-Publications/News/FIRST-NSW-ROAD-BUILT-WITH-PLASTIC-BAGS-
AND-GLASS
19 https://www.smh.com.au/national/nsw/changing-the-game-on-plastic-20180604-p4zjbh.html
20 https://www.epa.nsw.gov.au/working-together/grants
ACOR – Western Sydney Waste Management 155 Conclusion
A total of 5.18 million tonnes per annum of additional capacity from 36 new facilities will be required by
2021-22 to meet state resource recovery targets. Up to 4,76621 jobs will be created through the
development of this infrastructure. $994 million of capital investment is required, and $1.11 billion of
economic value per annum will be generated from gate fees.
Table 9: 2021-22 infrastructure requirements and economic benefits
Residual Residual
Recyclable Organic
MSW to MSW to C&I C&D Total
MSW MSW
AWT EfW
Additional
processing
capacity (tpa)
required to
120,000 140,000 90,000 80,000 1,500,000 3,250,000 5,180,000
meet 2021-22
resource
recovery
targets
Thirteen
Two One Three Two 40,000 Fifteen
250,000 tpa
Facilities 60,000 140,000 30,000 tpa tpa organics 100,000 tpa
C&D 36
required tpa AWT tpa EfW MRF processing C&I MRF
processing
facilities facility facilities facilities facilities
facilities
Jobs created 111 129 83 74 1,380 2,990 4,766
Capital $120 $300 $450 $994
$18 million $60 million $46 million
investment million million million million
Economic value $36 $390 $1.1
$42 million $14 million $14 million $585 million
per annum million million billion
Recommendations to government are as follows:
• Government should recognise the significant economic benefits and jobs growth potential that the
recycling industry offers for Western Sydney.
• Plan the investment horizon to facilitate development of new infrastructure worth $1 billion of
capital investment
• The waste and recycling industry requires government leadership in the form of planning and policy
to achieve waste diversion targets in Sydney:
21It is unlikely that all the identified infrastructure needs will be met by 2021-22. Therefore, these figures for job creation will be
spread over the time it takes to build and commission these facilities.
ACOR – Western Sydney Waste Management 16o The development of industrial ecology parks should be considered to co-locate new waste
processing infrastructure and provide synergies for resource recovery operations in
Western Sydney. These will also serve to preserve buffers around waste assets
o Focus more of the Waste Less Recycle More grant funding on infrastructure
o Develop a priority infrastructure plan
o Coordinate with industry via new governance and engagement processes
o Accelerate government procurement of recycled content products in infrastructure
developments.
It should also be noted that many of these recommendations were made in the State Government
Richmond Review of Waste Strategy and Policy in NSW. Refer to Table 11 in Appendix A for a summary of
the recommendations from the Review and an interpretation of their implementation status in the
intervening years.
ACOR – Western Sydney Waste Management 17Appendix A Other key considerations
The need for strategic planning for resource recovery infrastructure
development
Recently, additional pressures on the waste and recycling industry have been imposed due to China’s
implementation of the National Sword Policy and the announcement by the Queensland government to
impose a $70/tonne levy on interstate waste. These measures would result in a significant number of
additional tonnes being processed in NSW and require further investment in waste and recycling
infrastructure.
The Waste Less Recycle More Grants program provides leverage for investment in NSW facilities, however,
in terms of planning, there are no solid measures to meet the growing demand, and the initiative is left to
private investment.
Strategic planning would give opportunity to impose buffer zones and create industrial ‘hubs’ for waste
management infrastructure, for the benefit of waste facilities and amenity of sensitive users.
Planning and licensing processes
The vast majority of waste facilities are required to obtain planning approvals and to apply for an
Environmental Protection Licence (EPL). A facility requires licencing if it surpasses the thresholds for
activities listed in Schedule 1 of the Protection of the Environment Operations (POEO) Act.
If the development is below Designated Development thresholds, a Statement of Environmental Effects
(SEE) is required to accompany the application. Designated Development projects are those which are high-
impact developments or are located in or near an environmentally sensitive or residential area. They are
defined by Schedule 3 of the Environmental Planning & Assessment (EP&A) Regulation 2000. Depending on
the scale, potential impact and economic value of the proposed waste facility, the development can also be
categorised under the following categories:
• Regional Development – classified under Schedule 4A of the EP&A Act and assessed by the relevant
Planning Panel.
• State Significant Development – classified under Schedule 4A of the EP&A Act and assessed by
Department of Planning and Environment or planning commission.
• Integrated Development – classified as integrated development when the consent is linked with
any associated approval, licence, consent, permission or permit required under other legislation.
Obtaining the required planning approvals can be challenging and long process, and this can be a significant
barrier to entry for the private sector in establishing new resource recovery facilities.
Impact of the Smart Cities program
Smart Cities is a Federal Government initiative to respond to growth in the economy and re-think how our
cities are planned and managed. The Smart Cities Plan sets out the vision for Australian cities and considers
ACOR – Western Sydney Waste Management 18how to maximise potential. It includes three pillars: smart investment: smart policy and smart technology
(Figure 4).
Figure 4: Three pillars of Smart Cities Plan
Waste management is a vital concern to growing cities, especially considering that waste generation is
outstripping population growth22. The Smart City reforms offer an opportunity for the Western Sydney
region to improve waste management practices by:
• Including waste precincts in planning policy;
• Encouraging the use of Greenstar and NABRs ratings for waste and recycling systems in buildings;
• Investment in innovative technologies to enable best-practice waste and resource recovery;
• Applying the principles of the circular economy to future cities; and,
• Accessing grant funding for infrastructure and technology projects.
NSW Policy changes
C&D Waste
The Protection of the Environment Operations Legislation Amendment (Waste) Regulation 201823 relating
to construction and demolition (C&D) waste came into force on 16 November 2018. Significant reforms are
listed in Table 10.
22NSW EPA, 2017, Draft Waste and Resource Recovery Strategy
23Protection of the Environment Operations Legislation Amendment (Waste) Regulation 2018 under the Protection of the
Environment Operations Act 1997, Published LW 16 November 2018 (2018 No 643).
ACOR – Western Sydney Waste Management 19Table 10: Key reforms enforced by the Protection of the Environment Operations Legislation Amendment (Waste) Regulation
2018
Reform Details
Prohibition on Applies to current and former landfills.
exhuming waste
Maximum penalties include $44,000 for a corporation and $22,000 for
individuals.
Handling of asbestos General requirements applying to the packaging, transportation and disposal of
waste asbestos waste to ensure safety.
Increased penalty notice amounts for asbestos waste offences.
Transported waste Provisions with respect to waste contributions for waste received or transported
deductions for recovery, recycling or processing.
Waste for bedding Permission for use of waste as biofilters or bedding layers in a landfill with
layers and biofilters approval of the EPA.
Monitoring waste Video monitoring systems at scheduled waste facilities.
activities
Definition of land Certain activities carried out for remediation of contaminated land is not land
pollution pollution.
Licensing requirements Occupiers of a landfill site that receives only virgin excavated natural material
are exempt from certain reporting requirements.
References to LGAs Updating references to merged and renamed local government areas.
In November 2018, “Standards for managing construction waste in NSW” (Standards) was released and a
new concessional levy rate for recovered fines applied as daily cover at landfills that will come into force
from 15 May 2019 was announced24. The main requirements from the Standards include25:
• Two-stage inspection process to ensure asbestos and other contaminants do not enter the facility;
• Sorting and waste storage requirements to improve the quality of recovered resources and avoid cross-
contamination of materials;
• Ensure that construction waste is only transported from the facility if it has been handled in accordance
with the Standards on-site; and
• Ensure that all staff managing, supervising or undertaking tasks required by the Standards have been
appropriately trained (including in asbestos awareness).
24 NSW EPA (2018) Standards for managing construction waste in NSW, https://www.epa.nsw.gov.au/-/media/epa/corporate-
site/resources/wasteregulation/18p1270-standards-for-managing-construction-waste-in-nsw.pdf, accessed 19 Nov 2018.
25 NSW EPA (2018) Waste management reforms commence on 16 November 2018, https://www.epa.nsw.gov.au/your-
environment/waste/industrial-waste/construction-demolition/construction-and-demolition-waste, accessed 19 Nov 2018.
ACOR – Western Sydney Waste Management 20Asbestos
Asbestos is common in the NSW built environment. The NSW EPA is responsible for regulating asbestos
waste under the Protection of the Environment Operations Act 1997 and the Protection of the Environment
Operations (Waste) Regulation 2014.
In November 2018, the NSW EPA released a Draft Asbestos Waste Strategy 2018-2226 for public
consultation. The strategy is focused on reducing illegal dumping and unsafe disposal, as well as promoting
appropriate disposal of asbestos waste including asbestos in soil. The reforms to managing asbestos
handling, transport and disposal proposed in the draft strategy are:
• Making asbestos waste disposal easier;
• Making asbestos waste disposal cheaper;
• Increasing awareness and changing behaviour;
• Closing loopholes and increasing transparency;
• Disrupting unlawful business models; and
• Monitoring and evaluating of the above reforms’ performance against baseline data.
The asbestos strategy is anticipated to increase lawful disposal of asbestos. There is no current baseline for
lawful disposal of asbestos. A baseline will be determined in the first year of the NSW Asbestos Waste
Strategy 2018-22.
Transport and logistics issues
Congestion in Sydney has been listed in the recent research as being Australia’s most congested city27-28.
The Bureau of Transport, Infrastructure and Regional Economics (BITRE) in a 2015 report stated that
congestion is costing $6.1 billion a year in Sydney and these costs are projected to more than double by
203029. In October 2017, Infrastructure Australia (IA) said that congestion cost $5.5 billion in Sydney with
these costs projected to increase to $14.8 billion by 203130.
Congestion in Sydney acutely affects the waste management sector due to the nature of their operations.
Transport costs which lead to increased disposal costs for the waste management sector is exacerbated by
collection vehicles being affected by congestion due to the following:
• restricted access times to licenced waste disposal/recycling facilities, usually between standard
business hours;
• restricted operating hours for construction and demolition sites in order to reduce noise
complaints to nearby residents; and
• restricted access times for collections (noise and C&I operating hour considerations).
26 NSW EPA (2018) NSW Asbestos Waste Strategy 2018-22 – Draft for consultation, https://www.epa.nsw.gov.au/-
/media/epa/corporate-site/resources/waste/18p1228-asbestos-waste-strategy-2018.pdf .
27 https://www.smh.com.au/national/nsw/sydney-s-congestion-at-tipping-point-20180520-p4zgfq.html
28 https://www.caradvice.com.au/695067/traffic-congestion-report/
29 https://bitre.gov.au/publications/2015/files/is_074.pdf
30 https://grattan.edu.au/wp-content/uploads/2017/10/892-Road-congestion.pdf
ACOR – Western Sydney Waste Management 21Allowances for licenced waste facilities to operate or just receive waste outside of standard business hours
may assist in reducing heavy vehicle movements in peak periods, reducing congestion for other commuters
and waste costs.
Review of state policy
In 2010 a comprehensive review of NSW’s waste strategy and policy (the “Richmond Review31”) was carried
out by independent experts and State Government departments. The review set out a number of key
recommendations for improving waste management in NSW.
Table 11 below summarises these recommendations and MRA’s view on the extent each goal has been
achieved.
Table 11: Richmond Review recommendations
Focus Recommendation Achievement
Targets Develop annual targets for MSW, C&I, C&D ✓
FOGO and cardboard targets
Strategy implementation Sub-targets, actions, timeframes,
Plan responsibilities arising from the Strategy
Data Accurate, timely and transparent
Reporting by EPA Improve analysis and reporting of progress Mixed
Municipal waste 75% recovery of dry recyclables
FOGO bins or AWT Mixed
Mandate these by 2014
Education Waste avoidance and source separation ✓ (Ongoing)
Target priority waste Hazardous waste, gas bottles, plastic bags – ✓
bans and policies
Drop Off and Recycling Build network of drop off facilities ✓ (Ongoing)
C&I recycling 3 bin system (incl. FOGO) or AWT, recycling,
dirty MRFs
Place based collection Collection via precincts
Financial Assurance Finalise financial assurance policy for
facilities
Levy funding Levy expenditure toward best practice ✓
systems
AWT output AWTDORF Amend limitations; Permit on ag lands ✓
31 https://www.epa.nsw.gov.au/~/media/EPA/Corporate%20Site/resources/wastestrategy/101034-rev-waste-strat.ashx
ACOR – Western Sydney Waste Management 22Focus Recommendation Achievement
Orders/Exemptions Establish expert panel to advise
Energy from Waste Develop policy ✓
Infrastructure funding Establish Waste Infrastructure Fund ✓
Innovation and Investment Establish an investment strategy with ✓
Treasury
Waste governance Establish clear accountability for waste policy
and enforcement within department and EPA
Advice Establish waste industry forum incl. councils
Infrastructure strategy EPA and Dept Planning develop an
Infrastructure plan
Land use planning Dept Planning to develop standard
conditions of development incl. source
separation
Case management Dept Regional Development facilitate new
entrants into waste via case management
National waste Support National Waste Policy and Australian Mixed
Government grants for infrastructure
ACOR – Western Sydney Waste Management 23You can also read