Demand for donkey hides and implications for global donkey populations
←
→
Page content transcription
If your browser does not render page correctly, please read the page content below
Demand for donkey hides and implications for global donkey populations

                                Richard Bennett, Simone Pfuderer

            School of Agriculture, Policy and Development, University of Reading

    Discussion paper prepared for presentation at the 93th Annual Conference of the Agricultural
                Economics Society, University of Warwick, UK, 15 - 17 April 2019

This paper is preliminary and should not be cited without the authors’ consent. Comments
are welcome.

Abstract:
Since antiquity donkey products have been attributed medicinal, rejuvenating and beautifying
properties. In China medicinal and rejuvenating effects have been attributed to a gelatin, called
ejiao, produced from donkey hides. In this paper, we analyse the demand for and supply of donkey
hides. Ejiao has a long tradition in Traditional Chinese Medicine but it used to be a product reserved
for the elite in Chinese society. A number of drivers have substantially increased the demand for
ejiao over the last three decades. Economic development has made ejiao affordable for a much
larger section of the Chinese population and it is now one of the most widely used products in
Traditional Chinese Medicine. Over the last few years, the Chinese government has put policies in
place to increase the use of Traditional Chinese Medicine, leading to a further increase in demand
for ejiao. We conclude, therefore, that overall demand for ejiao is likely to continue to increase. We
analyse the supply of donkey hides in China and globally. The rapid economic development in China
has not only led to an increase in demand for ejiao but also to a rapid decrease in the domestic
supply of donkeys. We use systems dynamics modelling to assess the potential of donkey farming in
China in the medium and longer term. Our modelling exercise shows that even under very optimistic
assumptions, current attempts to increase donkey farming in China will not meet the demand in the
short term but has potential in the medium to longer term. Thus, international trade in donkey hides
is likely to continue to play an important role, at least in the short term and a number of countries
have given permission for donkey slaughter houses to be built. We use the systems dynamics model
to assess the potential of countries to sustainably supply donkey hides over the next decade. The
model shows that trade can contribute to the supply of donkey hides but it will be not possible to
meet the current demand. Thus prices are likely to continue to increase. We conclude that there is
currently a shortfall in supply of donkey hides that cannot be met either within China or from other
countries. For this reason, fake ejiao products and illegal activities are likely to continue to
characterise the donkey hide and ejiao markets.

                                                  1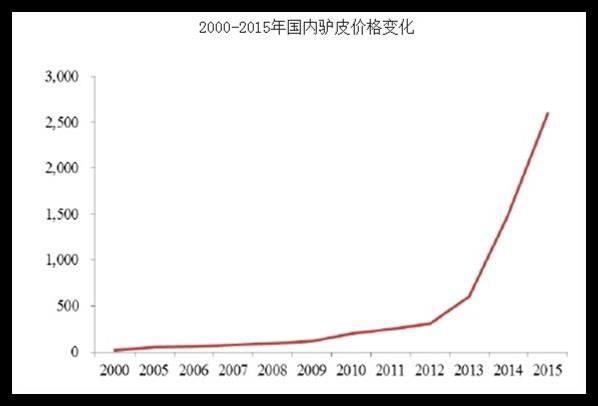
1. Introduction
Today, donkeys are predominantly seen as companion animals in high-income countries and as
working animals in low-income countries. However, since antiquity donkey products have been
attributed medicinal, rejuvenating and beautifying properties. In China medicinal and rejuvenating
effects have been attributed to a gelatin, called ejiao, produced from donkey hides. Today, ejiao is a
very popular health tonic medicine in China (Ge, He and Hu, 2014). Its clinical uses within Traditional
Chinese Medicine (TCM) are as a blood tonic for patients who suffer from dizziness, sallow
complexion and/or palpitations, as a medicine that helps to stop bleeding of any type (it is
commonly taken by some women at/around the time of menstruation) as well as a tonic that
nourishes and moistens yin which is said to help against irritability, insomnia and dry lung coughs
(Chinese Herbs Healing, no date; Yin and Yang House, no date). Ejiao is also ascribed anti-aging and
rejuvenating effects (Wang et al., 2012; Yang et al., 2014). Demand for donkey hides for production
of ejiao has led to rapid price increases for donkeys around the world, reports of illegal slaughter and
trade of donkeys together with associated issues relating to the welfare and loss of working animals
in many countries. A number of governments have restricted exports of donkeys or donkey hides to
protect their domestic donkey populations. For example, Burkina Faso, Uganda, Tanzania, Botswana,
Niger, Mali and Senegal have put restrictions on trade of donkeys and/or donkey hides as the
increased prices have led to reports of widespread thefts of donkeys (Xinhua News Agency, 2017).

In this paper, we analyse the demand for and supply of donkey hides. Section 2 sets out the drivers
for demand for ejiao and donkey hides over the last three decades and likely future developments in
the demand for donkey hides for the production of ejiao. Section 3 analyses the supply of donkey
hides in China and globally in the past and possible future sources for the supply of donkey hides.
We use systems dynamics modelling to assess the potential of donkey farming in China as well as
trade as a source of donkey hides. Section 4 examines the market impacts of the demand and supply
changes over the last 3 decades. Section 5 models the potential for future donkey hide supply in
China and Ethiopia. Section 6 concludes.

2. The demand for ejiao and donkey hides
The increase in the demand for ejiao is closely linked to a number of broad trends in China –
demographic changes, strong economic growth, expansion of the health care sector, and more
recently especially the TCM sector, by the Chinese government . These factors are discussed in more
detail in the following sections.

Population trends

China’s population continues at around 0.5 percent a year. Between 2016 and 2017 the population is
estimated to have increased by over 7 million. All else being equal, in terms of general demand for
goods and services, this increase in population can be expected to increase demand for products
generally, including ejiao. Figure 1 shows total, urban and rural population in China between 1970
and 2017.

                                                   2
Figure 1: Population of China from 1990 to 2017 (in million)
1600
1400
1200
1000
800
600
400
200
0
1999
2002
1990
1991
1992
1993
1994
1995
1996
1997
1998
2000
2001
2003
2004
2005
2006
2007
2008
2009
2010
2011
2012
2013
2014
2015
2016
2017
Total population Urban Rural
Source: China Statistical Yearbook 2018
Between 1990 and 2017 the population in China increased by almost 250 million. Despite a reduced
population growth rate between 2000 and 2017 China’s population still increased by over 120
million between 2000 and 2017, and by over 7 million between 2016 and 2017 alone. In 2017
China’s population was 1.39 billion. As a comparison, the total population of Sub-Saharan Africa was
estimated at 1.06 billion in 2017 (World Bank, 2019). Even small increases in import demand by
China can be sizable for individual African countries due to their much smaller overall populations
and economies.
Two further population trends in China are relevant in relation to the demand for ejiao. Firstly, over
the 27 years between 1990 and 2017 the proportion of the population living in urban areas has
increased from 26 percent to 59 percent and in absolute terms the urban population of China
increased by more than 500 million between 1990 and 2017 (National Bureau of Statistics of China,
2018). Secondly, as a result of the low birth rate and an increase in life-expectancy, the proportion of
people over 65 years of age increased from 5.6 percent in 1990 to 11.4 percent in 2017 (National
Bureau of Statistics of China, 2018). The impacts of these broader population trends on the demand
for ejiao will be discussed in the following sections.
Income and health expenditure trends
Average incomes in China have increased rapidly since 1990. Figure 2 shows GDP per capita in
constant yuan from 1990 to 2017. GDP per capital at constant yuan increased tenfold over this
period.
3Figure 2: GDP per capita in constant yuan between 1990 and 2017
60,000
50,000
40,000
yuan
30,000
20,000
10,000
0
2000
1990
1992
1994
1996
1998
2002
2004
2006
2008
2010
2012
2014
2016
Source: World Bank National Accounts Data
Income distribution is quite uneven in China, especially between urban and rural areas(Han, Zhao
and Zhang, 2016). Figure 3 shows the latest information on disposable income quintiles for urban
and rural households. Demand for ejiao can be expected to come predominantly from the urban
population.
Figure 3: Per capita disposable income by quintile for urban and rural household in 2017
90000
80000
70000
60000
50000
yuan
40000
Rural
30000
Urban
20000
10000
0
Low Lower Middle Upper High
middle middle
Income quintile
Source: China Statistical Yearbook 2018
As countries become richer the percentage of health spending in total spending tends to increase
(Farag et al., 2012). In addition, with the increase in the percentage of the population that is 65 years
and above health spending is also likely to be higher. Information on health care and medical
expenditure is available for the years 2013 to 2017. Table 1 summarises the information.
4Table 1: Per capita health care and total expenditure by Chinese households
2013 2014 2015 2016 2017 % change
2013 to
2017
Total expenditure per capita (in
yuan) 13,220 14,491 15,712 17,111 18,322 39%
Health Care and Medical Services (in
yuan) 912 1,045 1,165 1,308 1,451 59%
% Health Care and Medical Services
out of total expenditure 6.9% 7.2% 7.4% 7.6% 7.9%
Source: China Statistical Yearbook 2018
Between 2013 and 2017 total average expenditure per capita increased by 39 percent but average
health care and medical services expenditure per capita increased by 59 percent. Health care and
medical services expenditure was 7.9 percent of total expenditure in 2017.
The main driver behind increases in household spending on health care is likely to be the increase in
incomes. However, some commentators suggest that the widespread pollution in the big urban
areas has made the Chinese urban population more health conscious which is likely to lead to higher
health care spending, especially among urban residents (Butler, 2015).
The figures above relate to spending by households, which is often called out-of-pocket payments
for healthcare. As noted in a report by OECD (OECD, 2017) out-of-pocket spending for healthcare is
relatively high in China compared to other countries. However, over the last 15 years the increase in
government provided healthcare has been even more significant.
Changes in the health system in China
Since the mid-2000s the healthcare system in China has undergone substantial changes. As a recent
OECD report notes (OECD, 2017, p. 44):
“Access to healthcare has been improved by a dramatic expansion in health insurance coverage.
Between 2004 and 2014, the coverage rate rose from around 200 million to over 1.3 billion people –
the largest expansion of insurance coverage in human history.”
Public health insurance coverage in China is now near universal. The insurance is publicly funded and
provided by the local tiers of government. Health insurance covers primary and specialist healthcare,
hospitals as well as medicines including both Western and TCM but the details of the
implementation differ from region to region (Fang, no date; Nofri, 2015).
Participants of three focus groups in 2017 confirmed that the rules differed between regions but
that the general principal is that a certain amount of money is loaded onto the health insurance card
from local government. The money can be spent in hospitals, at doctors or at registered
pharmacies. TCM plays an important role within the Chinese healthcare system. Of all outpatient
treatments 20 percent are provided by TCM (Chung et al., 2013). This proportion is higher in
hospitals and lower in community care centres. TCM alternatives are particularly popular with
5poorer sections of the population and those who are underinsured as TCM medicines tend to be
cheaper than western medicines (Chung et al., 2013).
The last two Five-Year-Plans, the 12th Five-Year Plan 2011-2015 and the 13th Five Year Plan 2016-
2020, include as aims the support of TCM and improvement of the availability of TCM healthcare
(Chung et al., 2013; KPMG, 2016). In 2016, the Chinese government also published the Development
Plan of Traditional Chinese Medicine Healthcare Services (2015-2020) in which further budgetary
and tax policies to support TCM were announced (KPMG, 2016). In July 2017 a new law on TCM
came into effect with the aim to increase the use of TCM within the publicly funded Chinese health
system (Law of the People’s Republic of China on Traditional Chinese Medicine, 2017).
In an online survey with 781 Chinese users of ejiao that we ran in 2018, 18 percent of respondents
indicated that they always use their health insurance card, 15 percent that they do not use their
health insurance cards with the remainder sometimes using the health insurance card to buy ejiao.
The increase in demand for ejiao has to be seen in the context of these general trends in population,
income and spending as well as in relation to the changes in the health care system in China since
2000.
Demand for ejiao
Information on the demand for ejiao is scarce. Some information is available about the sale of ejiao
through retail pharmacies. A survey of pharmacies in Shanghai and Guangzhou found that ejiao is
the most popular medicine in the category of health tonics (Ge, He and Hu, 2014). According to
Sinohealth, a market research institute specialising in the healthcare sector, sales of ejiao through
retail pharmacies were 6.5 billion yuan (about 1bn USD)in 2015 (Customs Information Network,
2017). Ejiao was the medicine with the largest value of sales through retail pharmacies, a 32.8
percent increase compared to the previous year. This large increase in the value of sales is at least
partly driven by price increases (see section 4) but also possibly partly by an increase in the volume
of sales.
Ejiao is also an ingredient in lifestyle products, such as healthy snacks or anti-aging drinks (Yang et
al., 2014) and as one ingredient into more complex traditional Chinese medicines that are used to
treat a wide variety of conditions, such as menopausal syndrome (Yang et al., 2012) and gastric
cancer (Chen et al., 2018), to prevent miscarriage (Li et al., 2014) or to treat Haemolysis and
Anaemia (Chu et al., 2014). These sources suggest that the market for demand is diverse but little
reliable information is available about the overall demand for ejiao.
Media reports suggest that the overall size of the market was around 5,000 tonnes in 2015 (reported
at the start of 2016) but an article in the International Journal of Nanomedicine by researchers from
Shandong states a figure of 6,000 tonnes of total production in 2015 (Xinhua News Agency, 2016; Li
et al., 2017). Other reports suggest that production increased from 3,200 tonnes in 2013 to 5,600
tonnes in 2016 (Xinhua News Agency, 2017).
Based on the fact that between 1990 and 2017 the Chinese population increased by over 20 percent,
that per capita income has increased tenfold over this period and that health expenditure increased
more than total expenditure, it seems very likely that production of and demand for ejiao has
increased by substantially more than the increase in income i.e. more than tenfold over the last
6three decades. Given the current maximum estimate of a production of 6000 tonnes, production of
ejiao was likely below 500 tonnes in 1990.
It is likely that demand will continue to increase over the next few years. A law on TCM came into
effect on 1st July 2017. It aims to increase the demand for TCM, and thus likely also ejiao, mainly
through health practitioners. Continued broad demographic trends in urbanisation and an ageing
and wealthier population are likely to have larger impacts on retail sales.
Demand for donkey hides
Donkey hides are the main ingredient of ejiao. One estimate suggests that to produce 5,000 tonnes
of ejiao about 4 million donkey hides are required (Wang et al., 2012)(Xinhua News Agency, 2016).
Thus on average 1.25 kg of ejiao could be produced from one donkey hide. An annual production of
6,000 tonnes of ejiao would require 4.8 million donkey hides. Another report claims that to produce
one tonne of ejiao three tonnes of dried donkey hides are required.1 A dried donkey hide is
estimated by the same report to weigh 8 kg. These figures suggest that to produce 5,000 tonnes of
ejiao 15,000 tonnes of dried donkey hides are required. With an average weight of 8 kg per hide the
required number of donkey hides would translate into a requirement of 1.9 million donkeys for
5,000 tonnes and 2.3 million donkeys for 6,000 tonnes.
As demand for ejiao has increased rapidly, so has the demand for donkey hides. It is likely that the
demand for donkey hides in ejiao production increased more rapidly than incomes at constant prices
as the percentage of health spending increases as incomes increase. If we adopt a conservative
approach and assume that the use of donkey hides increased at the same rate as GDP at constant
prices we can derive indicative numbers for the use of donkey hides for ejiao production between
1990 and 2016 under a) the assumption that in 2016 4.8 million donkey hides were used and b) that
2.3 million donkey hides were used. Table 2 shows the resulting estimated use of donkey hides for
ejiao production:
Table 2: Indicative estimates of the number of donkey hides used in ejiao production between 1990
and 2016 (in thousand hides)
1990 1995 2000 2005 2010 2015 2016
High 419 747 1,130 1,803 3,081 4,499 4,800
Low 201 358 541 864 1,476 2,156 2,300
These estimates assume that all of the production on the market is ejiao derived from donkey hides.
Some sources suggest that up to 40 percent of ejiao is counterfeit (Xinhua News Agency, 2016). Our
focus groups suggested that consumers are very aware of the problem of fake produce. Also at least
one academic paper presents a new method to identify donkey hide gelatin from other species (Li et
al., 2017) and one paper that presents a method to identify DEEJ from other manufacturers (Li,
2016). This suggests that Chinese manufacturers are working on the problem of counterfeit
production and that the number of hides used in production might be lower.
1
Report on DEEJ on a Chinese platform http://www.sohu.com/a/129809208_135357
7As to future demand, it is likely that the large manufacturers are working intensively on research to
improve the efficiency of the production process and the size and quality of the hides. Dong’e Ejiao
(DEEJ), a large producer of top quality ejiao, is said to have a breeding base in China that breed
donkeys with hides twice as large as those of average donkeys. The future demand for donkeys for
hides will be influenced not only by trends in the drivers for ejiao demand but also by the
technological progress in breeding and in the production process.
To summarise, a number of drivers have substantially increased the demand for ejiao over the last
three decades. Demand for ejiao is likely to continue to increase.
3. Supply of donkey hides
Donkey population and donkey hide supply in China
While the demand for donkey hides has gone up significantly, the supply of donkeys in China has
declined since 1990. According to official statistics by the National Bureau of Statistics of China the
donkey population in China declined from 11.2 million in 1990 to 2.7 million in 2017. In the latest
Statistical Yearbook, the estimates of the number of donkeys in China for the years 2007 to 2016
were substantially revised downwards. The number of donkeys in China in 2016 was previously
estimated at 4.6 million and has been revised downwards to 2.6 million (see Figure 4). These
revisions indicate that more donkey hides than previously assumed were available from the
declining population over the last 10 years but also that the potential for future production is
smaller than previously assumed. The estimate for 2017 suggests that the donkey population has
stopped declining. The latest estimates show a small increase in the Chinese donkey population
between 2016 and 2017. This is the first increase in the donkey population since 1998.
Figure 4: Donkey population in China from 1990 to 2017 (million head)
12
10
million donkeys
8
6
4
2
0
1996
1990
1991
1992
1993
1994
1995
1997
1998
1999
2000
2001
2002
2003
2004
2005
2006
2007
2008
2009
2010
2011
2012
2013
2014
2015
2016
2017
Previous estimates (2017 Statistical Yearbook)
Latest estimate (2018 Statistical Yearbook)
Source: China Statistical Yearbook 2017 and China Statistical Yearbook 2018
The main driver for the decline is the economic development of China over this period. Between
1990 and 2017, the number of mules, horses and donkeys declined by 85 percent, 66 percent and 76
8percent, respectively. Over the same period, the number of number of small tractors more than
doubled (from 7.0 million in 1990 to 16.3 million in 2017) and that of large and medium size tractors
increased sevenfold (from 0.8 million to 6.7 million). (National Bureau of Statistics of China, 2018)
In January 2016 it was reported in Chinese newspapers that the Chinese supply of donkey hides is
less than 1.8 million hides (Xinhua News Agency, 2016). Total Chinese supply of donkey hides is
made up by the net decrease in the number of donkeys plus the number of births. The net change in
the donkey population was 831 thousand. Hence, almost a million births would be required. This
translates into 0.32 foals per donkey or roughly 0.65 foals per female donkey. No information is
available on the number of donkey births in China but it seems unlikely that an average birth rate of
0.65 per female donkey has already been achieved.2 Supply from Chinese donkeys was likely
substantially below 1.8 million in 2016, leaving a large shortfall between Chinese supply and
estimated demand of between 2.3 and 4.8 million donkey hides.
Future supply from China is likely to come mainly from donkey farming. It is clear that the Chinese
farming programme has already started. There are reports that the President of DEEJ called for
subsidies for donkey breeding already in 2010 (Swift, 2016). It is reported that in the last two years
15 provinces and 22 cities have announced their intention to provide donkey subsidies (Hancock and
Xueqiao, 2018). A representative from DEEJ is said to have indicated that by 2020 DEEJ will be able
to meet their basic needs for hides through their donkey farms (Hancock and Xueqiao, 2018). He
also added that other companies will have to continue to rely on imports for another decade at
least.
Donkey populations in the rest of the world and trade
The world donkey population has been fairly stable over the last couple of decades according to
estimates by the UN Food and Agriculture Organisation (FAO). Figure 5 shows estimates of the world
donkey population since 1990. Over this period global donkey population was estimated at between
40 and 46 million.
This fairly stable global population masks marked differences between countries. China had by far
the largest donkey population in 1990. In 2016 Ethiopia had the largest donkey population with
more than 8 million donkeys. Ethiopia has seen a strong increasing trend in donkey population since
2000 with growth rates of between six and seven percent annually in the last three years for which
data are available.
According to FAOSTAT there was an estimated donkey population outside China of 41 million. Using
this figure a hypothetical supply of donkey hides from natural deaths can be calculated. It seems that
the hides of most of these donkeys are not used upon their death. The best figures on population
and deaths are figures from the Ethiopian survey. In 2016 the total donkey population was
estimated at 8.4 million and deaths were estimated at 455,617 i.e. about 5 percent of the donkeys
died in 2016. Using the same ratio for the total population outside China there would be a natural
annual supply of donkey hides of 2.2 million.
2
As a comparison, data from Ethiopia shows 0.075 foals per donkey and 0.15 foals per female donkey in
Ethiopia.
9Figure 5: Estimated global donkey population 1990 to 2017
50
45
40
35
30
25
20
15
10
5
0
1990 1992 1994 1996 1998 2000 2002 2004 2006 2008 2010 2012 2014 2016
Global Donkey Population
Source: FAOStat
There are significant economic, cultural and governance barriers that mean that actual supply of
donkey hides will be very much lower. Nevertheless, there is some potential for supply of donkey
hides from existing populations through trade. In addition there is the potential for donkey farming
in countries outside China which would increase the potential overall supply.
We obtained data on live donkey imports for 2012 and 2016, and on donkey hide imports in 2016.
While the former is readily available, the latter is not as donkey hides are recorded in a category
with hides from other species. No live donkey imports were recorded in 2012. In 2016 the official
records show the import of live donkeys from Kyrgyzstan of around 1,600 live donkeys.3 A report on
imports of donkey hides in 2016 based on a detailed analysis of the other hides trade category
suggests that about 100,000 donkey hides were imported, mainly from Mexico and Peru (together
more than 90 percent of all imports).
These official trade figures are difficult to reconcile with both the gap in the estimated use of donkey
hides and domestic supply in China and the suggestion that several million donkey hides are
imported annual into China for ejiao production with many imported from Africa (Cong, 2018).
We conclude that there is currently a shortfall in supply of donkey hides that cannot be met either
within China or from other countries. For this reason, counterfeit ejiao products and illegal activities
are likely to have played and to continue to play an important role in the donkey hide and ejiao
markets.
3
The volume of imports is given as 320,417kg. If each donkey weighed around 200 kg this would translate into
the import of about 1,600 donkeys.
104. Market impacts of the supply and demand trends
Our analysis suggests that while the supply of donkey hides in China exceeded the demand for
donkey hides for ejiao production in the 1990. Over the last three decades demand for ejiao and
donkey hides increased and supply of donkey hides decreased. There is currently a large shortfall of
donkey hides in China that can only be partially met by imports. The supply and demand balance has
led to sharp increases in the price of ejiao, of donkeys and of donkey hides. It is difficult to get
reliable information on prices but indicative information is available from the grey literature and
media reports. The overview below is not exhaustive but gives an indication of recent price
movements.
Prices of donkeys and donkey hides have increased significantly over the last decade or so. Reliable
price information could not be found. However, there are a number of prices reported in the media.
Figure 6: The price of donkey hides in China between 2000 and 2015
Source: Baolu and Jianing, 2016
Hancock and Xueqiao (2018) put the value of a donkey hide in 2018 at 3,000 yuan (USD 473) while
other report an increase of a donkey hide from 20 yuan in 2000 to 3000 yuan end of 2017 (Xinhua
News Agency, 2017). Bloomberg News (2017) report prices of donkey hides of up to 8,000 yuan (USD
1,160).
The price development suggests a tightening of the market from around 2009/2010 and a
substantial shortage of supply from 2012 onwards, which is more in line with the low than the low
11donkey hide usage scenario in section 2. The high donkey use scenario would suggest a shortage
from the early 2000s.
The increase in the price of donkey hides has fed through into the ejiao price. One report suggests
that the price of ejiao increased from about 500 yuan per 0.6 kg to 3000 yuan between 2009 and
2016 (Hancock and Xueqiao, 2018). Another source suggested a 5 times increase in the price in the
decade between 2007 and 2017 reaching a price of 375 USD per kg in 2017 (Berhane, 2017).
The increase in the value of donkey hides in China has led to price increases of donkeys around the
world. Table 3 shows a number of prices for donkeys reported in different media reports.
Table 3: Prices for donkeys reported in different media reports
Country Price Year Source
Ethiopia $90 to $150 2016 http://www.npr.org/sections/goatsandsoda/2016/11/07/500999944/donkeys-are-finally-getting-
more-respect
Niger $100 to 2016 http://www.bbc.co.uk/news/world-africa-37286811
$145
Burkina £108 ($140) 2016 https://qz.com/925291/donkeys-in-kenya-are-slaughtered-to-meet-demand-for-ejiao-in-china/
Faso
South 2 – 7k rand 2017 https://www.modernghana.com/news/763077/chinas-demand-for-medicine-fuels-african-donkey-
slaughter.html
Africa ($150 -
$517)
Nigeria $150 2017 https://www.bloomberg.com/news/articles/2017-05-15/slaughter-of-africa-s-donkeys-for-china-
hurts-poorest-farmers
Tajikistan $240 2017 https://www.rferl.org/a/tajikistan-donkeys-hides-medicine-china/28486068.html
Reported prices in Africa, with the exception of the highest report from South Africa, are significantly
lower than the current prices reported for donkey hides in China of between $473 and $1,160. The
high end of the reported prices in most African countries is $150 – a third of the lower end of the
prices quoted for China. This price differential is a strong economic incentive for trade.
5. Modelling supply of donkey hides in China and outside China
In order to help assess the potential supply of donkey hides two dynamic population models were
developed using ISEE’s Stella® Architect software. The first model was used to assess the potential of
supplying donkey hides from setting up a donkey farming system. The second model assesses the
potential for donkey skin supply from countries in which donkeys are primarily used for transport
and where hides are a by-product that is currently not used.
The models give a broad indication of the global supply potential over time. Many of the parameters
are very uncertain. Nevertheless, the model is a useful tool to get a better understanding of the
issues and uncertainties involved in assessing the short and medium term potential to for the supply
of donkey hides for ejiao production.
12Model of a donkey farming system for hides
The first model is of a donkey farming system. The model assesses the time it takes to reach a
specified sustainable annual supply of donkey hides. The model runs over 50 years. We assume that
the farming population is started with only breeding animals. After one year the first foals are born.
The majority of the male foals are slaughtered for their hide once they reach maturity. Maturity can
be set at either 2 or 3 years. Thus, the first donkeys are slaughtered for their hides in year 3 or 4. The
start of reproduction of female donkeys can be set at either 2 or 3 years. In the first years, no
breeding animals are culled. This is based on the assumption that the starting breeding herd is made
up of animals that are recruited into the breeding herd from elsewhere. It seems likely that these are
young animals and not old animals towards the end of their reproductive age. All female donkeys
enter the breeding herd until the target number of hides is reached. This minimizes the time needed
to build up the population but reduces the number of hides available during the build-up of the
population. Once the target number of hides is reached, females required to keep the breeding
population stable are sent into the breeding herd, other female donkeys are slaughtered for hides at
the age of maturity. The reproduction rate determines how many foals are produced from a given
female breeding population. A reproduction rate of 0.7 means that 100 female donkeys produce 70
off-spring each year. Increases in the annual reproduction rate can be achieved in different ways: a
decrease in time between pregnancies, increase in multiple births, shorter pregnancies (we
understand there is some variation in the gestation period for donkeys), increase in pregnancies
carried to term etc.
Mortality is included for under 1 year olds. The model assumes that the hides of donkeys that die
under 1 are lost for hide production but that those dying between 1 and 2 can be used for hide
production. The supply of the hides is made up of clean hides (from animals never used for breeding)
and the hides of culled breeding animals.
Three example scenarios were developed. The parameters were informed by the information in the
grey literature and through stakeholder consultation. All scenarios have a target hide output of 3
million donkey hides, which is close to the current lower end of the estimates of how many donkey
hides are used for the production of ejiao. Table 4 shows the parameters used for these three
scenarios.
Under scenario 1, the farming system can supply only 212 thousand hides after 50 years. To supply
the 212 thousand hides a female breeding population of 854 thousand donkeys and a total donkey
population within the farming system of 1.8 million donkeys is required. In this scenario the donkey
population increases by five percent a year, which is less than the increases seen in Ethiopia over the
last 5 years of almost 7 percent. In scenario 2 the target hide output of 3 million per year is reached
after 34 years with a female breeding population of 6.9 million donkeys and a total donkey
population of 14.5 million donkeys. Under the assumptions of scenario 2, it would take 20 years to
get from a population of 2.5 million donkeys to the 14.5 million donkeys required for the annual
supply of 3 million donkey hides. The total Chinese donkey population is currently estimated at 2.7
million donkeys but not all are part of donkey farms. Thus, under the assumptions of this scenario
the Chinese farming system would need more than 2 decades to meet the 3 million target. Under
scenario 3, it would take 20 years to achieve the target output of 3 million hides with 4.9 million
female breeding donkeys and a total donkey population within the farming system of 12.1 million
13donkeys. Under the assumptions of scenario 3, it takes 9 years to get from a total donkey population
of 2.3 million donkeys to the 12.1 million donkeys that are required under scenario 3 to produce an
annual output of 3 million donkey hides.
Table 4: Summary of assumptions for the three selected scenarios:
Scenario 1 Scenario 2 Scenario 3
Parameters
Initial female breeding herd 50,000 100,000 200,000
Target hides 3 million 3 million 3 million
Reproduction rate 0.4 0.5 0.7
(foal/jenny/year)
Female male breeding ratio 10 10 20
Female cull rate 10 percent 5 percent 5 percent
Maximum female breeding age 12 years 22 years 22 years
Male cull rate 10 percent 5 percent 5 percent
Maximum male breeding age 12 years 22 years 22 years
Mortality rate of under 1s 10 percent 5 percent 2.5 percent
Age at slaughter 3 years 2 years 2 years
Female maturity age 3 years 2 years 2 years
Results
Target hides reached in - 34 years 20 years
Female breeding population 0.9 million 6.9 million 4.9 million
year 50
Total donkey population year 1.8 million 14.3 million 12.1 million
50
These scenarios suggest that China is more than a decade away from supplying the donkey hides
that are probably currently used in the production of ejiao.
Model of donkey hide supply from existing donkey populations
The second model is based on information from Ethiopia, the country with the largest donkey
population. Not only has Ethiopia the largest donkey population, it also has detailed information on
the donkey population. Based on this information we built a model that shows the theoretical supply
capacity of such a population. In reality there are significant barriers to the supply of donkey hides
from existing populations, for example the opposition to the slaughter of animals on cultural
grounds, governance related problems, such as thefts as well as difficulties in accessing donkey
populations (Addis Fortune, 2017; Masinde, 2017; The Donkey Sanctuary, 2017; Addis Standard,
2018; Nuwer, 2018; Brooke, 2019).
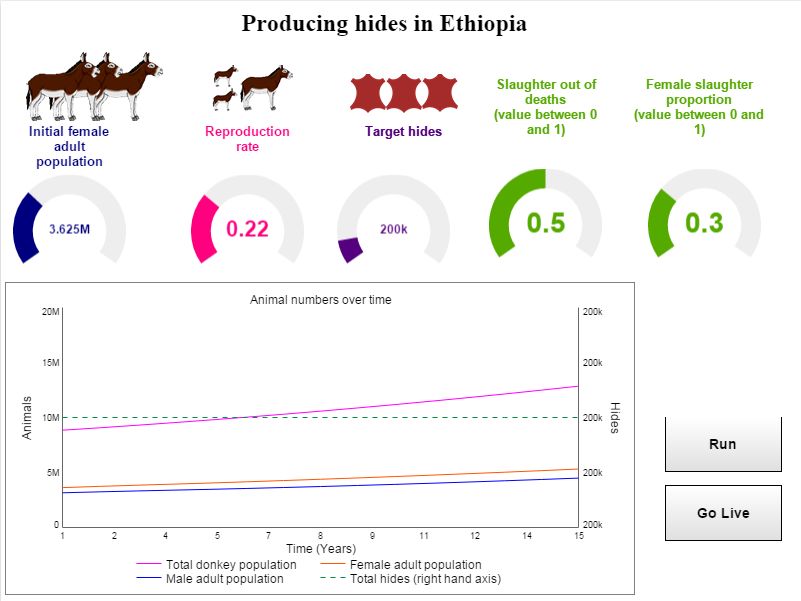
14Figure 7 shows the interface of the model with results from Scenario 2.
The model starts with an existing donkey population. The donkey population is split into females
under three years, males under three years, females three years and over and males three years and
over. Total births depend on the adult female population and the reproduction ratio. The
reproduction ratio is the average number of births per adult female donkey. The model splits the
births into male and female births. Three years after birth, the donkeys move from the under 3 years
population categories to the 3 years and over population categories. For simplicity, all deaths are
assumed to be of adult donkeys as no split for the deaths by age groups is available. The slaughter
flow is determined by the target hides specified. The model splits male and female slaughter and the
ratio between male and female slaughter has to be set within the model. Due to the different
requirements of females and males for breeding the split can have a noticeable impact on the
population dynamics. Deaths are the second outflow from the model. Deaths record animals that die
and whose hides are not used. The model allows the relationship between the deaths and slaughter
to be specified. One extreme would be to assume that none of the donkeys that are slaughtered in
one year would have otherwise died from natural causes in that year. the other extreme that all
donkeys that are slaughtered would have died a natural death in that year. The reality will lie
somewhere in between those two extremes. The number of animals slaughtered is an input into the
model. The impact the number of slaughtered animals has on the natural deaths can be set within
the model.
15The model was parameterised with the results from the 2017/18 agricultural survey (Central
Statistical Agency of the Federal Democratic Republic of Ethiopia, 2018). Table 5 summarises the
parameters in the model that are based on the 2017/18 agricultural survey results.
Table 5: Parameter values based on the 2017/18 agricultural survey
Parameter value
Initial adult female population 3,626,264
Initial adult male population 3,154,025
Initial female population under 3 1,027,342
Initial male population under 3 1,037,931
Total initial donkey population 8,845,562
Female birth proportion 0.52
Natural mortality rate 0.07
Reproduction rate (foals/jenny/year) 0.22
Table 6: Results from six scenario runs
Scenario 1 Scenario 2 Scenario 3
Parameters
Female slaughter proportion - 0.3 0.3
Proportion of donkeys slaughtered - 0.5 0.5
that would have died a natural death
Reproduction rate (foals/jenny/year) 0.22 0.22 0.22
Target hides 0 200,000 700,000
Results
Target hides sustainable over the 15 - Yes Yes but with a
year period small decrease in
population
Total donkey population in 15 years 14.3 million 12.8 million 8.3 million
Female adult population in 15 years 5.7 million 5.3 million 4.3 million
Scenario 4 Scenario 5 Scenario 6
Parameters
Female slaughter proportion 0.3 0.4 0.3
Proportion of donkeys slaughtered 0.5 0.8 0.1
that would have died a natural death
Reproduction rate 0.22 0.28 0.22
Target hides 1,000,000 1,000,000 600,000
Results
Target hides supplied over the 15 year No Yes Yes but with a
period decrease in
population
Total donkey population in 15 years 5.8 million 9.3 million 6.7 million
Female adult population in 15 years 3.7 million 4.7 million 3.5 million
16The model runs over 15 years. The scenarios assess under which conditions the 2017/18 population
could sustain a regular annual supply of donkey hides for ejiao production. Scenario 1 is the baseline
scenario. It is based on the 2017/18 information from the agricultural survey on the donkey
population in Ethiopia, donkey births and deaths. If the birth and mortality rate stayed the same
over the next 15 years, without any slaughter of donkeys for ejiao, the donkey population in Ethiopia
would increase from 8.8 million donkeys to 14.3 million donkeys, of which 5.7 million donkeys would
be adult female donkeys. Scenario 2 assumes that 30 percent of donkeys slaughtered for their hide
are female and 70 percent male and that 50 percent of those slaughtered for their hides would have
died a natural death. Thus, it is assumed that half of the donkeys used for hides are old, weak or ill
but that the other 50 percent slaughtered are healthy donkeys. The reproduction rate is set at the
2017/18 level. Under these assumptions, the donkey population would increase over the 15 year
period from 8.8 million at the start to 12.8 million after 15 years. Scenario 3 has the same
assumptions as Scenario 2 with the exception that the target for the annual supply of donkey hides
is 700,000. In this scenario 700,000 can be supplied over the period but the donkey population
would show a decline from 8.8 million to 8.3 million. Scenario 4 is as scenario 3 but with an annual
supply of donkey hides of 1 million hides. In this scenario, for the first 10 years 1 million hides are
supplied but partly to a reduction in the donkey population. For the last 5 years, the 1 million target
is not reached any more. Scenario 5 shows the conditions under which 1 million hides could be
supplied while keeping the donkey population marginally increasing from 8.8 million to 9.3 million. It
would require an increase in the reproduction rate from 0.22 to 2.8, making use of 80 percent of the
donkeys that would die in each year for the hide supply as well as a higher percentage of females to
be slaughtered. Scenario 6 shows that if most of the donkeys slaughtered are healthy donkeys, that
is if 10 percent the old and weak donkeys that die are used for their hides an annual supply of
600,000 donkeys would only be possible at the expense of a reduction in the donkey population.
6. Discussion and conclusion
We provide an assessment of past, current and future developments of the supply and demand of
donkey hides for ejiao production. Over the last three decades the annual demand for donkey skins
has probably increased more than tenfold. We estimate that in 1990 at most 400,000 donkey hides
were used for ejiao production. Since then demand for donkey skins for ejiao has increased rapidly.
We estimate that currently between 2 and 5 million donkey skins are necessary annual for the
production of ejiao. Economic development has made ejiao affordable for a much larger section of
the Chinese population and it is now one of the most widely used products in Traditional Chinese
Medicine. Over the last few years, the Chinese government has put policies in place to increase the
use of Traditional Chinese Medicine, leading to a further increase in demand for ejiao. We conclude,
therefore, that overall demand for ejiao is likely to continue to increase. These broad trends are
likely to continue. As a consequence, the demand for ejiao is likely to continue to increase in the
foreseeable future.
Information on the donkey population and donkey hide prices indicates that from around 2009/2010
domestic supply could not meet the demand for donkey hides any more. Several sources suggest
that annual imports of several hundreds of thousand, if not millions of donkey hides have been
imported annually in recent years (Cong, 2018; Hancock and Xueqiao, 2018). Official data on imports
17does record donkey hides in a separate category. A report based on official customs data record
much lower imports. There are a number of possible reasons for this discrepancy. Firstly, the data
from official customs records is only based on one trade code. Though we were advised that donkey
hides are recorded under this trade code, we cannot exclude the possibility that some trade is
recorded under other trade codes. Secondly, donkey hides might be imported illegally and/or
misclassified as hides from other animals. Thirdly, it is possible that the estimates of imports are
based on estimates of use of hides in the ejiao industry and the availability of hides from China. Such
an analysis indicates a large import requirement. The information on the number of hides required
in ejiao production might be unreliable. Little information is available about the production process
but also about the variation in the size of hides. A DEEJ representative claims that they are breeding
donkeys double the size of ordinary donkeys which would reduce the number of hides required. In
addition, the supply of donkeys is subject to uncertainty. In 2018, the National Bureau of Statistics of
China revised its estimates of the donkey population in recent years downwards. Between 2007 and
2016, the donkey populatio in China decreased more rapidly than previously thought. This means
that the hides of more donkeys than previously thought could have been used for ejiao production
over this period. It also suggests a lower production capacity in China in the near future than
previously thought. Fourthly, it is possible that a substantial proportion of the ejiao on the Chinese
market is fake and either does not contain any donkey gelatin or that donkey gelatin is used
together with gelatin from other species, either related species such as mules and horses or from
other species such as pigs.
Our model of a donkey farming system indicates that it will take at least another decade until China
can produce 3 million donkey hides annually, which is less than some estimates for the current use
in ejiao production. Donkey populations around the world are a possible source of donkey hides for
the ejiao industry. Our model shows that a population of the size and the characteristics of the
Ethiopian donkey population could in theory supply several hundred thousand hides a year without
decimating the population even without an increase in the reproduction rate. With an increase in
the reproduction rate, the theoretical capacity could approach 1 million hides a year. However, in
reality there are a number of barriers to reach this theoretical capacity, such as the lack of
infrastructure and trading routes, cultural barriers and governance issues.
To conclude, rapidly increasing demand for ejiao and a decrease in supply of donkey hides within
China have led to strong import demand for donkey hides. We expect the increasing trend in
demand to continue. There is evidence that a donkey farming system was started in China several
years ago. The most recent estimates of the donkey population in China suggest that the reduction
in the Chinese donkey population has come to an end with a small increase in the donkey population
in the last year. However, based on the current estimate of the Chinese donkey population of 2.7
million donkeys, it seems unlikely that China will be able to meet the demand for donkey hides from
domestic supply for at least another decade, if not two. Imports are unlikely to close the gap
between demand and supply. As a consequence, the prices of ejiao and of donkey hides are likely to
increase further over the next few years. This is likely to further incentivize legal and illegal activities
in relation to donkeys and donkey hides all over the globe and to put even greater pressure on
donkey populations.
18References
Addis Fortune (2017) Ethiopia: First donkey abattoir shuts down, Tesfanews. Available at:
https://www.tesfanews.net/ethiopia-first-donkey-abattoir-shuts-down/.
Addis Standard (2018) ‘Newa: The Donkey Sanctuary and Ethiopian Government commit to
safeguarding national donkey herd’, Addis Standard, 28 November. Available at:
http://addisstandard.com/news-the-donkey-sanctuary-and-ethiopian-government-commit-to-
safeguarding-national-donkey-herd/.
Baolu, Y. and Jianing, N. (2016) ‘The depth of the investigation, the outlet on the donkey’, Best China
News, 16 December. Available at: http://www.bestchinanews.com/Domestic/11652.html.
Berhane, S. (2017) ‘Donkey Meat Up for Export, Slaughterhouse Opens’, Addis Fortune, 1 April.
Available at: https://addisfortune.net/articles/donkey-meat-up-for-export-slaughterhouse-opens/.
Bloomberg News (2017) ‘Have a Donkey to Trade? China Has an Exchange for That’, Bloomberg
Businessweek, 29 March. Available at: https://www.bloomberg.com/news/articles/2017-03-
29/china-has-exchange-traded-donkeys.
Brooke (2019) Demand for Africa’s donkeys causing terrible suffering, Brook. Available at:
https://www.thebrooke.org/news/demand-africas-donkeys-causing-terrible-suffering (Accessed: 14
March 2019).
Butler, S. (2015) ‘Amid Pollution Problems, China’s Health Food Industry Blossoms’, Huffington Post,
27 March. Available at: https://www.huffingtonpost.com/2015/03/27/china-health-
food_n_6958390.html.
Central Statistical Agency of the Federal Democratic Republic of Ethiopia (2018) Report on Livestock
and Livestock Characteristics, Volume II, Agricultural Sample Survey 2017/18. 571. Addis Ababa.
Chen, Y., Zhang, G., Chen, X., Jiang, X., Bie, F., Yuan, N., Wang, Y., Hao, X. and Ma, M. (2018) ‘Jianpi
Bushen , a Traditional Chinese Medicine Therapy , Combined with Chemotherapy for Gastric Cancer
Treatment : A Meta-Analysis of Randomized Controlled Trials’, 2018.
Chinese Herbs Healing (no date) E Jiao (Colla Corii Asini, Donkey-Hide Gelatin), Chinese Herbs
Healting - Art of Herbal Remedies Revealed.
Chu, N., Wu, Z., Zhang, X., Fang, S., Wang, W. and Cheng, Y. (2014) ‘Molecular Mechanism of Yisui
Shengxue Granule , a Complex Chinese Medicine , on Thalassemia Patients Suffering from Hemolysis
and Anemia of Erythrocytes’, 2014.
Chung, V. C. H., Ma, P. H. X., Wang, H. H. X., Wang, J. J., Hong, L. C., Wei, X., Wong, S. Y. S., Tang, J. L.
and Griffiths, S. M. (2013) ‘Integrating Traditional Chinese Medicine Services in Community Health
Centers: Insights into Utilization Patterns in the Pearl River Region of China’, Evidence-Based
Complementary and Alternative Medicine, 2013, pp. 1–8. doi: 10.1155/2013/426360.
Cong, W. (2018) ‘Nation hunts self-sufficieny in donkey hide’, Global Times China, 2 January.
Available at: http://www.globaltimes.cn/content/1083014.shtml.
Customs Information Network (2017) 2016 Annual Donkey Skin Import Analysis Report.
Fang, H. (no date) The Chinese Health Care System, International Health Care System Profiles, The
Commonwealth Fund. Available at: https://international.commonwealthfund.org/countries/china/.
Farag, M., NandaKumar, A. K., Wallack, S., Hodgkin, D., Gaumer, G. and Erbil, C. (2012) ‘The income
19elasticity of health care spending in developing and developed countries’, International Journal of
Health Care Finance and Economics, 12(2), pp. 145–162. doi: 10.1007/s10754-012-9108-z.
Ge, S., He, T. T. and Hu, H. (2014) ‘Popularity and customer preferences for over-the-counter
Chinese medicines perceived by community pharmacists in Shanghai and Guangzhou: A
questionnaire survey study’, Chinese Medicine (United Kingdom), 9(1), pp. 1–8. doi: 10.1186/1749-
8546-9-22.
Han, J., Zhao, Q. and Zhang, M. (2016) ‘China’s income inequality in the global context’, Perspectives
in Science. Elsevier GmbH, 7, pp. 24–29. doi: 10.1016/j.pisc.2015.11.006.
Hancock, T. and Xueqiao, W. (2018) ‘China bets on donkey breeding to curb Africa imports’, Financial
Times Online, 15 February. Available at: https://www.ft.com/content/bee2b852-0190-11e8-9650-
9c0ad2d7c5b5.
KPMG (2016) ‘The 13th Five-Year Plan – China ’ s transformation and integration with the world
economy’, Kpmg, (October). Available at:
https://assets.kpmg.com/content/dam/kpmg/cn/pdf/en/2016/10/13fyp-opportunities-analysis-for-
chinese-and-foreign-businesses.pdf.
Law of the People’s Republic of China on Traditional Chinese Medicine (2017). Available at:
http://en.pkulaw.cn/display.aspx?cgid=287286&lib=law.
Li, L., Leung, P. C., Chung, T. K. H. and Wang, C. C. (2014) ‘Systematic review of Chinese Medicine for
miscarriage during early pregnancy’, Evidence-based Complementary and Alternative Medicine,
2014. doi: 10.1155/2014/753856.
Li, W. (2016) ‘Manufacturer identification and storage time determination of “Dong’e Ejiao” using
near infrared spectroscopy and chemometrics’, Journal of Zhejiang University-SCIENCE B, 17(5), pp.
382–390. doi: 10.1631/jzus.B1500186.
Li, X., Shi, F., Gong, L., Hang, B., Li, D. and Chi, L. (2017) ‘Species-specific identification of collagen
components in Colla corii asini using a nano-liquid chromatography tandem mass spectrometry
proteomics approach’, International Journal of Nanomedicine, 12, pp. 4443–4454. doi:
10.2147/IJN.S136819.
Masinde, J. (2017) As other African countries ban donkey slaughter, Kenya doubles down to meet
Chinese demand, Quartz Africa. Available at: https://qz.com/africa/1062794/as-other-african-
countries-ban-donkey-slaughter-kenya-doubles-down-to-meet-chinese-demand/.
National Bureau of Statistics of China (2018) China Statistical Yearbook 2018. Available at:
http://www.stats.gov.cn/tjsj/ndsj/2018/indexeh.htm (Accessed: 8 March 2019).
Nofri, E. M. (2015) The Chinese Healthcare System: How it works and future trends. Available at:
http://www.albertoforchielli.com/the-chinese-healthcare-system-how-it-works-and-future-trends/
(Accessed: 1 March 2019).
Nuwer, R. (2018) ‘To Sate China’s Demand, African Donkeys Are Stolen and Skinned’, The New York
times, 2 January. Available at: https://www.nytimes.com/2018/01/02/science/donkeys-africa-china-
ejiao.html (Accessed: 14 March 2019).
OECD (2017) ‘OECD Economic Surveys: China’, (March). Available at:
http://www.oecd.org/eco/surveys/china-2017-OECD-economic-survey-overview.pdf.
Swift, A. (2016) Ejiao: Donkeys are paying the price for China’s rapid progress and lost traditions.
20Available at: https://donkeytime.org/2016/12/18/ejiao-donkeys-are-paying-the-price-for-rapid-
progress-and-lost-traditions/ (Accessed: 3 March 2019).
The Donkey Sanctuary (2017) Under the skin: The emerging trade in donkey skins and its implications
for donkey welfare and livelihoods. Sidmouth. Available at:
https://www.thedonkeysanctuary.org.uk/sites/uk/files/2017-11/under_the_skin_report.pdf.
Wang, D., Liu, M., Cao, J., Cheng, Y., Zhuo, C., Xu, H., Tian, S., Zhang, Y., Zhang, J. and Wang, F. (2012)
‘Effect of Colla corii asini (Ejiao) on D-Galactose Induced Aging Mice’, Biological and Pharmaceutical
Bulletin, 35(12), pp. 2128–2132. doi: 10.1248/bpb.b12-00238.
World Bank (2019) World Bank National Accounts Data, DataBank. Available at:
https://data.worldbank.org/indicator/NY.GDP.PCAP.KN?locations=CN (Accessed: 8 March 2019).
Xinhua News Agency (2016) ‘Shortage of donkey skin breeds TCM fakes’, China Daily, 28 January.
Available at: http://www.chinadaily.com.cn/china/2016-01/28/content_23287841.htm.
Xinhua News Agency (2017) ‘China cuts tariff on donkey hides’, CGTN, 31 December. Available at:
https://news.cgtn.com/news/3067444d35637a6333566d54/share_p.html (Accessed: 13 March
2019).
Yang, F., Song, J., Liang, M., Ma, F., Mao, X., Ma, C. W., Zhang, W. and Huang, Z. (2014) ‘Overview of
Beverages with Anti-Aging Functions in Chinese Market.’, Rejuvenation research, 17(2), pp. 1–4. doi:
10.1089/rej.2013.1514.
Yang, H., Yang, J., Wen, Z., Zha, Q., Nie, G., Huang, X., Zhang, C., Lu, A., Jiang, M. and Wang, X. (2012)
‘Effect of combining therapy with traditional chinese medicine-based psychotherapy and herbal
medicines in women with menopausal syndrome: A randomized controlled clinical trial’, Evidence-
based Complementary and Alternative Medicine, 2012. doi: 10.1155/2012/354145.
Yin and Yang House (no date) Yin Yang House Theory - Explore Acupuncture and Herbal Medicine- E
Jiao. Available at:
https://theory.yinyanghouse.com/theory/herbalmedicine/e_jiao_tcm_herbal_database (Accessed:
13 March 2018).
21You can also read