Frasers Logistics & Commercial Trust - Investor Presentation
←
→
Page content transcription
If your browser does not render page correctly, please read the page content below
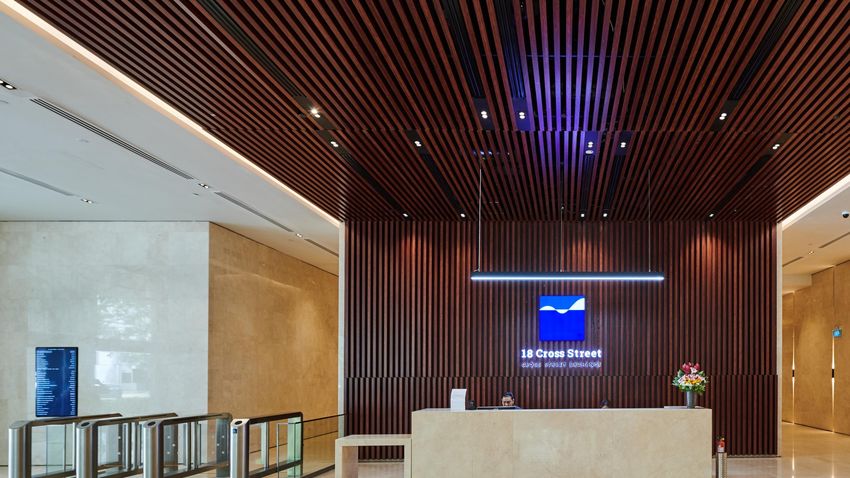
Hermes Bad Rappaneu Facility, Germany

Frasers Logistics & Commercial Trust
             Investor Presentation
                                                        16 August 2021
This presentation is for information only and does not constitute or form part of an offer, solicitation, recommendation or invitation for the sale or purchase or subscription of securities, including units in
Frasers Logistics & Commercial Trust (formerly known as Frasers Logistics & Industrial Trust) (“FLCT”, and the units in FLCT, the “Units”) or any other securities of FLCT. No part of it nor the fact of its
presentation shall form the basis of or be relied upon in connection with any investment decision, contract or commitment whatsoever. The past performance of FLCT and Frasers Logistics & Commercial
Asset Management Pte. Ltd. (formerly known as Frasers Logistics & Industrial Asset Management Pte. Ltd.), as the manager of FLCT (the “Manager”), is not necessarily indicative of the future
performance of FLCT and the Manager.
This presentation contains “forward-looking statements”, including forward–looking financial information, that involve assumptions, known and unknown risks, uncertainties and other factors which may
cause the actual results, performance, outcomes or achievements of FLCT or the Manager, or industry results, to be materially different from those expressed in such forward-looking statements and
financial information. Such forward-looking statements and financial information are based on certain assumptions and expectations of future events regarding FLCT's present and future business
strategies and the environment in which FLCT will operate. The Manager does not guarantee that these assumptions and expectations are accurate or will be realised. You are cautioned not to place
undue reliance on these forward-looking statements, which are based on the Manager’s current view of future events. The Manager does not assume any responsibility to amend, modify or revise any
forward-looking statements, on the basis of any subsequent developments, information or events, or otherwise, subject to compliance with all applicable laws and regulations and/or the rules of the
Singapore Exchange Securities Trading Limited (“SGX-ST”) and/or any other regulatory or supervisory body or agency.
The information and opinions in this presentation are subject to change without notice, its accuracy is not guaranteed and it may not contain all material information concerning FLCT. None of Frasers
Property Limited, FLCT, the Manager, Perpetual (Asia) Limited, in its capacity as trustee of FLCT, or any of their respective holding companies, subsidiaries, affiliates, associated undertakings or
controlling persons, or any of their respective directors, officers, partners, employees, agents, representatives, advisers or legal advisers makes any representation or warranty, express or implied, as to
the accuracy, completeness or correctness of the information contained in this presentation or otherwise made available or as to the reasonableness of any assumption contained herein or therein, and
any liability whatsoever (in negligence or otherwise) for any loss howsoever arising, whether directly or indirectly, from any use, reliance or distribution of this presentation or its contents or otherwise
arising in connection with this presentation is expressly disclaimed. Further, nothing in this presentation should be construed as constituting legal, business, tax or financial advice.
The value of Units and the income derived from them, if any, may fall or rise. Units are not obligations of, deposits in, or guaranteed by, the Manager or any of its affiliates. An investment in the Units is
subject to investment risks, including the possible loss of the principal amount invested. Investors should note that they have no right to request the Manager to redeem their Units while the Units are
listed. It is intended that holders of Units may only deal in their Units through trading on the SGX-ST. Listing of the Units on the SGX-ST does not guarantee a liquid market for the Units.
This advertisement has not been reviewed by the Monetary Authority of Singapore.
Nothing in this presentation constitutes or forms a part of any offer to sell or solicitation of any offer to purchase or subscribe for securities for sale in Singapore, the United States or any other jurisdiction
in which such offer, solicitation or sale would be unlawful prior to registration or qualification under the securities laws of any such jurisdiction.

                                                                                                                                                                                                                   2
6th largest SREIT(1) with a flagship portfolio of 103 properties in five developed countries

              103 properties                                S$6.8 billion                                96.3 %                                         4.9 years                             Sustainable Leadership
                                                                                                                                                                                              GRESB Sector Leader (Industrial)
              Across 5 Countries                            Portfolio Value(2)                           Occupancy Rate(3)                              WALE(3)                               for 3 consecutive years

  Australia                                     Germany                                       Singapore                                     United Kingdom                                The Netherlands

  62 Properties worth $2.95 billion             29 Properties worth $1.51 billion             2 Properties worth $1.28 billion              4 Properties worth $0.78 billion              6 Properties worth $0.32 billion
  (43.1% of total FLCT portfolio)               (22.1% of total FLCT portfolio)               (18.7% of total FLCT portfolio)               (11.4% of total FLCT portfolio)               (4.7% of total FLCT portfolio)

        L&I                             59            L&I                               29          CBD Commercial                   1            L&I                               1           L&I                              6

        CBD Commercial                    2                                                         Business Park                    1            Business Park                     3

        Business Park                     1

Note: S$ values, unless otherwise stated, are based on an exchange rate of A$1: S$1.0088, €1: S$1.5952 and £1:S$1.8605 as at 30 June 2021.
1. Based on market capitalisation as at 13 August 2021. 2. As at 30 June 2021. Excludes the recognition of right-of-use assets upon the adoption of FRS 116 Leases with effect from 1 October 2019. 2. Based on GRI, being the
contracted rental income and estimated recoverable outgoings for the month of June 2021. Excludes straight lining rental adjustments and include committed leases.                                                                   3
◆    Proven track record in executing value-accretive acquisitions: Over S$5.0 billion(1) of accretive acquisitions since IPO in June 2016
 ◆    Active portfolio rebalancing: ~S$460.8 million in strategic divestments all at premiums to book value
 ◆    Completed transformational merger with Frasers Commercial Trust in April 2020                                                                                                                      FY21
 ◆    Announced S$562.4 million portfolio acquisition of six European properties on 24 May 2021, with concurrent
      private placement priced at top end of price range to raise gross proceeds of ~S$335.8 million                                                                        FY20
      to part-fund the acquisition                                                                                                                                                                        S$6.8b
                                                                                                                                                                                                           AUM
                                                                                                                                                                           S$6.2b
                                                                                                                             FY19                                           AUM
                                                                                                                                                                                                 Maiden entry into the UK
                                                                                       FY18                                                                                                      logistics sector, with an
                                                                                                                              S$3.5b                                                             integrated logistics and
                                                                                                                               AUM                                                               business park in
                                               FY17                                     S$2.9b                                                            Completed milestone merger             Birmingham; acquired
             FP16                                                                        AUM                     Strengthened presence in
                                                                                                                                                          with Frasers Commercial Trust          four L&I properties in
                                                                                                                                                          introducing a new asset class and      Germany and the
                                                                                                                 Europe and Australia through
                                                                                                                                                          two new geographies                    Netherlands
                                               S$1.9b                      Maiden acquisition of 21              the acquisition of 13 new L&I
              S$1.6b                            AUM                        German and Dutch L&I                  properties
               AUM                                                                                                                                        Acquired a L&I property
                                                                           properties & acquired two
                                                                                                                                                          in Australia and a
                                         Acquired seven new                Australian L&I properties
                                                                                                                                                          business park in the UK
                                         logistics & industrial
                                         (“L&I”) properties in
   Listed on SGX-ST                      Australia                                                               Divested two non-core                      Divested remaining 50% interest in    Divested three non-
   (20 Jun 2016)                                                                                                 Australian properties and 50%              one Australian property               core South Australian
   ◆ 51 Australian                                                                                               interest in one Australian
                                                                          Divested two non-core                                                                                                   Properties
      properties + three call                                                                                    property
                                                                          Australian properties
      options
   ◆ IPO price at S$0.89
      per unit

1. Excludes three IPO call option properties. Includes the FCOT portfolio’s book value of approximately S$2.5 billion and based on 100% interest in Farnborough Business Park.                                        4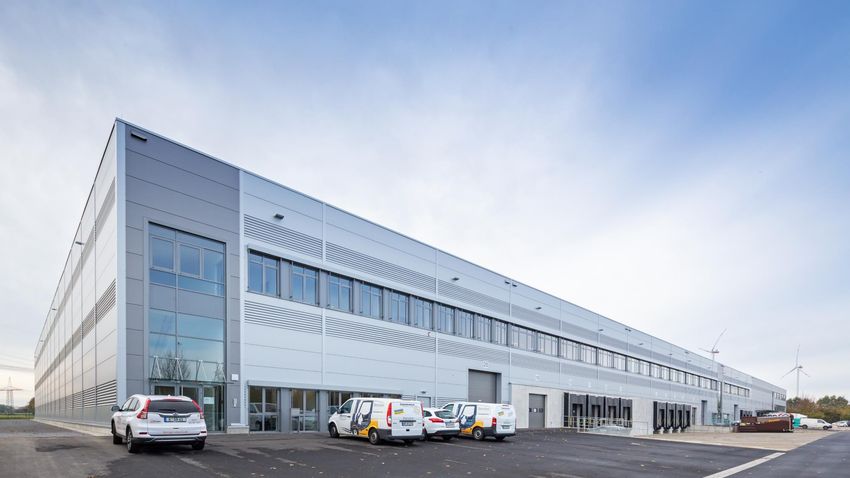
Trading Performance (Trailing 12-month to 13 August 2021)                                                                                                                                          6th largest SREIT
                                                                                                                                                                                                   ~S$5.6 billion market
                                                                                                                                                                                                   capitalisation(2)
                                                                                 FLCT               FTSE ST REIT                                    FLCT Closing Price:
 125%                                                                                                                                               S$1.52 (13 Aug 21)
                                                                                                                                                                                                    ~10.5 million units
            FLCT Opening Price:                                                                                                                                                                     Trailing 12-month average
 115%       S$1.35 (13 Aug 20)                                                                                                                                                                      daily traded volume

 105%
                                                                                                                                                                                                   ~5.0%(3)
                                                                                                                                                                                                   Attractive distribution
   95%
                                                                                                                                                                                                   yield

   85%
    13 Aug 20       17 Sep 20       22 Oct 20       26 Nov 20        04 Jan 21          08 Feb 21        16 Mar 21        21 Apr 21   28 May 21       02 Jul 21      10 Aug 21                      +12.6%
                                                                                                                                                                                                    Trailing 12-month unit
                                                                                                                                                                                                    price movement

Attractive Trading Yield                                                                                                                   Key Index Memberships

           5.0%
                                                                                                                                              Constituent of the FTSE EPRA/NAREIT Global
                                     3.1%                                                                                                     Developed Index since March 2019
                                                                1.5%
                                                                                           0.8%
                                                                                                                        0.2%

          FLCT                       STI                  10-yr Singapore           5-yr Singapore                   12-month S$                  Included as a constituent stock of the benchmark
      Annualised Yield             TTM Yield             Government Bond           Government Bond                   Fixed Deposit                Straits Times Index (STI) on 13 April 2021
Sources: Bloomberg LLP, Monetary Authority of Singapore (MAS).
1. For the period from 13 August 2020 to 13 August 2021. Assumes dividends are reinvested. 2. As at 13 August 2021. 3. Based on FLCT’s closing price of S$1.52 per unit as at 13 August 2021 and by annualising FLCT’s
1HFY21 distribution of 3.80 Singapore cents.
                                                                                                                                                                                                                                5
Property Portfolio Sustainability Credentials Green and Sustainable Financing
Industrial The industrial portfolio named Global Sector Leader (Listed Industrial) Established a
Leadership for the third consecutive year in the 2020 GRESB Assessment(1)
Sustainable Finance
Framework in July 2021
Strong
Commercial Top-5 in Asia Pacific Diversified – Office/Industrial(1)
Performance
Highest Rated
Industrial
Highest Green Star performance-rated industrial portfolio in Australia(2)
First to achieve 6 Star Green Star ratings for industrial facilities in each
>S$1.4 billion
Portfolio in of New South Wales, Victoria and Queensland
In green and sustainable/
Australia sustainability-linked
financing since IPO
357 Collins Street and Caroline Chisholm Centre: minimum 5.0-star
Minimum 4.5-
Central Park: first commercial building in Australia to achieve 4.5-star
star NABERS(4) NABERS Energy base building rating, first premium office building in
Energy ratings Perth to attain 5.0-star NABERS Energy base building rating S$150 million
Maiden sustainability notes
BREEAM Farnborough Business Park and Maxis Business Park: ‘Excellent’/ ‘Very issuance in July 2021
ratings(5) Good’ BREEAM ratings
BCA Green
Please visit the FLCT website for further details on
BCA rating(6)(7) Mark Cross Street Exchange: BCA Green Mark Gold Plus certification
its sustainability strategy, performance and the
Gold Plus Sustainable Finance Framework
1. Refers to the 2020 Real Estate Assessments by GRESB, the global ESG benchmark for real estate. 2. Portfolio Green Star ratings as at 30 September 2020. Green Star ratings are awarded by the Green Building Council of
Australia (GBCA) which has assessed the Australian properties against nine key performance criteria – energy, water, transport, materials, indoor environment quality management, land use and ecology, emissions and innovation. 3.
Based on lettable area. 4. Refers to the National Australian Built Environment Rating System, Australia’s leading independent, evidence based built environment rating system. 5. Refers to the Building Research Establishment
Environment Assessment Method, the world’s leading sustainability assessment for master planning projects, infrastructure and buildings. 6. Green Mark certification by the Building and Construction Authority, Singapore. 7. Green
Mark re-certification for Alexandra Technopark is currently underway. Alexandra Technopark was certified Green Mark Gold prior to re-certification. 6
3QFY21 Performance
Highlights

                     Blythe Valley Park, Birmingham, United Kingdom
Active asset management with focused growth & capital management initiatives

                                                                      74,865 sqm of leasing completed in 3QFY21,                                                                        103 properties
   Asset                                                              representing 2.8% of total lettable area                                                                          Across 5 Countries

   Management
                                                                      +0.8% portfolio rental reversion for 3QFY21                                                                       S$6.8 billion
                                                                                                                                                                                        Portfolio Value(3)

                                                                      S$564.2m(1) portfolio acquisition of six European
                                                                                                                                                                                        4.9 years
                                                                                                                                                                                        WALE(4)
                                                                      properties announced on 24 May 2021
   Acquisition
   Growth                                                             Concurrent private placement priced at top end of the
                                                                      price range to raise gross proceeds of ~S$335.8 million
                                                                                                                                                                                        96.3%
                                                                                                                                                                                        Occupancy Rate(4)

                                                                                                                                                                                        36.4%
                                                                                                                                                                                        Aggregate Leverage
                                                                      S$540m refinanced in the year-to-date(2)
   Capital
   Management                                                         Inaugural issuance of S$150 million, 7-year 2.18%
                                                                      fixed coupon sustainability notes in July 2021
                                                                                                                                                                                        3.1 years
                                                                                                                                                                                        Average Weighted Debt
                                                                                                                                                                                        Maturity

Note: S$ values, unless otherwise stated, are based on an exchange rate of A$1: S$1.0088, €1: S$1.5952 and £1:S$1.8605 as at 30 June 2021.
1. Based on an exchange rate of €1 : S$1.6112 and £1 : S$1.8736. 2. Financial Year ending 30 September 2021 3. As at 30 June 2021. Excludes the recognition of right-of-use assets upon the adoption of FRS 116 Leases
with effect from 1 October 2019. 4. Based on GRI, being the contracted rental income and estimated recoverable outgoings for the month of June 2021. Excludes straight lining rental adjustments and include committed
leases.                                                                                                                                                                                                                  8
Key Credit Metrics
Key Credit Metrics Well-spread Debt Maturity Profile
Borrowings due in 4QFY21 of S$235m have been either refinanced or will be
As at Change from refinanced with facilities that have been put in place
30 Jun 2021 31 Mar 2021
Over 95% of the borrowings due in FY22 matures in 2HFY22
FLCT established its Sustainable Finance Framework (“SFF”) in July 2021 and issued
Aggregate Leverage 36.4% ▲ 1.1 p.p.
its maiden sustainability notes of S$150m with a 7-year tenor, under the SFF
Cost of Borrowings 1.7%(1) ▼ 0.2 p.p.
Total Gross Borrowings: S$2,562 million
Debt Maturity Profile
Average Weighted Debt Maturity 3.1 years - (S$ MILLIONS) 696
630
50 203
% of Borrowings at Fixed Rates 69.4%(2) ▼ 1.2 p.p. 486
64
(5)
Interest Coverage Ratio 7.0x(3) ▲ 0.2x 313 132
235 240 580
16
202
81 19 228
Debt Headroom(4) S$1,910 m ▼ S$19 m 141 23 66 71
133
136 114
78 50 62 71
Credit Rating (S&P) BBB+ / Stable -
FY2021 FY2022 FY2023 FY2024 FY2025 FY2026 > FY2026
AUD EUR SGD GBP
1. Based on trailing 12 months borrowing cost. 2. Or 72.5% after adjusting for the fixed rate notes issuance of S$150m in July 2021. 3. As defined in the Code on Collective Investment Schemes revised by the Monetary Authority
of Singapore on 16 April 2020 and clarified on 29 May 2020 and computed as trailing 12 months EBITDA (excluding effects of any fair value changes of derivatives and investment properties, and foreign exchange translation),
over trailing 12 months borrowing costs. Borrowing costs include effects of FRS 116. 4. Prior to reaching the 50.0% aggregate regulatory leverage limit. 9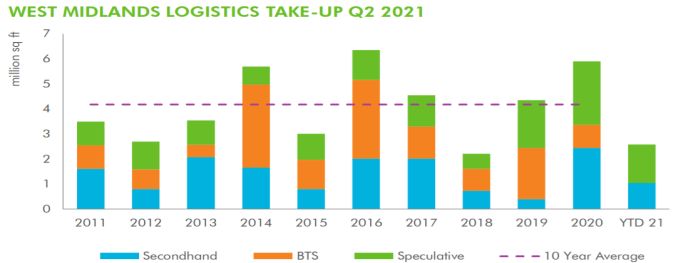
Breakdown by Asset Type and Geography(1)                                                                        103 Properties in Five Developed Countries(1)

                                                                                                                   Logistics & Industrial              Commercial                          Total

                                                                                                                    95                                  8                                   103
                                                                                                                    Properties                          Properties                          Properties
   Office &
                                                   Germany,
   Business Parks,                                 22.1%                                                            $3,958.5 m                          $2,879.4 m                          $6,837.9 m
   23.1%                                                                                                            Portfolio value(1)                  Portfolio value(1)                  Portfolio value(1)
                                United Kingdom,             The Netherlands,
                                11.4%                       4.7%
                                                                                                                    2,274,464 sqm                       381,314 sqm                         2,655,778 sqm
                                                                                            Logistics &             Lettable area                       Lettable area                       Lettable area
                                                                                            Industrial,
                                    Singapore,
                                    18.7%
                                                                                            57.9%                   5.5 years                           4.1 years                           4.9 years
                                                         Australia,
                                                                                                                    WALE(2)                             WALE(2)                             WALE(2)
                                                         43.1%

                                                                                                                    5.4 years                           3.4 years                           4.5 years
                                                                                                                    WALB(2)                             WALB(2)                             WALB(2)
             CBD
             Commercial,
             19.0%                                                                                                  100.0%                              91.8%                               96.3%
                                                                                                                    Occupancy rate(2)                   Occupancy rate(2)                   Occupancy rate(2)

1. As at 30 June 2021 and based on portfolio value which excludes the recognition of right-of-use assets upon the adoption of FRS 116 Leases with effect from 1 October 2019. 2. Based on GRI, being the contracted rental
income and estimated recoverable outgoings for the month of June 2021. Excludes straight lining rental adjustments and include committed leases.                                                                             10
74,865 sq m of leasing for 3QFY21
3QFY21 Industrial Leasing Summary
Lettable Area Average Lease
No. of Leases Annual Increment Reversion(1)
(sqm) Term
Australia 6 49,569 2.5 years 2.8 – 3.5% -3.3%
74,865 sqm
leased/renewed in Europe 1 13,677 7.0 years CPI-linked 3.7%
3QFY21
3QFY21 Reversion: -2.0%
TTM(2) Reversion: -3.7%
3QFY21 Commercial Leasing Summary
+0.8% No. of Leases
Lettable Area
Average Lease Term Reversion(1)
portfolio rental reversion (sqm)
for 3QFY21
Singapore 14 3,756 3.2 years 4.0%
Australia 1 920 8.0 years 0.0%
UK 8 6,943 6.7 years 4.7%
3QFY21 Reversion: 4.4%
TTM(2) Reversion: 1.0%
1. Calculated based on the signing gross rent (excluding any contracted fixed annual rental step-ups) of the new/renewed lease divided by the preceding terminating gross rent of each new/renewed lease (weighted by
gross rent) of existing space. Excludes newly created space and leases on spaces with extended void periods of >18 months. 2. Refers to reversion on leases contracted for the trailing 12-month period from 1 July 2021 to
30 June 2021. 11Portfolio Lease Expiry Profile as at 30 June 2021(1)
Well spread-out lease expiry profile with no more than 16.4% of GRI Logistics & Industrial
2.0% expiring in any single year, translating into reduced concentration risk Business Space
GRI due for renewal 3 industrial and 18 commercial leases for renewal in 4QFY21, each
in 4QFY21
constituting ≤0.3% of GRI
17.6%
16.4%
15.7%
4.9%
9.9% 11.3%
9.8% 10.6%
9.1%
4.9%
2.1% 7.2%
4.4%
5.8% 2.0% 12.7%
0.6%
3.7%
6.5% 6.4% 7.0%
2.0% 5.4% 5.1% 5.2% 5.2%
3.7% 1.6% 0.6%
0.0% 1.0%
1.0% 1.0%
Vacant Sep-21 Sep-22 Sep-23 Sep-24 Sep-25 Sep-26 Sep-27 Sep-28 Sep-29 Sep 2030
and beyond
1. Based on GRI, being the contracted rental income and estimated recoverable outgoings for the month of June 2021. Excludes straight lining rental adjustments and include committed leases. 12Occupancy Review
Breakdown by asset type
Logistics & Industrial As at 30 Jun 21(1) As at 31 Mar 21 Change
Australia 100.0% 100.0% -
Europe 100.0% 100.0% -
(2)
United Kingdom 100.0% 100.0% -
Logistics & Industrial Portfolio: 100.0% 100.0% -
Commercial Country As at 30 Jun 21(1) As at 31 Mar 21 Change
Cross Street Exchange Singapore 84.0% 82.6% ▲ 1.4%
Alexandra Technopark Singapore 98.7% 98.7% -
Central Park Australia 82.3% 82.9% ▼ 0.6%
Caroline Chisholm Centre Australia 100.0% 100.0% -
357 Collins Street Australia 95.6% 95.6% -
Farnborough Business Park United Kingdom 85.5% 91.8% ▼ 6.3%
Maxis Business Park United Kingdom 100.0% 100.0% -
(3) (2)
Blythe Valley Park United Kingdom 90.5% 95.7% ▼ 5.2%
Commercial Portfolio: 91.8% 93.6%
1. Based on GRI, being the contracted rental income and estimated recoverable outgoings for the month of June 2021. Excludes straight lining rental adjustments and include committed leases. 2. Acquisition was
completed on 4 June 2021 3. Rental guarantees are provided over vacant spaces as at 30 June 2021. 13Top-10 Portfolio Tenants
WALE
No. Top-10 Portfolio Tenants(1) Country % of GRI (Years)
23.5% 5.1 years
GRI contribution Average WALE for 1. Commonwealth of Australia Australia 4.7% 4.0
from Top-10 tenants Top-10 tenants
2. Google Asia Pacific Singapore 3.7% 3.5
High-quality tenant base with majority of portfolio
tenants comprising Government or related 3. Hermes Germany GmbH Germany 2.6% 11.3
entities, MNCs, conglomerates and listed
companies 4. Rio Tinto Shared Services Australia 2.3% 9.0
5. Commonwealth Bank of Australia Australia 1.9% 1.5
Well-diversified tenant base with no single
tenant accounting for more than 4.7% of
6. CEVA Logistics (Australia) Australia 1.9% 4.0
portfolio GRI(1)
7. BMW Germany 1.8% 6.6
8. Schenker Australia Australia 1.6% 3.4
9. Techtronic Industries Australia Australia 1.6% 2.4
10. Mainfreight United Kingdom 1.4% 4.7
Caroline Chisholm Centre, Canberra, Australia
1. Based on GRI, being the contracted rental income and estimated recoverable outgoings for the month of June 2021. Excludes straight lining rental adjustments and include committed leases. 14Well-diversified tenant base with lower concentration risk
Portfolio Tenant Sector Breakdown(1)(2)
3PL / Distribution 23.5%
58.3%
Consumer & Retail Products 19.4% 1.7%
of GRI contribution from
L&I tenants Manufacturing 6.6%
Automotives Manufacturing 4.3%
IT Products & Services 7.6%
Government and related 5.0%
~82.7% Insurance & Financial Services 4.5%
of the enlarged portfolio
enjoys exposure to Consultancy/Business Solutions 3.9%
tenants in government-
Media & Telecoms 2.1%
linked; core and resilient
industries; and attractive Flexible Workspace 2.2%
New Economy(3) sectors
Medical/Pharmaceuticals 1.9%
Mining/Resources 2.8%
Logistics & Industrial
Engineering 2.7% Business Space
Food & Beverage 2.1%
Others 4.5% 5.2%
1. Based on GRI, being the contracted rental income and estimated recoverable outgoings for the month of June 2021. Excludes straight lining rental adjustments and include committed leases. 2. Exclude vacancies. 3. “New
Economy” sectors refer to high-growth industries with a high adoption of technology and innovation in operations, such as third-party logistics; e-commerce (consumer and enterprise); Information Technology and services amongst
others. 15Update and commentary
The REIT Manager is working closely with FLCT’s customers to overcome this challenging period together while focusing on managing any near- to mid-term
downside risk from the pandemic
The COVID-19 impact on FLCT’s distributable income for 9MFY21 is approximately S$1.1 million, comprising mainly rental waivers and allowance for doubtful
receivables attributable to the Covid-19 pandemic, which has not been material for the REIT
The REIT Manager will continue to monitor the situation closely, support our tenants and exercise prudence
FLCT
Australia Singapore Europe & UK
No material impact to the FLCT portfolio
Limited impact on the Minimal impact arising from Limited impact on the to-date with only the retail segment of the
industrial and commercial recently implemented German, Dutch and UK commercial portfolio, which represents
properties COVID-19 measures, such industrial portfolios just 1.6%(3) of FLCT’s overall income,
Expects near- to mid-term as the reversion to safe Progressive relaxation of being more challenged
impact on the retail management measures for COVID-19 restrictions from Structural changes driven by the growth
components of the Australian Phase 2 (Heightened Alert) mid-July, with the UK of e-commerce activities and ‘hub-and-
portfolio from 22 July 2021 to 18 Government no longer spoke’ trend are expected to drive
August 2021(1) instructing people to work demand for logistics and suburban office
Expects near- to mid-term from home if they can(2) spaces, respectively
impact on the retail
components of the Singapore
portfolio FLCT’s resilient portfolio, strong balance
sheet and financial flexibility well-
positions the REIT to face the current
challenging global environment
1. https://www.moh.gov.sg/news-highlights/details/going-back-to-phase-2-heightened-alert 2. https://www.gov.uk/guidance/covid-19-coronavirus-restrictions-what-you-can-and-cannot-do 3. Based on GRI, being the
contracted rental income and estimated recoverable outgoings for the month of June 2021. Excludes straight lining rental adjustments and include committed leases. 16Our Objectives: To deliver stable and regular distributions to unitholders and achieve sustainable long-term growth in DPU
Harnessing FLCT’s Competitive Advantages Proactive leasing to maintain high occupancy rate, long
Active Asset WALE and a diversified tenant base. Assess and undertake
Prime and modern, strategically located and diversified logistics AEIs(1) to unlock further value
Management Incorporate green features to improve environmental
and commercial portfolio in major developed markets performance
High occupancy rate, stable lease structure and long WALE Pursue strategic acquisition opportunities of quality
with a well-diversified tenant base in attractive sectors Acquisition properties. Availability of a Sponsor’s ROFR, with a value in
excess of S$5 billion
Growth Selective third-party acquisitions
Healthy financials and a strong balance sheet with diverse
sources of funding providing financial flexibility
Optimise capital mix and prudent capital management
Proven track record in undertaking value-accretive Maintain a healthy balance sheet and well-spread debt
Capital & Risk
acquisitions, and portfolio recycling at premiums to book value expiry profile with diverse funding sources
Management At least 50% borrowings are at or hedged to fixed interest
rates
Experienced REIT Manager, and strong alignment of interest
with a committed and reputable Sponsor, Frasers Property
Industry-leading sustainability credentials and a continuing Development of properties complementary to the existing
commitment to high ESG standards
Selective portfolio; and the re-development of existing assets and by
Development leveraging the Sponsor’s development pipeline
Incorporate sustainability initiatives in developments
1. Development activities can be up to 10% of the current AUM as per MAS guidelines. FLCT may exceed the regulatory limit of not
more than 10% of the company’s deposited property (subject to maximum of 25%) only if additional allowance of up to 15% of the
deposited property is utilised solely for redevelopment of an existing property that has been held for 3 years and continues to be
held for 3 years after completion and specific approval of unitholders for redevelopment is obtained. 17Market Information
Hermes Bad Rappaneu Facility, GermanyKey economic indicators and market overview
Key Economic Indicators(1) Industrial and Commercial Market Overview (3)
Sequential GDP Industrial Prime Grade Net Face Rent Prime CBD Commercial Net Face Rent
+1.8% for the Mar 21 quarter (A$/sqm/yr) (A$/sqm/yr)
+3.2% for the preceding quarter
Brisbane Melbourne Sydney Perth Melbourne
$150 $145 $700
$140 (+1.2% y-o-y) $625
$650
Unemployment Rate $130
(+0% y-o-y)
$626
4.9% for the month of Jun 21 $120 $116
(+1.2% y-o-y)
$600
(+0.5% y-o-y)
Improved from 5.1% in May 21 $110 $550
$100
$97 $500
$90 (+2.4% y-o-y)
Consumer Price Index $80 $450
2Q17 2Q18 2Q19 2Q20 2Q21 2Q17 2Q18 2Q19 2Q20 2Q21
3.8% for the 12 months to Jun 21
1.1% for the 12 months to Mar 21
National Total Supply for Industrial National Total Supply for CBD Commercial
(‘000 sqm) (‘000 sqm)
Cash Rate
500
0.1% 1,950
Unchanged since Nov 20 1,750 400
10-year average 10-year average
1,550 300
10-year bond yield 1,350
200
1.12% 1,150
100
As at 29 Jul 21(2) 950
750 0
2Q17 2Q18 2Q19 2Q20 2Q21 2Q17 2Q18 2Q19 2Q20 2Q21
1. Sources: Australian Bureau of Statistics and the Reserve Bank of Australia. 2. Capital Market Yields – Government Bonds – Daily (As at 29 July 2021). 3. Jones Lang LaSalle Real Estate Intelligence Service Q1 2021. 19Key economic indicators and market overview
Key Economic Indicators in Germany(1) Key Economic Indicators in the Netherlands(4)
Sequential GDP Unemployment Rate Sequential GDP Unemployment Rate
1.5% for the Jun 21 quarter 3.7% for the month of Jun 21 -0.8% for the Mar 21 quarter 3.2% for the month of Jun 21
-2.1% for the preceding quarter Unchanged from 3.7% in May 21 From -0.1% in the preceding quarter From 3.3% in May 21
Consumer Price Index EURIBOR Consumer Price Index
2.3% for the 12 months to Jun 21 -0.544% 3-month EURIBOR 2.0% for the 12 months to Jun 21
From 2.5% in May 21 Remained in the negative range(2) From 2.0% for the 12 months to May 21
German Industrial Market Overview(3) Dutch Industrial Market Overview(3)
• Take-up in Germany increased 48% year-on-year in 2Q21 as the market continues to recover • The Dutch market maintained good activity in terms of take-up in H1 2021 in line with the
from the effects of COVID-19. Demand is largely driven by the e-commerce market which saw volumes recorded in previous years. Due to low availability, take-up continued to shift towards non-
several large transactions transacted. traditional / less established locations.
• Prime rents have remained high in major logistics hubs as a result of limited supply and • Prime rents have stabilised, but strong demand and low availability are continually putting an
transactions signed for speculative developments of logistics parks. upward pressure on rents.
• Investment volumes recorded €2.2 billion in 2Q21 across the major logistics hubs, with the 55% • The logistics sector continues to be driven by e-commerce. Investment volumes are steady, even
year-on-year increase largely due to a weak 2Q in 2020 though product appears to be limited in the past quarter.
• Prime yields remain unchanged at a record low of 3.35%. • Investor focus has shifted from other sectors to logistics. Yields further compressed throughout the
country with a record yield at 3% in Tilburg.
Take-up and Prime Rents in Germany (for warehouses >5,000 sqm) Take-up and Prime Rents in the Netherlands (for warehouses >5,000 sqm)
‘000 sqm H1 H2 Prime Rents €/sqm/yr ‘000 sqm H1 H2 Prime Rents €/sqm/yr
8,000 4,000
86.4 85.0
80 80
6,000
3,370 3,751 4,034 4,104 2,000 1,620 1,180 1,490
4,000 2,901 940 60
60
2,000 3,600 600 1,280 1,210 1,450 1,250 1,510
2,710 2,620 2,720 2,860 2,728
0 420 40
0 40
2016 2017 2018 2019 2020 2016 2017 2018 2019 2020 2021
2021
1. Source: Destatisches Bundesamt (Federal Statistics Office of Germany). 2. Source: https://www.euribor-rates.eu/en/current-euribor-rates/ (As at 29 July 2021). Applicable for both Germany and the Netherlands. 3. Source: BNP
Paribas Real Estate Q2 2021. 4. Source: CBS (Statistics Netherlands). 20Key economic indicators and market overview
Key Economic Indicators(1) Singapore Office and Business Park Markets Overview(3)
Sequential GDP Grade A and Grade B Office Rents Business Park Rents(4)
(S$ psf per month) (S$ psf per month)
-2.0% for the Jun 21 quarter
+3.1% for the preceding quarter Grade A Grade B Islandwide
Business Park (City Fringe)
$14.0
11.30 11.15 Business Park (Rest of the Island)
$12.0 10.10 10.50
Unemployment Rate 8.95
$6.5
5.50 5.70 5.80 5.85 5.80
$10.0
2.9% for the month of Mar 21 $8.0
$5.5
3.75 3.80 3.75
$4.5 3.70 3.65
From 3.0% for the month of Feb 21 $6.0 7.25
7.95 7.85
6.85 7.15
$4.0 $3.5
$2.0 $2.5
Consumer Price Index 2Q17 2Q18 2Q19 2Q20 2Q21 2Q17 2Q18 2Q19 2Q20 2Q21
0.6% y-o-y in Jun 21
0.8% y-o-y in May 21 Office Supply-Demand Dynamics Business Park Supply-Demand Dynamics
Singapore Overnight Rate Average(2)
0.1150%
As at 3 Aug 21
10-year bond yield
1.28%
As at 3 Aug 21(2)
Net supply Net absorption Vacancy rate (RHA) Net supply Net absorption Vacancy rate (RHA)
1. Sources: Singstat, Ministry of Trade and Industry Singapore, Ministry of Manpower Singapore. 2.Source: MAS SGS. 3. Source: CBRE, Singapore Market View, Q2 2021. 4. Alexandra Technopark is a high-specification B1
industrial development located at the city-fringe, with certain physical attributes similar to business parks. Due to limited availability of market research information directly relating to the asset class of Alexandra Technopark, market
research information for business parks is provided for indicative reference. 21Key economic indicators and market overview
Key Economic Indicators(1) South East Commercial Market Overview(3)
Sequential GDP • Take-up levels across the South East was in Investment Volumes (£ mil)
excess of 990,000 sq ft in H1 2021, representing
-1.6% for the Mar 21 quarter a 9.0% increase y-o-y as compared to H1 2020.
H1 H2 H1 5-year average
+1.3% for the preceding quarter The development pipeline remains severely
constrained. 1,744 3,140
1,840 1,838 1,384 1,337
2,126
Unemployment Rate • Investment levels hit a record high in H1
1,487 1,140 1,192 1,022 1,206
2021
4.8% for the month of May 21 2021 due to a well-performing Q2 that
2016 2017 2018 2019 2020
4.8% for the month of Apr 21 registered £1,560 million worth of Headline Rents (£ psf per year)
transactions. Bracknell Farnborough
29.0
27.5 27.5 28.0 28.0
Consumer Price Index • Prime rents have remained largely stable 26.5 28.0
27.0 28.0
across the South East office market q-o-q. 26.5
2.4% for the 12 months to Jun 21 23.5 23.5
2.1% for the 12 months to May 21
Q2 16 Q2 17 Q2 18 Q2 19 Q2 20 Q2 21
Bank Rate
Midlands Industrial Market Overview(3)
0.1%
Unchanged since Mar 20 • Take-up in the West Midlands has seen a
110% q-o-q increase to 1.7 mil sq ft, enabling
H1 2021 to reach a total take-up of 2.6 mil sq ft.
10-year bond yield
• Prime rents increased 7% and are now
0.52% registering at c. £7.50 per sq ft p.a.
As at 3 Aug 21(2) • Prime yields have remained at 4.00%.
1. Source: Office for National Statistic, Bank of England, published April 2021. 2. Source: Bloomberg LLP (Last accessed on 3 August 2021). 3. Source: CBRE Research Q2 2021. 22Appendix:
Additional Market Information
Cross Street Exchange, SingaporeSydney
◆ Supply: New completions over the last 12 months totaled 308,127 sqm, which is below the historic ten-year average. There were limited new completions in 2Q21 with only four
developments reaching completion totalling 76,903 sqm of GLA. The Sydney development pipeline remains strong with approximately 461,500 sqm of new supply expected to be completed in the
next six months.
◆ Demand: In 2Q21, Sydney recorded 443,463 sqm of gross take-up which is significantly higher than the historic ten-year average. The strong gross take-up is supported by high demand
from transport, postal and warehousing users who accounted for 48% of gross take-up during the quarter. The largest lease executed during the quarter was a 73,963 sqm prelease to Techtronic
Industries at Stage 1 of The Yards at Kemps Creek. This property is being developed by Frasers Property Industrial.
◆ Rents: Low vacancy rates and a shortage of developable land has translated to an average y-o-y rental growth of approximately 1.2% across all industrial precincts. The Outer Central
West continues to perform strongly with net face rents growing by 2.6% to A$130/sqm net. Prime industrial incentives have also decreased slightly over the previous 12 months as demand remains
high. Average prime incentives in the Outer Central West are currently sitting at 13%.
◆ Vacancy: As at March 2021, industrial vacancies in Sydney remain near historic 5-year lows with approximately 575,149 sqm of available space. Sydney industrial vacancy are expected to
increase over the next 12 months as new speculative stock is completed.
Sydney Industrial Total Supply Sydney Industrial Prime Grade Net Face Rents
800 $145
150 $144
700 $140
140 $136
600
$130
(‘000 sqm)
(A$/sqm/yr)
500
130 $122 $124
400 $120 $121
300 120 $115
200
110
100
0 100
2Q12 2Q13 2Q14 2Q15 2Q16 2Q17 2Q18 2Q19 2Q20 2Q21 2Q12 2Q13 2Q14 2Q15 2Q16 2Q17 2Q18 2Q19 2Q20 2Q21
Completed 10-year annual average
Annualised as at 2Q21
Sources: Jones Lang LaSalle Real Estate Intelligence Service – Sydney Industrial Final Data 2Q21; Jones Lang LaSalle Real Estate Intelligence Service – Sydney Industrial Snapshot 2Q21; Jones Lang LaSalle Real Estate Data
Solution – Sydney Construction Projects from 3Q 2011 to 2Q 2021; Knight Frank Research – National Industrial March 2021. 25Melbourne
◆ Supply: A total of 11 projects with a total GLA of 256,607 sqm reached practical completion in Melbourne over 2Q21. Of this, 87% of the new supply was pre-committed. Over the last 12 months,
969,496 sqm of new stock was completed in Melbourne which is significantly above the historic ten-year average.
◆ Demand: Demand for industrial space in Melbourne remain strong despite the ongoing COVID-19 pandemic. During the second quarter, gross take-up totalled 445,690 sqm which is significantly
above the 10-year average. The West industrial precinct recorded over 269,100 sqm of gross take representing 60% of all take-up during the quarter.
◆ Rents: Despite high levels of new supply in Melbourne, industrial face rents have recorded modest growth with the South East and West industrial precincts growing at 3.9% and 4.7%
respectively. The South East continues to be one of the strongest performing precinct with face rents increasing slightly to A$95/sqm net. Average Incentives in South East have also reduced during
the quarter to around 20%.
◆ Vacancy: During the March quarter, vacancies in Melbourne declined 20% as a result of strong tenant demand. As at March 2021, there was approximately 886,314 sqm of available industrial space
in the Melbourne market. However, vacancy rates in Melbourne are expected to increase over the next 12 months as new speculative stock is completed.
Melbourne Industrial Total Supply Melbourne Industrial Prime Grade Net Face Rents
1,200 100
$97
1,000
$94 $94
95
800 $92
(‘000 sqm)
(A$/sqm/yr)
$91
$90
600 $88 $89
90 $88
400 $85
85
200
0 80
2Q12 2Q13 2Q14 2Q15 2Q16 2Q17 2Q18 2Q19 2Q20 2Q21 2Q12 2Q13 2Q14 2Q15 2Q16 2Q17 2Q18 2Q19 2Q20 2Q21
Completed 10-year annual average
Annualised as at 2Q21
Sources: Jones Lang LaSalle Real Estate Intelligence Service – Melbourne Industrial Final Data 2Q21; Jones Lang LaSalle Real Estate Intelligence Service – Melbourne Industrial Snapshot 2Q21; Jones Lang LaSalle Real
Estate Data Solution – Melbourne Construction Projects from Q32011 to 2Q 2021; Knight Frank Research – National Industrial March 2021. 26Brisbane
◆ Supply: During the June quarter, two developments were completed in Brisbane adding 51,703 sqm of GLA to the market. Over the last 12 months, development activity in Brisbane has been slightly
below the 10-year average, with 286,119 sqm of new stock being added to the market. The supply pipeline remains relatively strong with 13 projects under construction, totalling 365,077 sqm
primarily located in the southern industrial precinct.
◆ Demand: Tenant demand for industrial space in Brisbane has strengthened over the June quarter with 178,882 sqm of gross take-up being recorded. 77% the new leases were
concentrated in the South. The largest transaction of the quarter was a 45,000 sqm pre-lease to Winning Appliances at 3746 Ipswich Road, Wacol.
◆ Rents: Rental rates remained relatively stable across Brisbane over 2Q21. Over the previous 12 months face rents in the Southern region increased 1.5% to A$112/sqm net. Incentives in
Brisbane South has remained stable at 20% for prime industrial assets however incentives are expected to increase as new speculative developments reach completion.
◆ Vacancy: Vacancy levels in Brisbane have increased in 1Q21 as a result of speculative developments reaching completion. As at March 2021, the level of available industrial space is approximately
612,732 sqm. However, vacancy rates in Brisbane are expected to increase over the next 12 months as new speculative stock is completed.
Brisbane Industrial Total Supply Brisbane Industrial Prime Grade Net Face Rents
500 130
450
400
350 $120 $120 $118 $118
$117
(A$/sqm/yr)
120 $116
(‘000 sqm)
300 $115
$114
250 $111 $111
200
150 110
100
50
0 100
2Q12 2Q13 2Q14 2Q15 2Q16 2Q17 2Q18 2Q19 2Q20 2Q21 2Q12 2Q13 2Q14 2Q15 2Q16 2Q17 2Q18 2Q19 2Q20 2Q21
Completed 10-year annual average
Annualised as at 2Q21
Sources: Jones Lang LaSalle Real Estate Intelligence Service – Brisbane Industrial Final Data 2Q21; Jones Lang LaSalle Real Estate Intelligence Service – Brisbane Industrial Snapshot 2Q21; Jones Lang LaSalle Real Estate Data
Solution – Brisbane Construction Projects from Q3 2011 to 2Q21; Knight Frank Research – National Industrial March 2021.
27Melbourne CBD office
◆ Supply: There were no new major commercial developments completed in the Melbourne CBD in 2Q21. There are currently eight new developments (283,190 sqm) and two building
refurbishments (60,720 sqm) under construction in the Melbourne CBD. The developments are expected to be completed by 2024.
◆ Demand: Tenant demand in Melbourne CBD has remains weak as COVID-19 restrictions continue to remain in effect. During 2Q21, the Melbourne CBD experienced a slight positive net
absorption of 6,575 sqm however the leasing market remains challenging with significant amounts of sub-lease space being offered to the market. Occupier demand is expected to remain subdued over
the short term, as tenants continue to assess future office space requirements. JLL expects the Melbourne market to recover throughout 2021 with leasing activity increasing throughout the year.
◆ Rents: Tenant demand in the Melbourne CBD has remained subdued over Q2 2021 and has resulted in an increase in vacancies and incentives. Over the last 12 months, average net prime rents in
Melbourne CBD have increased by 0.5% to A$626/sqm, although we note that face rents have not recovered to their pre-COVID levels. Prime incentives in the Melbourne CBD have also increased
slightly over the quarter and are currently at 35.5%. Despite the positive rental growth, the increase of incentives has resulted in negative effective rental growth over the quarter.
◆ Vacancy: As at 2Q21, the vacancy rate in Melbourne’s CBD decreased slightly to 14.12%. As at 30 June 2021, there is approximately 721,149 sqm of vacant commercial space in the Melbourne CBD.
According to JLL, vacancies are expected to peak in 2021 as new supply reaches completion and additional sublease space is offered to the market.
Melbourne Commercial Total Supply Melbourne Prime Grade Net Face Rent
180 700
160 650 $623 $626
140 $573 $585
600
120 $528
(A$/sqm/yr)
(‘000 sqm)
550
100
80
500 $452 $466
$421 $431
60 450 $409
40 400
20 350
0 300
2Q12 2Q13 2Q14 2Q15 2Q16 2Q17 2Q18 2Q19 2Q20 2Q21 2Q12 2Q13 2Q14 2Q15 2Q16 2Q17 2Q18 2Q19 2Q20 2Q21
Completed 10-year annual average
Annualised as at 2Q21
Sources: Jones Lang LaSalle Real Estate Intelligence Service – Melbourne CBD Office Final Data 2Q21; Jones Lang LaSalle Real Estate Intelligence Service – Melbourne CBD Office Snapshot 2Q21; Jones Lang LaSalle Real
Estate Data Solution – Melbourne CBD Office Construction Projects from 3Q 2011 to 2Q 2021. 28Perth CBD office
◆ Supply: Development activity in the Perth CBD has been subdued with no new developments being completed in the last 12 months. There are currently two major new developments under
construction in the Perth CBD, Chevron HQ and Capital Square Tower 2. The two developments are expected to be completed in 4Q 2023 and 4Q 2021 respectively and will provide approximately
79,200 sqm of commercial space to the Perth Market. Due the persistently high vacancy rates in Perth there is unlikely to be any additional developments added to the supply pipeline.
◆ Demand: Tenant demand has remained subdued with Perth CBD however during Q2 2021 Perth recorded a slight positive net absorption of 8,500 sqm. Tenant enquiry has begun to pick up
particularly for fitted out B-grade office accommodation. The new enquiry is primarily driven by the mining and professional service sectors. The WA State Government remains an active player in the
market as it continues to review its office space requirements.
◆ Rents: Despite the ongoing impact of COVID-19, prime rents in the Perth CBD have remained stable over the previous 12 months. The average net prime rents in the Perth CBD are currently
A$625/sqm net. Over the quarter incentives for prime office space have also remained stable at 49%. The high-level of incentives is due to continued high vacancy rates and modest tenant demand
in the Perth CBD office market.
◆ Vacancy: During 2Q 2021 the vacancy rate in Perth CBD decreased slightly to 19.69%. Currently, there is approximately 355,853 sqm of vacant commercial space in the Perth CBD market. Vacancy
rates are expected to continue to decrease as demand from the mining and professional service sector are expected to increase over the next 12 months.
Perth CBD Office Total Supply Perth CBD Office Prime Grade Net Face Rent
800
160 $748
140 $741
750
120 $693
(A$/sqm/yr)
(‘000 sqm)
100 700
$654
80 $631
60 650 $618 $618 $621 $625 $625
40 600
20
0 550
2Q12 2Q13 2Q14 2Q15 2Q16 2Q17 2Q18 2Q19 2Q20 2Q21 2Q12 2Q13 2Q14 2Q15 2Q16 2Q17 2Q18 2Q19 2Q20 2Q21
Completed 10yr Annual Average
Sources: Jones Lang LaSalle Real Estate Intelligence Service – Perth CBD Office Final Data 2Q21; Jones Lang LaSalle Real Estate Intelligence Service – Perth CBD Office Snapshot 2Q21;
Jones Lang LaSalle Real Estate Data Solution – Perth CBD Office Construction Projects from Q3 2011 to 2Q21. 29CBD office
◆ Supply: There have been some new office completions in Q2 21, bringing total new completions in the 12-month period to 30 June 21 at c.289.2k million sq ft. The bulk of the office supply will be
injected into the market from 2021 to 2023, with bigger projects that include Capitaspring, Guoco Midtown and Central Boulevard Towers slated for completion by 2023.
◆ Demand: With limited new and expansionary demand, most of the leasing transactions comprised renewals and relocations. Net absorption was -0.36 mil sq ft in Q2 2021, which was contributed
by earlier relocation moves and downsizing efforts by occupiers. Islandwide vacancy rate rose from 5.9% in 1Q21 to 6.8% in 2Q21.
◆ Rents: In 1Q21, Grade A rental rates rose q-o-q at $10.50 psf/month. While Grade B market rents continue to struggle to backfill the existing vacant stock,placing further pressure on Grade B and
Core CBD rents.
◆ Vacancy: As a result of earlier relocation moves, Grade A vacancy rates rose from 3.3% in Q1 2021 to 4.4% in this quarter. Nevertheless, this remained well under the 10 year historical average
vacancy rate of 5.9%.
Singapore Grade A and Grade B office rents
$14
11.30
$12 11.30
10.60 10.60 11.15
(S$ psf per month)
10.10 10.10 10.50 2Q 21 Q-o-q
9.55
$10 9.50 8.95 Singapore office rents
(psf/ month) (%)
$8
Grade A CBD Core S$10.50 ▲ 1.0
7.70 8.00 7.95 7.85
$6 7.15 7.21 7.10 7.25 6.85 7.25 7.15
Grade B CBD Core S$7.75 ▼ 0.6
$4
Grade B Islandwide S$7.15 ▼ 0.7
$2
2Q11 2Q12 2Q13 2Q14 2Q15 2Q16 2Q17 2Q18 2Q19 2Q20 2Q21
Grade A Grade B Islandwide
Source: CBRE, Singapore Market View, Q2 2021.
30Business park(1)
◆ Supply: The completion of on-going projects are expected to be delayed by at least three months due to disruptions in the construction industry. 2Q21 has seen new completions of c. 155.8k sq ft of
new business park completions, after three consecutive quarters of no new completions.
◆ Demand: Leasing activity was subdued in 2Q21, with renewals and relocations continuing to feature. Total island wide net absorption registered at 0.13 mil sq ft in 2Q21. mainly technology and media
industries exhibited expansionary appetite for business park sector.
◆ Rents: Given the high vacancy rates in the Rest of Island submarket, landlords maintained some flexibility in rental negotiations. In 2Q21, rentals remained stabled at $3.65psf/ month for Rest of
Island business parks and $5.80 for City Fringe business parks.
◆ Vacancy: With net absorption trailing behind net supply, island wide vacancy rose marginally from 12.9% in 1Q21 to 13.0% in 2Q21.
Singapore Business Park rents
$6.5 Singapore business park 2Q 21 Q-o-q
5.80 5.85 5.80
$6.0 5.50 5.50 5.50 5.70 rents (psf/ month) (%)
5.35 5.30 5.50
(S$ psf per month)
$5.5 5.05
$5.0 City fringe S$5.80 ▲ 0.9
$4.5 Rest of Island S$3.65 -
3.65 3.80 3.80 3.65 3.70 3.70 3.75 3.80 3.75 3.65
$4.0 3.60
$3.5
$3.0
$2.5
2Q11 2Q12 2Q13 2Q14 2Q15 2Q16 2Q17 2Q18 2Q19 2Q20 2Q21
Business Park (City Fringe) Business Park (Rest of the Island)
Source: CBRE, Singapore Market View, Q2 2021.
1. Alexandra Technopark is a high-specification B1 industrial development located at the city-fringe, with certain physical attributes similar to business parks. Due to limited availability of market research information directly relating
to the asset class of Alexandra Technopark, market research information for business parks is provided for indicative reference. 31Appendix:
Portfolio and Capital Management Information
Walter-Gropius Straße 19, Bergheim, GermanyAs at 30 June 2021 Australia Germany The Netherlands UK Total
No. of Properties 59 29 6 1 95
Portfolio Value(1) S$2,055.2 m S$1,509.9 m S$318.3 m S$75.1 m S$3,958.5 m
Lettable Area 1,311,199 sqm 709,858 sqm 233,873 19,534 2,274,464 sqm
Average Age by Value 8.9 years 7.3 years 12.7 years 4.0 years 8.5 years
WALE(2) 4.3 years 7.0 years 8.4 years 10.1 years 5.5 years
WALB(2) 4.3 years 6.9 years 8.4 years 9.2 years 5.4 years
Occupancy Rate(2) 100.0% 100.0% 100.0% 100.0% 100.0%
Average Annual Rental Increment 3.1% Fixed/CPI-linked(3) CPI-linked CPI-linked N.M.
Proportion of Freehold Assets(1) 71.1% 94.9% 100.0% 100.0% 82.9%
Bad Rappenau, Venlo, Bielefield, Sydney, Brisbane, Mainz, Connexion,
Germany The Netherlands Germany Australia Australia Germany the UK
1. As at 30 June 2021 and excludes the recognition of right-of-use assets upon the adoption of FRS 116 Leases with effect from 1 October 2019. 2. Based on GRI, being the contracted rental income and estimated recoverable
outgoings for the month of June 2021. Excludes straight lining rental adjustments and include committed leases. 3. 96.4% of the leases have either CPI-linked indexation or fixed escalations. 33Caroline
As at 30 June Alexandra Farnborough Maxis Business Blythe Valley
Chisholm
2021 Technopark Business Park Park Park
Centre
Country Canberra, Australia Singapore United Kingdom United Kingdom United Kingdom
Caroline Chisholm Centre Alexandra Technopark
Ownership 100.0% 100.0% 100.0% 100.0% 100.0%
Property
Value 248.0 626.4 331.6 127.3 247.6
(S$ m)(1)
Lettable Area
40,244 96,086 51,006 17,859 41,643 Farnborough Business Park Maxis Business Park
(sqm)
WALE(2) 4.0 years 2.6 years 5.1 years 5.7 years 7.2 years
WALB(2) 4.0 years 2.4 years 3.7 years 2.4 years 5.1 years
Occupancy
100.0% 98.7% 85.5% 100.0% 90.5%(3)
Rate(2)
Blythe Valley Park
1. As at 30 June 2021. 2. Based on GRI, being the contracted rental income and estimated recoverable outgoings for the month of June 2021. Excludes straight lining rental adjustments and include committed leases.
3. Rental guarantees are provided over vacant spaces as at 30 June 2021.
34Cross Street 357 Collins Central
As at 30 June 2021
Exchange Street Park
Country Singapore Melbourne, Australia Perth, Australia
Cross Street Exchange
Ownership 100.0% 100.0% 50.0%
Property Value
652.3 323.4 322.8(2)
(S$ m)(1)
Lettable Area (sqm) 36,497 31,962 66,016
357 Collins Street
WALE(3) 2.6 years 2.2 years 6.0 years
WALB(3) 2.6 years 2.1 years 6.0 years
Occupancy Rate(3) 84.0% 95.6% 82.3%
Central Park
1. As at 30 June 2021. 2. Based on 50% interest in the property. 3. Based on GRI, being the contracted rental income and estimated recoverable outgoings for the month of June 2021. Excludes straight lining rental
adjustments and include committed leases. 35Top-10 tenants
Breakdown by asset type
% of FLCT % of FLCT WALE
Top-10 Logistics & Industrial Tenants(1) Portfolio GRI WALE (Years) Top-10 Commercial Tenants(1) Portfolio GRI (Years)
Hermes, Germany 2.6% 11.3 Commonwealth of Australia 4.7% 4.0
Ceva Logistics, Australia 1.9% 4.0 Google Asia Pacific, Singapore 3.7% 3.5
BMW, Germany 1.8% 6.6 Rio Tinto, Australia 2.3% 9.0
Schenker, Australia 1.6% 3.4 Commonwealth Bank of Australia 1.9% 1.5
Techtronic Industries, Australia 1.6% 2.4 WeWork, Australia and Singapore 1.1% 8.9
Mainfreight, the Netherlands 1.4% 4.7 Fluor Limited, United Kingdom 1.0% 3.8
Inchcape Motors, Australia 1.3% 2.4 GroupM Singapore Pte Ltd, Singapore 1.0% 2.1
Constellium, Germany 1.2% 6.0 Service Stream, Australia 0.9% 3.4
Bakker Logistics, the Netherlands 1.2% 9.4 Syneos Health UK Ltd, UK 0.8% 6.6
Suntory Beverage & Food Asia Pte Ltd,
Bosch, Germany 1.1% 7.1 0.7% 1.9
Singapore
Total: Average: Total: Average:
15.7% 6.0 years 18.1% 4.5 years
1.Based on GRI, being the contracted rental income and estimated recoverable outgoings for the month of June 2021. Excludes straight lining rental adjustments and include committed leases. 36Lease Expiry Profile
Logistics & Industrial
Industrial Portfolio Lease Expiry Profile as at 30 June 2021(1)
(Based on % of industrial Portfolio GRI)
Australia Germany and the Netherlands United Kingdom
22.8%
1.0%
15.0%
11.5% 12.6%
11.7%
0.2%
9.7% 2.3% 1.7% 4.9% 9.3% 9.5%
9.2%
1.2%
2.9% 2.9%
5.3%
9.4% 9.6%
8.5% 7.7%
6.3% 6.4% 6.8%
1.8% 1.9%
4.2%
1.6% 0.3%
0.0% 1.8%
Vacant Sep-21 Sep-22 Sep-23 Sep-24 Sep-25 Sep-26 Sep-27 Sep-28 Sep-29 Sep 2030
and beyond
1.Based on GRI, being the contracted rental income and estimated recoverable outgoings for the month of June 2021. Excludes straight lining rental adjustments and include committed leases. 37Lease Expiry Profile
Commercial
Commercial Portfolio Lease Expiry Profile as at 30 June 2021(1)
(Based on % of commercial Portfolio GRI)
Australia Singapore UK
23.8%
22.3%
2.6%
7.0%
8.1%
11.0% 11.1%
9.9% 8.7%
1.5%
8.2% 3.0%
3.0%
3.0% 1.4%
13.1%
8.2% 4.6% 4.4%
2.8%
2.1% 6.0% 1.0%
1.3% 1.3%
6.6% 3.4% 0.6% 3.1% 6.7%
0.1% 1.1%
2.6% 1.4% 0.4%
1.3% 0.2% 0.7% 0.9% 0.2%
0.6% 0.9%
Vacant Sep-21 Sep-22 Sep-23 Sep-24 Sep-25 Sep-26 Sep-27 Sep-28 Sep-29 Sep 2030
and beyond
1.Based on GRI, being the contracted rental income and estimated recoverable outgoings for the month of June 2021. Excludes straight lining rental adjustments and include committed leases. 38Prudent Capital Management
Investment Properties(1) and Debt(2) as at 30 June 2021
6,638 Investment Properties Debt
Total: S$6,638 million Total: S$2,562 million
2,949
2,562
1,829
1,180 1,279
362 718 581 302
Total Portfolio Australian Portfolio European Portfolio Singapore Portfolio UK Portfolio
Interest Risk Management as at 30 June 2021
SGD,
17.6%
69.4 % (3) Fixed, Variable,
Borrowings at fixed rates 69.4% 30.6%
▼ 1.2 p.p from 31 March 21 EUR,
9.9% AUD, 1.3%
Note: As reported by FLCT in its 1HFY21 results announcement dated 6 May 2021.
1. Excludes recognition of right-of-use assets upon the adoption of FRS 116 Leases with effect from 1 October 2019. 2. Refers to debt in the currency or hedged currency of the country of the investment properties. 3. Or 72.5% after adjusting for the fixed rate notes
issuance of S$150m in July 2021. 39Frasers Property entities Other acronyms
FLCT: Frasers Logistics & Commercial Trust AEI: Asset Enhancement Initiative
FLT: Frasers Logistics & Industrial Trust CBD: Central Business District
FCOT: Frasers Commercial Trust COVID-19: Coronavirus disease 2019
FPL or the Sponsor: Frasers Property Limited DPU: Distribution per Unit
The Group: Frasers Property Limited, together with its subsidiaries EURIBOR: Euro Interbank Offered Rate
FY: Financial year
Financial Year GRESB: Global Real Estate Sustainability Benchmark
FY19: Period from 1 October 2018 to 30 September 2019 GRI: Gross Rental Income
FY20: Period from 1 October 2019 to 30 September 2020 IPO: Initial Public Offering
FY21: Period from 1 October 2020 to 30 September 2021
2HFY19: Period from 1 April 2019 to 30 September 2019
L&I: Logistics & Industrial
1HFY20: Period from 1 October 2019 to 31 March 2020 NAV: Net Asset Value
2HFY20: Period from 1 April 2020 to 30 September 2020 NLA: Net Lettable Area
1HFY21: Period from 1 October 2020 to 31 March 2021 p.p.: percentage points
2QFY21: Period from 1 January 2021 to 31 March 2021 REIT: Real estate investment trust
3QFY21: Period from 1 April 2021 to 30 June 2021 RBA: Reserve Bank of Australia
4QFY21: Period from 1 July 2021 to 30 September 2021 ROFR: Right of First Refusal
2HFY22: Period from 1 April 2022 to 31 September 2022
S&P: S&P Global Ratings
SFF: Sustainable Finance Framework
SGX-ST: Singapore Exchange Securities Trading Limited
SME: Small and Medium-sized Enterprise
sq ft: Square feet
sqm: Square metres
TTM: Trailing 12-month
UK: the United Kingdom
WALE: Weighted average lease expiry
Additional notes WALB: Weighted average lease to break
In the tables, the arrow direction indicates the increase (up) or decrease (down) of the absolute Y-o-Y: Year-on-year
figure, The colour indicates if the change is positive (green), negative (red) or neutral (black).
40You can also read