Frasers Logistics & Commercial Trust - 1HFY21 Results Presentation
←
→
Page content transcription
If your browser does not render page correctly, please read the page content below
Frasers Logistics & Commercial Trust
            1HFY21 Results Presentation
                                          6 May 2021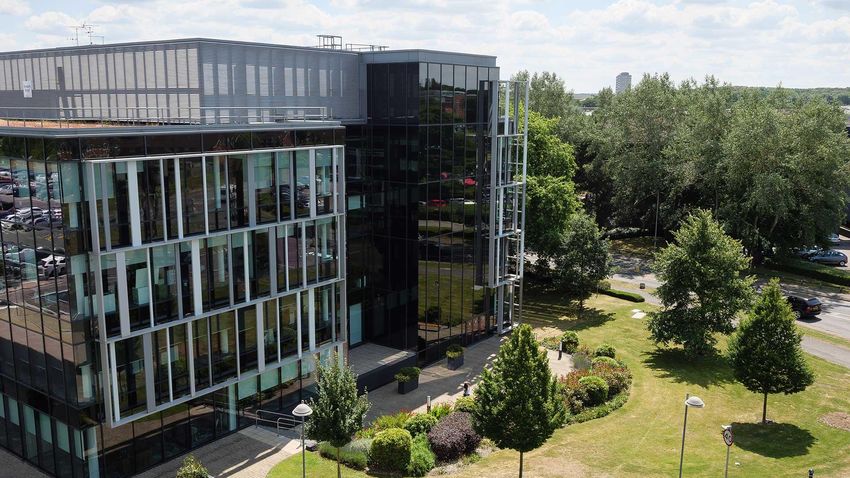
This presentation is for information only and does not constitute or form part of an offer, solicitation, recommendation or invitation for the sale or purchase or subscription of securities, including units in
Frasers Logistics & Commercial Trust (formerly known as Frasers Logistics & Industrial Trust) (“FLCT”, and the units in FLCT, the “Units”) or any other securities of FLCT. No part of it nor the fact of its
presentation shall form the basis of or be relied upon in connection with any investment decision, contract or commitment whatsoever. The past performance of FLCT and Frasers Logistics & Commercial
Asset Management Pte. Ltd. (formerly known as Frasers Logistics & Industrial Asset Management Pte. Ltd.), as the manager of FLCT (the “Manager”), is not necessarily indicative of the future
performance of FLCT and the Manager.
This presentation contains “forward-looking statements”, including forward–looking financial information, that involve assumptions, known and unknown risks, uncertainties and other factors which may
cause the actual results, performance, outcomes or achievements of FLCT or the Manager, or industry results, to be materially different from those expressed in such forward-looking statements and
financial information. Such forward-looking statements and financial information are based on certain assumptions and expectations of future events regarding FLCT's present and future business
strategies and the environment in which FLCT will operate. The Manager does not guarantee that these assumptions and expectations are accurate or will be realised. You are cautioned not to place
undue reliance on these forward-looking statements, which are based on the Manager’s current view of future events. The Manager does not assume any responsibility to amend, modify or revise any
forward-looking statements, on the basis of any subsequent developments, information or events, or otherwise, subject to compliance with all applicable laws and regulations and/or the rules of the
Singapore Exchange Securities Trading Limited (“SGX-ST”) and/or any other regulatory or supervisory body or agency.
The information and opinions in this presentation are subject to change without notice, its accuracy is not guaranteed and it may not contain all material information concerning FLCT. None of Frasers
Property Limited, FLCT, the Manager, Perpetual (Asia) Limited, in its capacity as trustee of FLCT, or any of their respective holding companies, subsidiaries, affiliates, associated undertakings or
controlling persons, or any of their respective directors, officers, partners, employees, agents, representatives, advisers or legal advisers makes any representation or warranty, express or implied, as to
the accuracy, completeness or correctness of the information contained in this presentation or otherwise made available or as to the reasonableness of any assumption contained herein or therein, and
any liability whatsoever (in negligence or otherwise) for any loss howsoever arising, whether directly or indirectly, from any use, reliance or distribution of this presentation or its contents or otherwise
arising in connection with this presentation is expressly disclaimed. Further, nothing in this presentation should be construed as constituting legal, business, tax or financial advice.
The value of Units and the income derived from them, if any, may fall or rise. Units are not obligations of, deposits in, or guaranteed by, the Manager or any of its affiliates. An investment in the Units is
subject to investment risks, including the possible loss of the principal amount invested. Investors should note that they have no right to request the Manager to redeem their Units while the Units are
listed. It is intended that holders of Units may only deal in their Units through trading on the SGX-ST. Listing of the Units on the SGX-ST does not guarantee a liquid market for the Units.
This advertisement has not been reviewed by the Monetary Authority of Singapore.
Nothing in this presentation constitutes or forms a part of any offer to sell or solicitation of any offer to purchase or subscribe for securities for sale in Singapore, the United States or any other jurisdiction
in which such offer, solicitation or sale would be unlawful prior to registration or qualification under the securities laws of any such jurisdiction.

                                                                                                                                                                                                                   2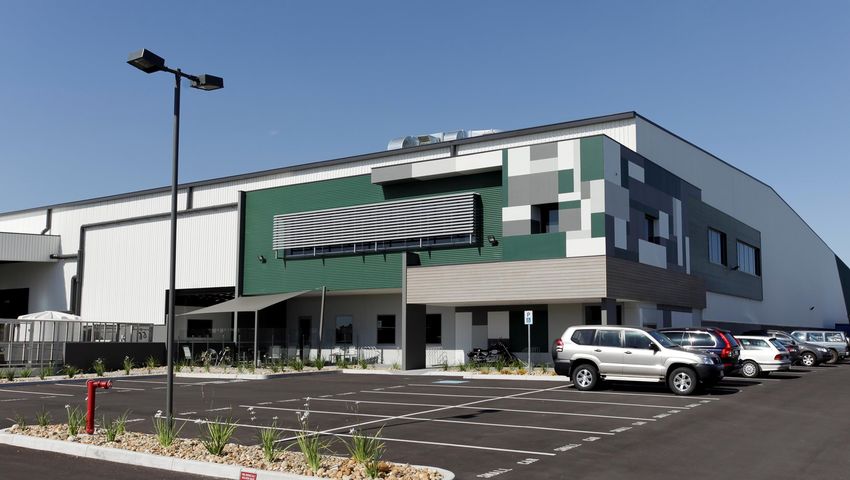
Frasers Property entities                                                                            Other acronyms
FLCT: Frasers Logistics & Commercial Trust                                                           AEI: Asset Enhancement Initiative
FLT: Frasers Logistics & Industrial Trust                                                            CBD: Central Business District
FCOT: Frasers Commercial Trust                                                                       COVID-19: Coronavirus disease 2019
FPL or the Sponsor: Frasers Property Limited                                                         DPU: Distribution per Unit
The Group: Frasers Property Limited, together with its subsidiaries                                  EURIBOR: Euro Interbank Offered Rate
                                                                                                     FY: Financial year
Financial Year                                                                                       GRESB: Global Real Estate Sustainability Benchmark
FY19: Period from 1 October 2018 to 30 September 2019                                                GRI: Gross Rental Income
FY20: Period from 1 October 2019 to 30 September 2020                                                IPO: Initial Public Offering
FY21: Period from 1 October 2020 to 30 September 2021
2HFY19: Period from 1 April 2019 to 30 September 2019
                                                                                                     L&I: Logistics & Industrial
1HFY20: Period from 1 October 2019 to 31 March 2020                                                  NAV: Net Asset Value
2HFY20: Period from 1 April 2020 to 30 September 2020                                                NLA: Net Lettable Area
1HFY21: Period from 1 October 2020 to 31 March 2021                                                  p.p.: percentage points
2QFY21: Period from 1 January 2021 to 31 March 2021                                                  REIT: Real estate investment trust
                                                                                                     RBA: Reserve Bank of Australia
                                                                                                     ROFR: Right of First Refusal
                                                                                                     S&P: S&P Global Ratings
                                                                                                     SGX-ST: Singapore Exchange Securities Trading Limited
                                                                                                     SME: Small and Medium-sized Enterprise
                                                                                                     sq ft: Square feet
                                                                                                     sqm: Square metres
                                                                                                     UK: the United Kingdom
                                                                                                     WALE: Weighted average lease expiry
                                                                                                     WALB: Weighted average lease to break
                                                                                                     Y-o-Y: Year-on-year
Additional notes
In the tables, the arrow direction indicates the increase (up) or decrease (down) of the absolute
figure, The colour indicates if the change is positive (green), negative (red) or neutral (black).

                                                                                                                                                             3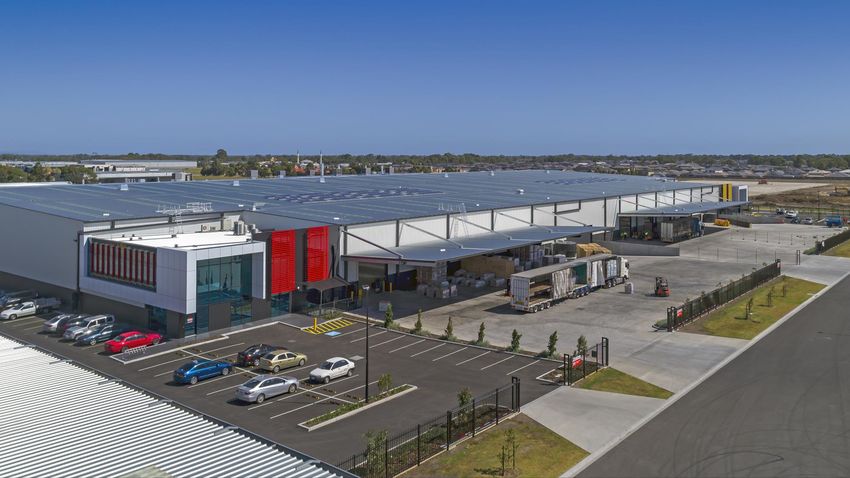
Operational stability and financial growth

       1.        Operational Highlights                                                        2.       Robust Financials

                         Proactive lease management
                                                                                                                     S$130.4 million                                                                 35.3%
                                                                                                                     1HFY21 Distributable Income                                                     Aggregate Leverage(1)
                         126,133 sqm                                                                                 ▲ 71.1% y-o-y                                                                   S$1,929 million headroom (3)
                         leased/renewed in 1HFY21
                         representing 5.0% of portfolio lettable area

                                                                                                                     3.80 Singapore cents                                                           S$1.14
                                                                                                                     1HFY21 DPU                                                                     NAV per Unit(1)
                         High portfolio occupancy rate(1)(2)
                                                                                                                     ▲ 9.5% y-o-y                                                                   ▲ 3.6% from 30 Sep 20
                         96.8%
                         High-quality and resilient portfolio

                                                                                               3.        Corporate Milestones
                         Active Portfolio Management
                         Completed divestment of three non-core
                         South Australian properties on 24 March                                                   FLCT included as a constituent                                                       Assigned first time ‘BBB+’
                         2021                                                                                      stock of the benchmark Straits                                   BBB+                credit rating by S&P Global,
                                                                                                                   Times Index on 13 April 2021                                                         with a ‘Stable’ outlook
                                                                                                                                                                                                        on 15 April 2021

1. As at 31 March 2021. 2. Based on GRI, being the contracted rental income and estimated recoverable outgoings for the month of March 2021. Excludes straight lining rental adjustments and include committed leases. 3. Prior to reaching the 50.0% aggregate
regulatory leverage limit.
                                                                                                                                                                                                                                                                  4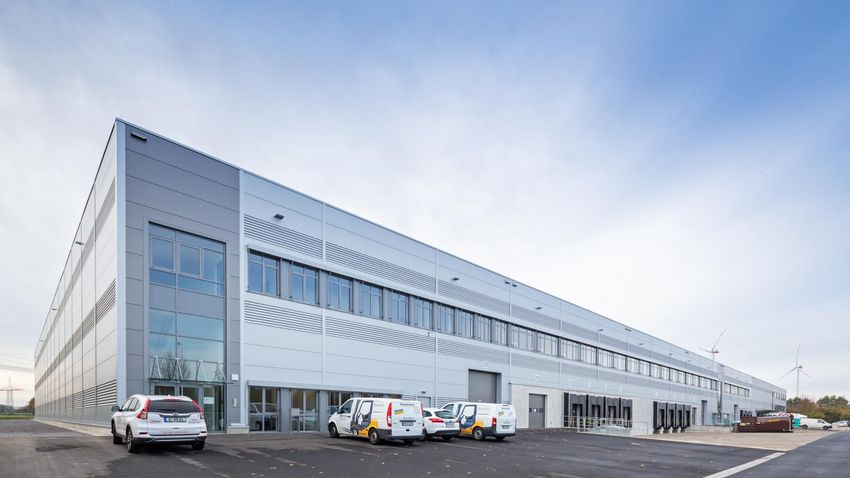
Stable and growing DPU

                                                             Distribution Timetable

                                                             Distribution Period                 1 October 2020 to 31 March 2021

                                                             Distribution Rate                   3.80 Singapore cents

                                                             Ex-date                             12 May 2021

                                                             Record Date                         17 May 2021

                                                             Distribution Payment Date           18 June 2021

                                                             DPU History (Singapore cents)

                                                                                                                                    3.80

                                                                                                                 3.65    +4.1%

                                                                                          3.47      +5.2%
                                                                       3.46
                                                                                 +0.3%

                 Saalhoffer Straße 211, Rheinberg, Germany
                                                                   2HFY19                1HFY20                 2HFY20             1HFY21
                                                                                                                                            5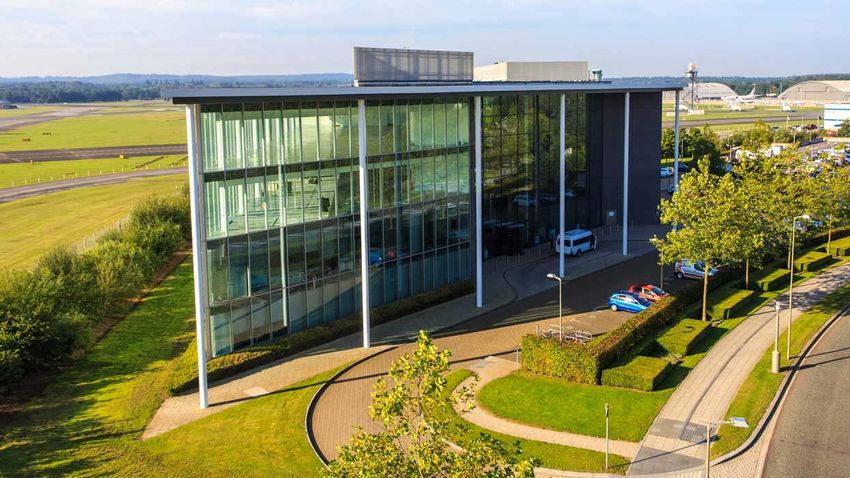
Financial Review

                   150-168 Atlantic Drive, Keysborough, Melbourne, Australia
Key Highlights
                                                          •     DPU for 1HFY21 at 3.80 Singapore cents is 9.5% higher than 1HFY20
                                                          •     Higher revenue and adjusted net property income resulted from the Merger(1) with Frasers Commercial
                  3.80 Singapore cents                          Trust in April 2020, the acquisitions undertaken in FY20 and strengthening of AUD:SGD and EUR:SGD.
                  1HFY21 DPU                                    This was partially offset by the effect of the Sandstone Place Divestment and SA Portfolio Divestment (1)
                  ▲ 9.5% y-o-y                                  and S$1.2 million of rental waivers and allowance for doubtful receivables attributable to the Covid-19
                                                                pandemic
                                                          •     The increase in finance costs was due mainly to higher borrowings due to the Merger with FCOT
                                                          •     Gain on divestment of investment properties relates to (a) Sandstone Place Divestment which was
                  100%                                          completed on 23 November 2020; and (b) SA Portfolio Divestment which was completed on 24 March
                                                                2021.
                  Distributable income
                  payout since IPO
                                                          Financial Highlights (S$’000)                                               1HFY21                           1HFY20                    Change (%)

                                                          Revenue                                                                    231,701                           118,745                      ▲ 95.1
                  Policy to hedge
                                                          Adjusted Net Property Income(2)                                            173,890                           96,980                       ▲ 79.3
                  distributions on a
                  rolling six-month basis                 Finance costs                                                               23,416                           13,656                       ▲ 71.5
                  to manage forex                         Gain on divestment of investment properties                                  2,451                            1,422                       ▲ 72.4
                  volatility on income
                                                          Distributable Income to Unitholders                                         130,426                          76,217                       ▲ 71.1
                                                          DPU (Singapore cents)                                                         3.80                             3.47                        ▲ 9.5

1. Please refer to Pages 2 and 4 of FLCT’s Financial Statements Announcement dated 6 May 2021 for details of the capitalised terms. 2. Adjusted Net Property Income is calculated based on the actual net property
income excluding straight lining adjustments for rental income and adding lease payments of right-of-use assets.                                                                                                     7
As at 31 March 2021

◆    The value of investment properties decreased by 0.6% from S$6,501 million as at 30 September 2020 to S$6,462 million as at 31 March 2021, due
     mainly to:
         The completion of the divestment of the 50% interest in 99 Sandstone Place, Parkinson, Queensland
         The completion of the divestment of three leasehold industrial properties in South Australia
          partially offset by:
         Higher AUD/SGD and GBP/SGD exchange rates
      FLCT is in a net current liability position as at 31 March 2021 due to the maturity of short-term borrowings of S$320 million. The REIT Manager is in discussion
      with banks to refinance the various loans
◆    Net asset value per Unit increased 3.6% from S$1.10 as at 30 September 2020 to S$1.14 as at 31 March 2021.

    Balance Sheet (S$’000)                                                        As at 31 Mar 21                 As at 30 Sep 20               Net asset value per Unit (S$)

    Investment properties                                                                   6,461,951                    6,500,881(1)
                                                                                                                                                                                                  1.14
    Other non-current assets                                                                    60,985                          34,182
    Current assets                                                                            204,799                         199,584
    Total assets                                                                            6,727,735                       6,734,647
                                                                                                                                                                1.10             +3.6%
    Loans and borrowings(2)                                                                 2,471,071                       2,620,806
    Other liabilities                                                                         317,739                         307,164
    Total liabilities                                                                       2,788,810                       2,927,970
                                                                                                                                                           30-Sep-20                        31-Mar-21
1. Includes investment property held for sale. 2. Gross borrowings net of upfront debt related expenses, includes lease liabilities recognised due to the adoption of FRS 116 Leases effective from 1 October 2019.
                                                                                                                                                                                                                      8
Key credit metrics
Key Credit Metrics Well-spread Debt Maturity Profile
Successfully refinanced and partially paid down c.S$378 million of borrowings in
As at Change from 1HFY21
31 Mar 2021 31 Dec 2020 The Manager is in advanced discussion with banks on the refinancing of the
borrowings maturing in the next 6 months and is confident of refinancing them
Aggregate Leverage 35.3% ▼ 0.9 p.p.
Total Gross Borrowings: S$2,319 million
Cost of Borrowings 1.9%(1) - DEBT MATURITY PROFILE
(S$ MILLIONS, AS AT 31 MARCH 2021)
698
Average Weighted Debt Maturity 3.1 years - 636
50
313
% of Borrowings at Fixed Rates 70.6% ▲13.2 p.p.
314 300
116
(5) 240 586
Interest Coverage Ratio 6.8x(2) ▲0.3x 140 66 115
82 131
62
138 20 51 203 185
Debt Headroom(3) S$1,929 m ▲S$118 m 112 61 19
FY2021 FY2022 FY2023 FY2024 FY2025 > FY2025
Credit Rating (S&P) BBB+ / Stable N.A. S$ Debt A$ Debt € Debt £ Debt
1. Based on trailing 12 months borrowing cost (including FCOT from date of completion of merger). 2. As defined in the Code on Collective Investment Schemes revised by the Monetary Authority of Singapore on 16 April 2020
and clarified on 29 May 2020 and computed as trailing 12 months EBITDA (excluding effects of any fair value changes of derivatives and investment properties, and foreign exchange translation), over trailing 12 months borrowing
costs. Borrowing costs include effects of FRS 116. 3. Prior to reaching the 50.0% aggregate regulatory leverage limit. 9Prudent capital management
Investment Properties(1) and Debt(2) as at 31 March 2021
6,301
Investment Properties Debt
2,984
2,319
1,590 1,270
1,030 700
367 457 222
Total Portfolio Australian Portfolio European Portfolio Singapore Portfolio UK Portfolio
Interest Risk Management as at 31 March 2021
SGD,
16.0%
70.6% Fixed, Variable,
Borrowings at fixed rates 70.6% 29.4%
EUR,
▲ 13.2 p.p from 31 Dec 20 11.9% AUD, 1.5%
1. Excludes recognition of right-of-use assets upon the adoption of FRS 116 Leases with effect from 1 October 2019. 2. Refers to debt in the currency or hedged currency of the country of the investment properties. 10Portfolio Review
Walter-Gropius Straße 19, Bergheim, GermanyPortfolio overview
Selectively diversified portfolio with attractive metrics
Breakdown by Asset Type and Geography(1) 97 Properties in Five Developed Countries(1)
~S$6.3 billion
Logistics & Industrial Commercial Total
Portfolio Value(1)
90 7 97
Properties Properties Properties
Office &
Business Parks, Germany, $3,672.0 m $2,625.5 m $6,297.5 m
20.7% Portfolio value(1)
21.1% Portfolio value(1) Portfolio value(1)
United Kingdom, The Netherlands,
7.2% 4.6%
2,192,481 sqm 339,683 sqm 2,532,164 sqm
Lettable area Lettable area Lettable area
Singapore,
Logistics &
20.1% Industrial,
58.3% 5.3 years 3.9 years 4.7 years
WALE(2) WALE(2) WALE(2)
Australia,
47.4%
CBD
5.2 years 3.4 years 4.4 years
WALB(2) WALB(2) WALB(2)
Commercial,
20.6%
100.0% 92.6% 96.8%
Occupancy rate(2) Occupancy rate(2) Occupancy rate(2)
1. As at 31 March 2021 and based on portfolio value which excludes the recognition of right-of-use assets upon the adoption of FRS 116 Leases with effect from 1 October 2019. 2. Based on GRI, being the contracted rental
income and estimated recoverable outgoings for the month of March 2021. Excludes straight lining rental adjustments and include committed leases. 1262,587 sq m of leasing for the period from January to March 2021 (“2QFY21”)
2QFY21 Industrial Leasing Summary
Lettable Area Average Lease
No. of Leases Annual Increment Reversion(1)
(sqm) Term
62,587 sqm Australia 5 53,683 2.5 years 3.0 – 3.3% -3.6%
leased/renewed in
2QFY21, totaling Europe 0 - - - -
126,133 sqm for 1HFY21
2QFY21 Reversion: -3.6%
TTM(2) Reversion: -4.1%
2QFY21 Commercial Leasing Summary
+0.1%
portfolio rental reversion No. of Leases
Lettable Area
Average Lease Term Reversion(1)
for 2QFY21 (sqm)
Singapore 12 8,559 3.0 years 3.7%
Australia 1 345 5.0 years 9.9%
2QFY21 Reversion: 4.0%
TTM(2) Reversion: 1.8%
1. Calculated based on the signing gross rent (excluding any contracted fixed annual rental step-ups) of the new/renewed lease divided by the preceding terminating gross rent of each new/renewed lease (weighted by
gross rent) of existing space. 2. Refers to reversion on leases contracted for the trailing 12-month period from 1 April 2020 to 31 March 2021. 13Minimal near-term lease expiries
Portfolio Lease Expiry Profile as at 31 March 2021(1)
Well spread-out lease expiry profile with no more than 17.0% of GRI Logistics & Industrial
3.5 % expiring in any single year
% of GRI due for Business Space
6 industrial and 30 commercial leases expiring in FY2021, each
renewal in FY2021
constituting ≤0.4% of GRI
17.0% 16.7%
15.0%
4.3%
11.1% 10.0% 11.4%
11.5%
8.7%
4.7% 4.7%
1.2% 7.1%
5.3% 1.9%
0.3% 10.7%
3.2% 3.5%
7.0% 7.5%
6.4% 6.7%
1.7% 5.2% 5.0% 5.2%
3.2% 1.0% 0.1%
0.0% 1.8%
0.9%
Vacant Sep-21 Sep-22 Sep-23 Sep-24 Sep-25 Sep-26 Sep-27 Sep-28 Sep-29 Sep 2030
and beyond
1.Based on GRI, being the contracted rental income and estimated recoverable outgoings for the month of March 2021. Excludes straight lining rental adjustments and include committed leases. 14Top-10 portfolio tenants
High-quality and well-diversified tenant base
WALE
No. Top-10 Portfolio Tenants(1) Country % of GRI (Years)
24.1 % 4.5 years
% GRI contribution Average WALE for 1. Commonwealth of Australia Australia 5.1% 4.3
from Top-10 tenants Top-10 tenants
2. Google Asia Pacific Singapore 3.9% 3.8
High-quality tenant base with majority of portfolio
tenants comprising Government or related 3. Rio Tinto Shared Services Australia 2.5% 9.3
entities, MNCs, conglomerates and listed
companies 4. Commonwealth Bank of Australia Australia 2.1% 1.8
5. CEVA Logistics (Australia) Australia 2.0% 4.2
Well-diversified tenant base with no single
tenant accounting for more than 5.1% of
6. BMW Germany 1.9% 6.7
portfolio GRI(1)
7. Techtronic Industries Australia Australia 1.8% 2.6
8. Schenker Australia Australia 1.8% 3.6
9. Fluor United Kingdom 1.5% 4.1
10. Mainfreight The Netherlands 1.5% 4.9
Caroline Chisholm Centre, Canberra, Australia
1. Based on GRI, being the contracted rental income and estimated recoverable outgoings for the month of March 2021. Excludes straight lining rental adjustments and include committed leases. 15Well-diversified tenant base with low concentration risk
Portfolio Tenant Sector Breakdown(1)(2)
58.8 % Stable and broad-based tenant mix with diversification across industries
% of GRI contribution Well-positioned to capitalise on sectoral trends with approximately one-third of the logistics
from L&I tenants and industrial portfolio(1) engaged in e-commerce and/or e-fulfilment related activities
23.6%
Logistics & Industrial
Business Space
18.0%
6.9% 7.6%
6.2% 5.5% 4.7% 5.2%
4.1% 3.4% 3.0% 2.8% 2.2% 2.2% 2.1% 1.7% 0.8%
1. Based on GRI, being the contracted rental income and estimated recoverable outgoings for the month of March 2021. Excludes straight lining rental adjustments and include committed leases. 2. Excludes vacancies. 16Update and commentary
The REIT Manager is working closely with FLCT’s customers to overcome this challenging period together while focusing on managing any near- to mid-term
downside risk from the pandemic
The COVID-19 impact on FLCT’s distributable income in 1HFY21 is approximately S$1.2 million, comprising mainly rental waivers and allowance for doubtful
receivables attributable to the Covid-19 pandemic, which has not been material for the REIT
The REIT Manager will continue to monitor the situation closely, support our tenants and exercise prudence
FLCT
Australia Singapore Europe & UK
No material impact to the FLCT portfolio
to-date with only the retail segment of the
Limited impact on the Minimal impact arising from Limited impact on the commercial portfolio, which represents
industrial and commercial the Re-Align Framework(1) German and Dutch industrial just 1.8%(4) of FLCT’s overall income,
properties Expects near- to mid-term portfolio amid ongoing being more challenged
Expects near- to mid-term impact on the retail lockdowns in Europe
impact on the retail components of the Singapore For the UK, the nation’s Structural changes driven by the growth
components of the Australian portfolio ‘Stay at Home’ national of e-commerce activities and ‘hub-and-
portfolio Closely monitoring any lockdown ended on 29 spoke’ trend are expected to drive
impacts arising from the March; progressive easing of demand for logistics and suburban office
additional community lockdown by phases since 12 spaces, respectively
measures implemented for April, including re-opening of
the period from 8 May to 30 non-essential retail(3)
May 2021.(2) FLCT’s resilient portfolio, strong balance
sheet and financial flexibility well-
positions the REIT to face the current
challenging global environment
1. Re-Alignment Framework, Ministry of Law. 2. Updates on local situation, border measures and shift to heightened alert to minimise transmission, Ministry of Health. 3. Guidance, National lockdown: Stay at Home, 4
January 2021. 4. Based on GRI, being the contracted rental income and estimated recoverable outgoings for the month of March 2021. Excludes straight lining rental adjustments and include committed leases. 17Market Information
and Strategy
Maxis Business Park, Bracknell, UKKey economic indicators and market overview
Key Economic Indicators(1) Overview of the Industrial and Commercial Market (3)
Sequential GDP
Industrial Prime Grade Net Face Rent Prime CBD Commercial Net Face Rent
+3.1% for the Dec 20 quarter (A$/sqm/yr) (A$/sqm/yr)
+3.4% for the preceding quarter
Brisbane Melbourne Sydney Perth Melbourne
$150 $145 $700
$140 (+1.2% y-o-y) $625
Unemployment Rate $130
$650
(+0.0% y-o-y)
$624
5.6% for the month of Mar 21 $120 $116 $600
(-0.6% y-o-y)
$110 (+0.3% y-o-y)
Improved from 5.8% in Feb 21 $550
$100
$94 $500
$90
(+0.0% y-o-y)
Consumer Price Index $80 $450
1Q17 1Q18 1Q19 1Q20 1Q21 1Q17 1Q18 1Q19 1Q20 1Q21
1.1% for the 12 months to Mar 21
0.9% for the 12 months to Dec 20
National Total Supply for Industrial National Total Supply for CBD Commercial
(‘000 sqm) (‘000 sqm)
Cash Rate
0.1% 1,950
600
Unchanged since Nov 20 500
1,750
10-year average 10-year average
1,550 400
10-year bond yield 1,350 300
1.62% 1,150 200
As at 29 Apr 21(2) 950 100
750 0
1Q17 1Q18 1Q19 1Q20 1Q21 1Q17 1Q18 1Q19 1Q20 1Q21
1. Sources: Australian Bureau of Statistics and the Reserve Bank of Australia. 2. Capital Market Yields – Government Bonds – Daily (As at 29 April 2021). 3. Jones Lang LaSalle Real Estate Intelligence Service Q1 2021. 19Key economic indicators and market overview
Key Economic Indicators in Germany(1) Key Economic Indicators in the Netherlands(4)
Sequential GDP Unemployment Rate Sequential GDP Unemployment Rate
-1.7% for the Mar 21 quarter 4.6% for the month of Mar 21 -0.1% for the Dec 20 quarter 3.5% for the month of Mar 21
+0.5% for the preceding quarter From 4.6% in Feb 21 From +7.8% in the preceding quarter From 3.6% in Feb 21
Consumer Price Index EURIBOR Consumer Price Index
1.7% for the 12 months to Mar 21 -0.536% 3-month EURIBOR 1.9% for the 12 months to Mar 21
From 1.3% in Feb 21 Remained in the negative range(2) From 1.8% for the 12 months to Feb 21
Overview of the German Industrial Market(3) Overview of the Dutch Industrial Market(3)
• Take-up in Germany increased 19% year-on-year in Q1 2021 as the market continues to recover • Take-up levels increased 8.7% year-on-year in Q1 2021. Activity was boosted by demand from
from the effects of COVID-19. Demand is largely driven by the e-commerce market which saw retail and distribution sectors, which accounted for more than half of total take-up.
several large transactions transacted.
• Prime rents have stabilized, but strong demand and low availability are continually putting an
• Prime rents have remained high in major logistics hubs as a result of limited supply and upward pressure on rents.
transactions signed for speculative developments of logistics parks.
• Investment volumes have dropped in Q1 2021, partly reflecting changes in the tax regime
• Investment volumes recorded €2 billion in Q1 2021 across the major logistics hubs, a decrease (RETT increased from 6% to 8%). However, demand is still strong, reflecting a shift from other
of 12% year-on-year. sectors to the logistics sector.
• Prime yields however have remained at a record low of 3.35% from the last quarter after falling • Prime yields have compressed throughout the market to 3.4% in Q1 and are further expected
from 3.50% in Q3 2020. to decrease by the end of the year.
Take-up and Prime Rents in Germany (for warehouses >5,000 sqm) Take-up and Prime Rents in the Netherlands (for warehouses >5,000 sqm)
‘000 sqm Q1 Q2-Q4 Prime Rents €/sqm/yr ‘000 sqm Q1 Q2-Q4 Prime Rents €/sqm/yr
8,000 4,000
86.4 85.0
80 80
6,000
4,000 2,000
60 60
2,000
1,540 1,765 330 690 550 780 690 750
1,280 1,280 1,200 1,484 0 40
0 40
2016 2017 2018 2019 2020 2016 2017 2018 2019 2020 2021
2021
1. Source: Destatisches Bundesamt (Federal Statistics Office of Germany). 2. Source: https://www.euribor-rates.eu/en/current-euribor-rates/ (As at 29 April 2021). Applicable for both Germany and the Netherlands. 3. Source: BNP
Paribas Real Estate Q1 2021. 4. Source: CBS (Statistics Netherlands). 20Key economic indicators and market overview
Key Economic Indicators(1) Overview of the Singapore Office and Business Park Markets(3)
Sequential GDP Grade A and Grade B Office Rents Business Park Rents(4)
(S$ psf per month) (S$ psf per month)
+2.0% for the Mar 21 quarter
+3.8% in the preceding quarter Grade A Grade B Islandwide
Business Park (City Fringe)
$14.0
11.15 11.50 Business Park (Rest of the Island)
$12.0 10.40
Unemployment Rate 8.95 8.95
$6.5
5.50 5.65 5.80 5.85 5.75
$10.0
2.9% for the month of Mar 21 $8.0
$5.5
3.80 3.75
$4.5 3.70 3.70 3.65
From 3.0% for the month of Feb 21 $6.0 7.90 8.00
6.85 6.85 7.20
$4.0 $3.5
$2.0 $2.5
Consumer Price Index 1Q17 1Q18 1Q19 1Q20 1Q21 1Q17 1Q18 1Q19 1Q20 1Q21
1.3% y-o-y in Mar 21
0.7% y-o-y in Feb 21 Office Supply-Demand Dynamics Business Park Supply-Demand Dynamics
Singapore Overnight Rate(2)
mil sq ft
0.1760%
mil sq ft
As at 29 Apr 21
10-year bond yield
1.62%
As at 29 Apr 21(2)
Net supply Net absorption Vacancy rate (RHA) Net supply Net absorption Vacancy rate (RHA)
1. Sources: Singstat, Ministry of Trade and Industry Singapore, Ministry of Manpower Singapore. 2.Source: MAS SGS. 3. Source: CBRE, Singapore Market View, Q1 2021. 4. Alexandra Technopark is a high-specification B1
industrial development located at the city-fringe, with certain physical attributes similar to business parks. Due to limited availability of market research information directly relating to the asset class of Alexandra Technopark, market
research information for business parks is provided for indicative reference. 21Key economic indicators and market overview
Key Economic Indicators(1) South East Office Trends and Outlook(3)
Sequential GDP
• Take-up levels across the South East totaled 647,890 sqft in Q1 2021, the highest level of take-up
+1.3% for the Dec 20 quarter since the beginning of the pandemic. This is also the strongest Q1 since 2015 and an increase of 8%
+16.9% in the preceding quarter on the 10-year Q1 average. The development pipeline remains severely constrained with just 289,000
sf completing in 2020, 68% below average.
Unemployment Rate • Prime rents have remained largely stable across the South East office market.
4.9% for the three months to Feb 21
5.0% for the three months to Jan 21
South East Investment Volumes South East Office Headline Rents
(£ psf per year)
Consumer Price Index
£ mil
Q1 Q2-Q4 Q1 5-Year Average
1.0% for the 12 months to Mar 21 Bracknell Farnborough
5,000 30.0 29.0
0.7% for the 12 months to Feb 21
27.5 27.5 28.0 28.0
4,000 28.0
26.5 28.0
28.0
Bank Rate 3,000 26.0
26.5
27.0
0.1% 2,000 24.0
Unchanged since March 20 23.5 23.5
1,000 501
22.0
1,070
367 482 597 500 501
0 20.0
2016 2017 2018 2019 2020 2021 Q1 2016 Q1 2017 Q1 2018 Q1 2019 Q1 2020 Q1 2021
1. Source: Office for National Statistics. 2. Source: Bank of England, published April 2021. 3. Source: CBRE Research South East Q1 2021. 22FLCT objectives and strategies
Harnessing competitive advantages to create long-term value and sustainable returns
◆ Our Objectives:
Deliver stable and regular distributions to unitholders
Achieve sustainable long-term growth in DPU
Active Asset Selective Acquisition Capital & Risk
Management Development Growth Management
Proactive leasing to maintain Development of properties Pursue strategic acquisition Optimise capital mix and
high occupancy rate, long complementary to the existing opportunities of quality prudent capital management
WALE and a diversified tenant portfolio properties
base Re-development of existing – Sponsor’s ROFR, with a value
Assess and undertake AEIs(1) assets and by leveraging the in excess of S$5 billion
to unlock further value Sponsor’s development – Third party acquisitions
pipeline
1. Development activities can be up to 10% of the current AUM as per MAS guidelines. FLCT may exceed the regulatory limit of not more than 10% of the company’s deposited property (subject to maximum of 25%) only
if additional allowance of up to 15% of the deposited property is utilised solely for redevelopment of an existing property that has been held for 3 years and continues to be held for 3 years after completion and specific
approval of unitholders for redevelopment is obtained.
23Appendix:
Additional Portfolio Information
Farnborough Business Park, the United KingdomPortfolio overview – logistics & industrial
Prime and modern properties in Australia, Germany and the Netherlands
Australia
As at 31 March 2021 Australia Europe Total
No. of Properties 59(1) 31 90
(12)
Portfolio Value(2) S$2,081.5 m S$1,590.5 m S$3,672.0 m
Lettable Area 1,311,199 sqm 881,282 sqm 2,192,481 sqm
Average Age by Value 8.6 years 8.8 years 8.7 years
WALE(3) 4.4 years 6.8 years 5.3 years (3)
(1)
WALB(3) 4.4 years 6.8 years 5.2 years (30)
(16)
Occupancy Rate(3) 100.0% 100.0% 100.0% Germany &
the Netherlands
Average Annual Rental Increment 3.1% Fixed/CPI-linked(4) N.M.
>10 yrs, > 75 Year
5-10 years, 45.0% Leasehold ,
25.8% Portfolio Age 21.2%
by Lettable Freehold, Land Tenure
Area 65.1% Other
by Value(2)
< 2 years, Leasehold,
2-5 years, 13.7%
27.1% 2.1%
German Properties (26)
1. Excludes the properties at 5 Butler Boulevard, 18-20 Butler Boulevard, and 20-22 Butler Boulevard at Adelaide Airport, South Australia which are classified as “Investment Dutch Properties (5)
Properties Held for Sale”. 2. As at 31 March 2021 and excludes the recognition of right-of-use assets upon the adoption of FRS 116 Leases with effect from 1 October 2019.
3. Based on GRI, being the contracted rental income and estimated recoverable outgoings for the month of March 2021. Excludes straight lining rental adjustments and
include committed leases. 4. 95.5% of the leases have either CPI-linked indexation or fixed escalations. 25Portfolio overview – commercial
Quality & well-located commercial portfolio
Caroline
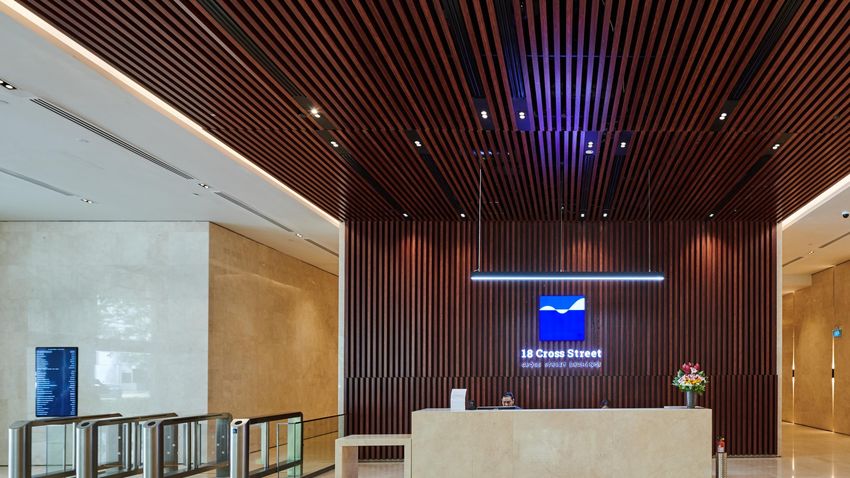
Cross Street 357 Collins Central Alexandra Farnborough Maxis Business
Chisholm
Exchange Street Park Technopark Business Park Park
Centre
As at 31 March 2021 CBD Commercial Office and Business Parks Total
Melbourne,
Country Singapore Perth, Australia Canberra, Australia Singapore United Kingdom United Kingdom -
Australia
Ownership 100.0% 100.0% 50.0% 100.0% 100.0% 100.0% 100.0% -
Property Value
644.2 327.5 324.0(2) 251.0 624.2 328.8 125.8 2,625.5
(S$ m)(1)
Lettable Area (sqm) 36,497 31,962 66,029 40,244 96,086 51,006 17,859 339,683
WALE(3) 2.5 years 2.4 years 6.0 years 4.3 years 2.8 years 5.2 years 5.9 years 3.9 years
WALB(3) 2.5 years 2.4 years 6.0 years 4.3 years 2.6 years 3.9 years 2.6 years 3.4 years
Occupancy Rate(3) 82.6% 95.6% 82.9% 100.0% 98.7% 91.8% 100.0% 92.6%
1. As at 31 March 2021 and excludes the recognition of right-of-use-assets upon the adoption o FRS116 Leases with effect from 1 October 2019. 2. Based on 50% interest in the property. 3. Based on GRI, being the
contracted rental income and estimated recoverable outgoings for the month of March 2021. Excludes straight lining rental adjustments and include committed leases. 26Occupancy rate Breakdown by asset type Logistics & Industrial As at 31 Mar 21 As at 31 Dec 20 Change Australia 100.0% 100.0% - Europe 100.0% 100.0% - Logistics & Industrial Portfolio: 100.0% 100.0% - Commercial Country As at 31 Mar 21 As at 31 Dec 20 Change Cross Street Exchange Singapore 82.6% 89.0% ▼ 6.4% Alexandra Technopark Singapore 98.7% 97.2% ▲ 1.5% Central Park Australia 82.9% 82.9% - Caroline Chisholm Centre Australia 100.0% 100.0% - 357 Collins Street Australia 95.6% 95.5% ▲ 0.1% Farnborough Business Park United Kingdom 91.8% 94.0% ▼ 2.3% Maxis Business Park United Kingdom 100.0% 100.0% - Commercial Portfolio: 92.6% 93.6% 1.Based on GRI and includes committed leases. 27
Top-10 tenants
Breakdown by asset type

                                                              % of FLCT                                                                                                       % of FLCT           WALE
 Top-10 Logistics & Industrial Tenants(1)                    Portfolio GRI WALE (Years)                         Top-10 Commercial Tenants(1)                                 Portfolio GRI       (Years)
 Ceva Logistics, Australia                                         2.0%                   4.2                    Commonwealth of Australia                                          5.1%            4.3

 BMW, Germany                                                      1.9%                   6.7                    Google Asia Pacific, Singapore                                     3.9%            3.8

 Techtronics Industries, Australia                                 1.8%                   2.6                    Rio Tinto, Australia                                               2.5%            9.3

 Schenker, Australia                                               1.8%                   3.6                    Commonwealth Bank of Australia                                     2.1%            1.8

 Mainfreight, the Netherlands                                      1.5%                   4.9                    Fluor Limited, United Kingdom                                      1.5%            4.1

 Hermes, Germany                                                   1.3%                   11.7                   WeWork, Australia and Singapore                                    1.1%            9.2

 Constellium, Germany                                              1.3%                   6.2                    GroupM Singapore Pte Ltd, Singapore                                1.0%            2.3

 Bakker Logistics, the Netherlands                                 1.3%                   9.6                    Service Stream, Australia                                          1.0%            3.7

 Bosch, Germany                                                    1.2%                   7.3                    Syneos Health UK Ltd, UK                                           0.9%            6.8
                                                                                                                 Suntory Beverage & Food Asia Pte Ltd,
 Martin Brower Australia Pty Ltd                                   1.2%                   15.5                                                                                      0.7%            2.2
                                                                                                                 Singapore
                                                                  Total:              Average:                                                                                     Total:        Average:
                                                                  15.3%               7.0 years                                                                                    19.8%         4.7 years

1. Based on GRI, being the contracted rental income and estimated recoverable outgoings for the month of March 2021. Excludes straight lining rental adjustments and include committed leases.               28
Lease expiry profile
Logistics & Industrial
Industrial Portfolio Lease Expiry Profile as at 31 March 2021(1)
(% of total FLCT Portfolio GRI)
10.7%
Australia
Germany and the Netherlands
7.0% 7.5%
6.6%
6.4% 6.7%
1.4% 1.0%
0.7% 2.9%
5.2% 5.0% 5.2%
1.7% 1.7%
2.7%
1.8% 5.7% 5.6% 5.7%
4.6%
4.1%
0.3% 3.5% 3.3%
2.5% 0.9%
1.5% 0.0%
0.0% 0.9%
Vacant Sep-21 Sep-22 Sep-23 Sep-24 Sep-25 Sep-26 Sep-27 Sep-28 Sep-29 Sep 2030
and beyond
1.Based on GRI, being the contracted rental income and estimated recoverable outgoings for the month of March 2021. Excludes straight lining rental adjustments and include committed leases. 29Lease expiry profile
Commercial
Commercial Portfolio Lease Expiry Profile as at 31 March 2021(1)
(% of total FLCT Portfolio GRI)
Australia Singapore UK
11.5%
1.2%
10.0%
2.8%
3.9%
4.7%
4.0% 4.7%
0.4% 4.3%
3.2% 1.4% 0.4%
0.7%
0.5% 6.4%
1.7% 3.7% 1.9%
1.4% 0.1% 2.9% 1.2%
3.2% 0.3% 3.2%
0.0% 1.2%
1.2% 0.8% 0.3% 0.2%
1.3% 0.1% 0.5% 0.1%
0.4% 0.4% 0.6% 0.3% 0.0%
Vacant Sep-21 Sep-22 Sep-23 Sep-24 Sep-25 Sep-26 Sep-27 Sep-28 Sep-29 Sep 2030
and beyond
1.Based on GRI, being the contracted rental income and estimated recoverable outgoings for the month of March 2021. Excludes straight lining rental adjustments and include committed leases. 30Industrial Leadership The industrial portfolio was named Global Sector Leader (Listed Industrial) for the third consecutive
year in the 2020 GRESB Assessment(1)
Strong
Commercial Top-5 in Asia Pacific Diversified – Office/Industrial(1)
Performance
Highest Rated Highest Green Star performance-rated industrial portfolio in Australia(2)
Industrial Portfolio in First to achieve 6 Star Green Star ratings for industrial facilities in each of New South Wales, Victoria
Australia and Queensland
Minimum 4.5-star 357 Collins Street and Caroline Chisholm Centre: minimum 5.0-star
NABERS(4) Energy
ratings Central Park: first commercial building in Australia to achieve 4.5-star NABERS Energy base building
rating, first premium office building in Perth to attain 5.0-star NABERS Energy base building rating
BREEAM ratings(5) Farnborough Business Park and Maxis Business Park: ‘Excellent’/ ‘Very Good’ BREEAM ratings
BCA Green Mark
BCA rating(6)(7) Cross Street Exchange: BCA Green Mark Gold Plus certification
Gold Plus
Please visit the FLCT website for more details on its sustainability strategy and performance
1. Refers to the 2020 Real Estate Assessments by GRESB, the global ESG benchmark for real estate. 2. Portfolio Green Star ratings as at 30 September 2020. Green Star ratings are awarded by the Green Building Council of
Australia (GBCA) which has assessed the Australian properties against nine key performance criteria – energy, water, transport, materials, indoor environment quality management, land use and ecology, emissions and innovation. 3.
Based on lettable area. 4. Refers to the National Australian Built Environment Rating System, Australia’s leading independent, evidence based built environment rating system. 5. Refers to the Building Research Establishment
Environment Assessment Method, the world’s leading sustainability assessment for master planning projects, infrastructure and buildings. 6. Green Mark certification by the Building and Construction Authority, Singapore. 7. Green
Mark re-certification for Alexandra Technopark is currently underway. Alexandra Technopark was certified Green Mark Gold prior to re-certification. 31Appendix:
Additional Market Information
Cross Street Exchange, SingaporeAustralian industrial market
Sydney
◆ Supply: Over the last 12 months, 439,990 sqm of new stock was completed in Sydney which is below the historic ten-year average. There were limited new completions in the first quarter of
2021 (“1Q21”) with only 3 developments reaching completion totalling 31,749 sqm of GLA. The Sydney development pipeline remains strong with approximately 539,000 sqm of new stock either
under construction or with approved plans.
◆ Demand: In 1Q21, Sydney recorded 313,113 sqm of gross take-up which is significantly higher than the historic ten-year average. The strong gross take-up is supported by rising demand
from eCommerce users. This has resulted in the Retail Trade sector accounting for 41% of gross take up during the quarter. The second and third largest user groups were Postal, Transport and
Warehousing users (32%) and Wholesale Trade users (10%).
◆ Rents: Low vacancy rates and a shortage of developable land has translated to an average y-o-y rental growth of approximately 1.2% across all industrial precincts. The Outer Central
West continues to perform strongly with net face rents growing by 3.2% to A$130/sqm. Prime industrial incentives have also increased slightly over the previous 12 months although they remain
relatively low compared to other markets. Average prime incentives in the Outer Central West currently sitting at 16%.
◆ Vacancy: As at March 2021, industrial vacancies in Sydney remain near historic 5-year lows with approximately 575,149 sqm of available space. Sydney industrial vacancy are expected to
increase over the next 12 months as new speculative stock is completed.
Sydney Industrial Total Supply Sydney Industrial Prime Grade Net Face Rents
800 150 $145
$143
700 $139
140 $135
600
$129
(A$/sqm/yr)
(‘000 sqm)
500 130
$122 $124
400 $119 $121
300 120 $115
200
110
100
0 100
1Q12 1Q13 1Q14 1Q15 1Q16 1Q17 1Q18 1Q19 1Q20 1Q21 1Q12 1Q13 1Q14 1Q15 1Q16 1Q17 1Q18 1Q19 1Q20 1Q21
Completed 10-year annual average
Annualised as at 1Q21
Sources: Jones Lang LaSalle Real Estate Intelligence Service – Sydney Industrial Final Data 1Q21; Jones Lang LaSalle Real Estate Intelligence Service – Sydney Industrial Snapshot 1Q21; Jones Lang LaSalle Real Estate Data
Solution – Sydney Construction Projects from Q2 2011 to 1Q 2021; Knight Frank Research – National Industrial March 2021. 33Australian industrial market
Melbourne
◆ Supply: A total of four projects with a total GLA of 125,660 sqm reached practical completion in Melbourne over 1Q21. Over the last 12 months, 767,325 sqm of new stock was completed in
Melbourne which is significantly above the historic ten-year average. In 1Q21, the bulk of new industrial supply were concentrated in the Northern (53%) and Western Precincts (47%), reflective of
their less restrictive land supply environments.
◆ Demand: With lockdown restrictions easing in Victoria, leasing activity has significantly increased over the previous two quarters. Gross take-up for 1Q21 totalled 546,939 sqm which is the
highest recorded gross-take up for the Melbourne market on record. The West industrial precincts recorded over 307,000 sqm of gross take representing 56% of all take up during the quarter.
◆ Rents: Due to high levels of new supply in Melbourne, industrial face rents have generally remained flat, however there has been a slight face rental growth in the South East and North
industrial precincts. The South East continues to be one of the strongest performing precinct with face rents increasing slightly to A$95/sqm net. Incentives in South East have also remained stable
at around 23%.
◆ Vacancy: During the March quarter, vacancies in Melbourne declined 20% as a result of strong tenant demand. As at March 2021, there was approximately 886,314 sqm of available industrial
space in the Melbourne market. However, vacancy rates in Melbourne are expected to increase over the next 12 months as new speculative stock is completed.
Melbourne Industrial Total Supply Melbourne Industrial Prime Grade Net Face Rents
900 100
800
700 $93 $94 $94
95
600 $92
(A$/sqm/yr)
(‘000 sqm)
$90
500 $88 $89 $89
90 $87
400
300
85 $84
200
100
0 80
1Q12 1Q13 1Q14 1Q15 1Q16 1Q17 1Q18 1Q19 1Q20 1Q21 1Q12 1Q13 1Q14 1Q15 1Q16 1Q17 1Q18 1Q19 1Q20 1Q21
Completed 10-year annual average
Annualised as at 1Q21
Sources: Jones Lang LaSalle Real Estate Intelligence Service – Melbourne Industrial Final Data 1Q21; Jones Lang LaSalle Real Estate Intelligence Service – Melbourne Industrial Snapshot 1Q21; Jones Lang LaSalle Real
Estate Data Solution – Melbourne Construction Projects from Q2 2011 to 1Q 2021; ; Knight Frank Research – National Industrial March 2021. 34Australian industrial market
Brisbane
◆ Supply: During the March quarter, two developments were completed in Brisbane adding 12,800 of GLA to the market. Over the last 12 months, development activity in Brisbane has exceeded the
10-year average, with 378,605 sqm of new stock being added to the market. The largest completion during the quarter was a 7,000 sqm warehouse at 498 Progress Road, Wacol developed by
Garda Capital Group. The supply pipeline remains relatively strong with 11 projects under construction, totalling 205,450 sqm which are expected to complete in 2021 and 2022.
◆ Demand: Tenant demand for industrial space in Brisbane has remained in line with the historic 10-year quarterly average. During the March quarter Brisbane recorded a gross take-up of
117,994 sqm. 75% the new leases were concentrated in the South with the remaining 25% in the Trade Coast. The largest transaction of the quarter was a 19,650 sqm lease to Eureka Street
Furniture at 33 Iris Place, Acacia Ridge.
◆ Rents: Rental rates remained relatively stable across Brisbane over 1Q21. The only market to record rental growth over the previous 12 months was the Southern industrial precinct. Face rents
increase 0.9% to A$111/sqm net. Incentives in Brisbane South have remained stable at 20% for prime industrial assets however incentives are expected to increase as new speculative developments
reach completion.
◆ Vacancy: Vacancy levels in Brisbane have increased in 1Q21 as a result of speculative developments reaching completion. As at March 2021, the level of available industrial space is approximately
612,732 sqm. However, vacancy rates in Brisbane are expected to increase over the next 12 months as new speculative stock is completed.
Brisbane Industrial Total Supply Brisbane Industrial Prime Grade Net Face Rents
450 130
400
350 $120
$120 $119 $118
$117
(A$/sqm/yr)
300 120
(‘000 sqm)
$115 $115 $116
250
$112
200 $110
150 110
100
50
0 100
1Q12 1Q13 1Q14 1Q15 1Q16 1Q17 1Q18 1Q19 1Q20 1Q21 1Q12 1Q13 1Q14 1Q15 1Q16 1Q17 1Q18 1Q19 1Q20 1Q21
Completed 10-year annual average
Annualised as at 1Q21
Sources: Jones Lang LaSalle Real Estate Intelligence Service – Brisbane Industrial Final Data 1Q21; Jones Lang LaSalle Real Estate Intelligence Service – Brisbane Industrial Snapshot 1Q21; Jones Lang LaSalle Real Estate Data
Solution – Brisbane Construction Projects from Q2 2011 to 1Q21; Knight Frank Research – National Industrial March 2021.
35Australian commercial market
Melbourne CBD office
◆ Supply: There were no new major commercial developments completed in the Melbourne CBD in 1Q21. During 2020, a total of seven new projects were completed in the Melbourne CBD
contributing approximate 329,000 sqm of net lettable area (“NLA”) making 2020 the highest year for completions since 1991. There are currently five new developments and two building refurbishments
under construction in the Melbourne CBD. The developments will provide 260,270 sqm of NLA to the market and are due to be completed by 2023.
◆ Demand: Tenant demand in Melbourne CBD has continued to remain weak however enquiry has begun to pick up as COVID restrictions continue to ease in Victoria. During 1Q21, the
Melbourne CBD experienced negative net absorption of 56,195 sqm as tenants continued to offer sublease space to the market. Occupier demand is expected to remain subdued over the short term, as
tenants continue to assess future office space requirements. JLL expects the Melbourne market to recover throughout 2021 with leasing activity increasing throughout the year.
◆ Rents: Tenant demand in the Melbourne CBD has remained subdued over Q1 2021 and has resulted in an increase in vacancies and incentives. Over the last 12 months average net prime rents in
Melbourne CBD have increased by 1.2% to A$624/sqm. Although we note that face rents have not recovered to their pre-COVID levels. Prime incentives in the Melbourne CBD have also increased
slightly over the quarter and are currently at 34%. Despite the positive rental growth, the increase of incentives has resulted in negative effective rental growth over the quarter.
◆ Vacancy: As at 1Q21, the vacancy rate in Melbourne’s CBD rose to 14.3%, being the highest level since 1999. This increase is due to a combination of weak tenant demand, increased sublease space
as well as several large tenant contractions. As at 31 March 2021, there is approximately 727,725 sqm of vacant commercial space in the Melbourne CBD. According to JLL, vacancies are expected to
peak in 2021 as new supply reaches completion and additional sublease space is offered to the market.
Melbourne Commercial Total Supply Melbourne Prime Grade Net Face Rent
350 700
$628 $624
300 650
$580
600 $562
250
(A$/sqm/yr)
$515
(‘000 sqm)
550
200
500 $450 $466
150
450 $417 $432
100 $400
400
50
350
0 300
1Q12 1Q13 1Q14 1Q15 1Q16 1Q17 1Q18 1Q19 1Q20 1Q21 1Q12 1Q13 1Q14 1Q15 1Q16 1Q17 1Q18 1Q19 1Q20 1Q21
Completed 10-year annual average
Annualised as at 1Q21
Sources: Jones Lang LaSalle Real Estate Intelligence Service – Melbourne CBD Office Final Data 1Q21; Jones Lang LaSalle Real Estate Intelligence Service – Melbourne CBD Office Snapshot 1Q21; Jones Lang LaSalle Real
Estate Data Solution – Melbourne CBD Office Construction Projects from 2Q 2011 to 1Q 2021. 36Australian commercial market
Perth CBD office
◆ Supply: Development activity in the Perth CBD has been subdued with no new developments being completed in the last 12 months. There are currently two major new developments under
construction in the Perth CBD, Chevron HQ and Capital Square Tower 2. The two developments are expected to be completed in 4Q 2023 and 4Q 2021 respectively and will provide approximately
79,200 sqm of commercial space to the Perth Market. Due the persistently high vacancy rates in Perth there is unlikely to be any additional developments added to the supply pipeline.
◆ Demand: Tenant demand has remained subdued with Perth CBD experienced negative net absorption of 2,600 sqm. Tenant enquiry has begun to pick up particularly for fitted out B-grade office
accommodation. The new enquiry is primarily driven by the mining and professional service sectors. The WA State Government remains an active player in the market as it continues to review its
office space requirements.
◆ Rents: Despite softening demand, prime rents in the Perth CBD remained stable over the previous 12 months. The average net prime rents in the Perth CBD are currently A$625/sqm. Over the
quarter incentives for prime office space have also remained stable at 49%. The high-level of incentives is due to continued high vacancy rates and modest tenant demand in the Perth CBD office
market.
◆ Vacancy: During 1Q 2021 the vacancy rate in Perth CBD increased slightly to 20.16%. Currently, there is approximately 364,401 sqm of vacant commercial space in the Perth CBD market. Vacancy
rates are expected to decrease as demand from the mining and professional service sector are expected to increase over the next 12 months.
Perth CBD Office Total Supply Perth CBD Office Prime Grade Net Face Rent
160 800
140 $747
750
$722
120 $701
(A$/sqm/yr)
(‘000 sqm)
100 700
$660
80
$635
60 650 $621 $617 $621 $625 $625
40
600
20
0 550
1Q12 1Q13 1Q14 1Q15 1Q16 1Q17 1Q18 1Q19 1Q20 1Q21 1Q12 1Q13 1Q14 1Q15 1Q16 1Q17 1Q18 1Q19 1Q20 1Q21
Completed 10-year annual average
Annualised as at 1Q21
Sources: Jones Lang LaSalle Real Estate Intelligence Service – Perth CBD Office Final Data 1Q21; Jones Lang LaSalle Real Estate Intelligence Service – Perth CBD Office Snapshot 1Q21;
Jones Lang LaSalle Real Estate Data Solution – Perth CBD Office Construction Projects from Q2 2011 to 1Q21. 37Singapore commercial market
CBD office
◆ Supply: There has been some new office completions in Q1 21, bringing total new completions in the 12-month period to 31 March 21 at c.636k mil sq ft. The bulk of the office supply will be
injected into the market from 2021 to 2023, with bigger projects that include Capitaspring, Guoco Midtown and Central Boulevard Towers slated for completion by 2023.
◆ Demand: There has been an uptick in leasing momentum, total net absorption in 1Q21 was positive at 134,348 sq ft. In particular, Grade A (Core CBD) market registered a positive net absorption,
as occupier capitalised on declining rents and moved to prime office buildings. Demand mainly driven by firms from the technology and financial services industries.
◆ Rents: In Q1 21, Grade A rental rates remained stable q-o-q at $10.40 psf/month. While Grade B market rents continue to grapple, seeing a further rental decline of 1.3% q-o-q to $7.80 psf/month.
◆ Vacancy: Coupled with lower occupancy of the new-builds upon completion, as well as the impact of slower demand with firms re-evaluating their real estate footprint and downsizing, vacancy rose
from 5.0% in Q1 20 to 5.9% in Q1 21.
Singapore Grade A and Grade B office rents
$14
11.4 11.15
$12 11.5
10.3 10.6
(S$ psf per month)
10.25 10.40
9.55 9.9 9.7 1Q 21 Q-o-q
$10 8.95 Singapore office rents
(psf/ month) (%)
$8
Grade A CBD Core S$10.40 -
8.05 7.9 8
$6 7.12 7.25 7.1 7.55 7.5 7.1 7.20
6.85 Grade B CBD Core S$7.80 ▼ 1.3
$4
Grade B Islandwide S$7.20 ▼ 2.0
$2
1Q11 1Q12 1Q13 1Q14 1Q15 1Q16 1Q17 1Q18 1Q19 1Q20 1Q21
Grade A Grade B Islandwide
Source: CBRE, Singapore Market View, Q1 2021.
38Singapore commercial market
Business park(1)
◆ Supply: The completion of on-going projects are expected to be delayed by at least three months due to disruptions in the construction industry. From 2021 to 2023, an estimated 4.14 million sq ft of
new supply will come on stream.
◆ Demand: Leasing activity was subdued in Q1 2021, with renewals and relocations continuing to feature. Total island wide net absorption registered at negative 35,817 sq ft in Q1 2021.
◆ Rents: With landlords becoming more flexible in rental negotiations as they seek to maintain occupancy levels, both City Fringe and Rest of Island markets registered a drop in rents. The former saw a
decrease of 0.9% q-o-q to $5.75 psf/ month whereas the latter saw a less steep drop of 1.4% q-o-q to $3.65 psf/month. The upcoming supply e.g. Clean TechPark slated for completion in 2021 is
likely to put pressure on rents.
◆ Vacancy: Island wide vacancy rate eased slightly from 13.0% in 3Q20 to 12.8% in 4Q20 with no new supply over the past three months. Occupancy rate is unlikely to dip significantly as there is
limited large contiguous space in city fringe business parks
Singapore Business Park rents
$6.5 Singapore business park 1Q 21 Q-o-q
5.8 5.85 5.75
$6.0 5.5 5.5 5.65 rents (psf/ month) (%)
5.3 5.4
(S$ psf per month)
$5.5 5.25 5.4
5.05
$5.0 City fringe S$5.75 ▼ 0.9
$4.5
3.8 3.85 3.8 3.75
Rest of Island S$3.65 ▼ 1.4
3.7 3.7 3.65 3.65 3.7 3.7 3.65
$4.0
$3.5
$3.0
$2.5
1Q11 1Q12 1Q13 1Q14 1Q15 1Q16 1Q17 1Q18 1Q19 1Q20 1Q21
Business Park (City Fringe) Business Park (Rest of the Island)
Source: CBRE, Singapore Market View, Q1 2021.
1. Alexandra Technopark is a high-specification B1 industrial development located at the city-fringe, with certain physical attributes similar to business parks. Due to limited availability of market research information directly relating
to the asset class of Alexandra Technopark, market research information for business parks is provided for indicative reference. 39You can also read