CBD OFFICE Second Half 2020 - Research & Forecast Report - Colliers
←
→
Page content transcription
If your browser does not render page correctly, please read the page content below
Research &
Forecast Report

                   Accelerating success.

CBD OFFICE
Second Half 2020
Accelerating success.

                                             MAXIMISE THE
                                             POTENTIAL OF
                                             DATA

  IN-DEPTH DATA                                   At the forefront of the
                                                  real estate industry, we
Granular datasets covering historical
                                                  understand the demand
 and forecast data with over 2,000
   datapoints updated quarterly.                  for reliable and accurate
                                                  data is more prevalent
                                                  than ever.
                                                  Our enterprising
                                                  technology, Colliers Edge,
                                                  offers comprehensive
    DETAILED                                      property data that enables
  TRANSACTIONS                                    you to delve deeper into
                                                  the Australian property
       Individual reporting of
                                                  market, using data to
         major transactions.
                                                  become more informed
                                                  and deliver enduring value.
                                                  Colliers Edge is a data
                                                  subscription service
                                                  developed by our in-
        INSIGHTS                                  house research experts,
  Our experienced research team                   who collaborate with
 will help you understand quarterly               our National network
changes, as well as broader themes                of operators to drive
  behind each sector and market.                  exceptional results.

             Joanne Henderson
             Director | Research
             +61 410 391 093
             joanne.henderson@colliers.com
             colliers.com.au/colliersedge
CONTENTS

     CBD Office Snapshot                               4

     National Overview                                 5

     CBD Office Snapshot by Market                     6

     Capital Markets Outlook                          12

     Occupancy Trends                                 14

     Our Expertise                                    16

                                     Accelerating success.
CBD OFFICE | Research & Forecast Report | H2 2020

CBD OFFICE
SNAPSHOT
                                                         NET SUPPLY                NET FACE RENTS                                         NET EFFECTIVE
                          VACANCY RATE                                                                            INCENTIVES                                                  YIELD
                                                           (SQM)                     ($/SQM P.A.)                                       RENTS ($/SQM P.A.)

                                                  Year to Jul- Year to Jul-
                         Current     Jul-21 (f)                             Current Jun-21 (f) Current Jun-21 (f) Current Jun-21 (f) Current Jun-21 (f)
                                                     2020        2021 (f)

    SYDNEY               5.60%         9.40%

    Premium              3.80%         8.50%                                        $1,173        $1,166        27%           32%          $807          $734         4.5%          4.7%
                                                      -6,376        125,495
    A Grade              4.70%         7.70%                                         $947         $937          26%           31%          $651          $594         4.9%            5.1%

    B Grade              7.50%        12.70%                                         $788         $754          25%           30%          $547          $476         5.2%          6.0%

    MELBOURNE            5.80%         9.70%

    Premium              6.00%         9.20%                                         $794         $794          25%           35%          $593          $530         4.5%          4.7%
                                                     159,044         176,753
    A Grade              5.60%        10.40%                                         $641         $641          28%           35%          $459          $415         4.9%            5.1%

    B Grade              6.60%         8.70%                                         $514         $514          27%           35%          $377          $339         5.0%          5.8%

    BRISBANE             12.90%        13.70%

    Premium               5.10%        7.00%                                         $705         $698          37%           37%          $384          $378          5.1%         5.3%
                                                     48,680           -932
    A Grade              13.10%       13.40%                                         $600         $594          38%           39%          $319          $301         5.4%          5.6%

    B Grade              15.30%       16.70%                                         $482         $477          41%           42%          $229          $213         6.3%            7.1%

    PERTH                 18.4%        20.7%

    Premium              6.80%         8.10%                                         $710         $707          41%           46%          $417          $380         5.9%          5.9%
                                                     26,043          -11,862
    A Grade              15.80%        17.10%                                        $578         $549          49%           53%          $293          $258         6.6%          6.5%

    B Grade              28.70%       28.90%                                         $380         $334          50%           53%          $190          $159         7.0%            7.1%

    ADELAIDE             14.20%        13.10%

    Premium                n/a           n/a                                         $398         $393          35%           43%          $213          $163         6.4%          6.5%
                                                     37,788          27,063
    A Grade              10.80%        9.00%                                         $404         $400          34%           40%          $231          $194         6.5%          6.7%

    B Grade              16.60%       15.40%                                         $338         $335          37%           40%          $177          $158          7.1%           7.7%

    CANBERRA             12.30%        11.10%

    A Grade              6.80%         5.70%          17,918         51,650          $405         $404          23%           24%          $290          $279         5.6%          5.6%

    B Grade              20.10%        19.70%                                        $290         $286          28%           29%          $180          $172         7.3%            7.7%

Note: ‘Current’ refers to June 2020 figures.
       Melbourne incentives are based on more recent (August 2020) evidence, as the June quarter yielded little evidence for incentive movement.
In light of the current uncertainty around the economic outlook, both domestically and globally, Colliers Research are currently forecasting office markets using three sets of scenarios. The
scenarios provided in this report are our 'base case' scenario, with Colliers also providing our subscriber clients with 'worst case' and 'best case' scenarios.

4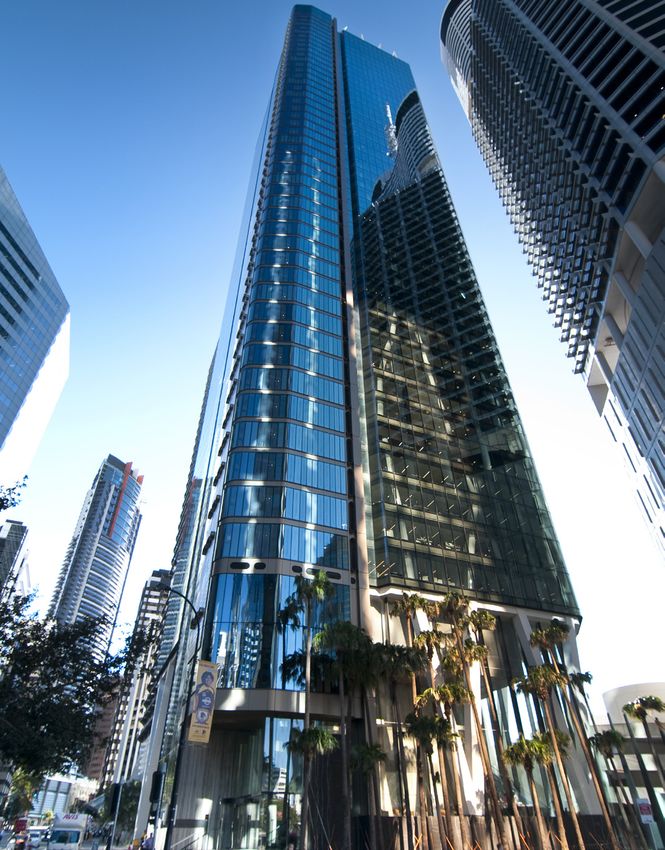
CBD OFFICE | Research & Forecast Report | H2 2020

NATIONAL                                                               numbers from 2022 onwards. Conversely, new supply should
                                                                       become very constrained as very few projects get green-lit over the

OVERVIEW
                                                                       2020/21 period.

                                                                       For this reason, our medium to long term view of Australian office
                                                                       markets is relatively positive. There are a couple of other factors to
By Anneke Thompson                                                     keep in mind:
National Director | Research                                           •       Relativity. Whilst Australia is facing a huge set of challenges
anneke.thompson@colliers.com
                                                                               right now, we are not alone in these challenges and are
                                                                               commonly accepted as being one of the better performing
The Dual Shock System - short                                                  nations in this crisis. Given this, we expect that once the world
term demand, long term supply                                                  normalises, that Australia will be viewed as an excellent place
                                                                               to migrate to, to holiday in, and also to invest in. This will help
The strength of white collar employment growth in Australia,
                                                                               improve high population growth that office markets have long
particularly in the major cities of Sydney and Melbourne, has
                                                                               benefitted from.
created good office demand conditions across the country,
                                                                       •       Pre-COVID market vacancy. The two largest office markets in
particularly between 2016 and 2019. Over this time, white collar
                                                                               Australia, Sydney and Melbourne CBDs, have come in to this
employment across Australian CBDs has grown by 82,000
                                                                               shock with near record low vacancy rates. Whilst we know
employees, representing circa 900,000sqm of office demand. Net
                                                                               that vacancy will rise in the short term due to both sub-lease
absorption, however, looks quite different. Over the same period
                                                                               space coming on market, as well as subdued demand, this low
of time, 645,000sqm of space has been absorbed. What this tells
                                                                               base of vacancy will serve to soften the vacancy peak.
us is that occupiers have already been taking less space per new
                                                                       •       Infrastructure projects. Sydney, Melbourne and Brisbane all
employee for some time, and the flexible working trend that is now
                                                                               have major infrastructure projects under construction. These
front and centre was already well advanced. These good demand
                                                                               projects are due to complete in 2024 (Sydney Metro), 2025
conditions have also been the backbone of kicking off a supply cycle
                                                                               (Melbourne Metro) and 2024 (Brisbane Cross River Rail).
in both Sydney and Melbourne, and both cities have a number of
                                                                               While all some years away, we expect that Australia’s economy
projects completing this year and in to 2021.
                                                                               will be well and truly on a growth path again as these projects
Clearly, COVID-19 has been a major shock, and is impacting white               complete.
collar employment more than any other sector of the employment
                                                                       To put in to numbers how much of an impact this event is having
market. This is both due to the lockdown impact on corporates
                                                                       on our supply outlook, consider our pre and post COVID gross
and the uncertainty this brings, but also due to border closures
                                                                       supply forecasts:
effectively stopping any new migrants or overseas students from
entering the country. Border closures will impact demand in both       Gross Supply Forecasts 2022 to 2023
the short and medium term, as new migrants have been a major
                                                                           Forecast as at:            Q4 2019                    Q3 2020
driver of demand for office space from the business services,                                                               (Base Case Outlook)
education, finance and IT sectors.
                                                                              Sydney CBD              207,906                     199,906
As a forecaster, it has never been more challenging to understand
what employment and therefore demand conditions will be this year           Melbourne CBD             318,750                     202,750
or next. Too many factors are changing on a day-to-day basis for
us to forecast this with any certainty. What we do know, however,
                                                                       Bear in mind, that the above supply forecasts for Sydney are
is that any short term shock to demand is always met by a long
                                                                       impacted by Quay Quarter Tower and Circular Quay Tower, both of
term impact to supply cycles. Indeed, this is the key reason why
                                                                       which are under construction and therefore have set timelines.
Australia’s office property market continually works in cycles. This
system has been even more pronounced in the last 10 years or so,       The biggest impact we see is in Melbourne, where there are a
as the development market in Australia has become very financially     number of projects currently seeking pre-commitment. The current
disciplined, particularly since the GFC. What this means is that the   market conditions are expected to push out the timing of the next
vast majority of office projects get built only once the demand side   supply pipeline in that city. We also expect that any supply that does
(or the ‘pre-commitment’) has been met. Post-COVID, we expect          complete over the above timeframe, will be met with very high pre-
that this discipline will get even tighter, and a number of projects   commitment levels in order to get financing or board approval.
will need higher pre-commitment to obtain funding to commence          As a result, we are forecasting vacancy to be trending down in
construction.                                                          most CBD markets by 2022.
This is why, even in such uncertain times, we can say with some
confidence that office markets will be close to rebalanced by
2023/24. We expect that current and future vacancy created by
this demand shock to be mopped up by improving employment

5
CBD OFFICE | Research & Forecast Report | H2 2020

SYDNEY CBD
SNAPSHOT
Market Indicators - Jun 2020
                                                             Incentives have moved materially in Q2 2020, while net face rents
                                                             have held steady. While we expect incentives to continue to increase
                                                             over the latter half of 2020 and in to 2021, however, our view is that
                                 TOTAL MARKET                a market average of 33% is probably the limit that Sydney landlords
                                 VACANCY RATE                will be willing to move to, before face rents start to be impacted.
                  Sydney
                                 Jul-2020       YoY Change
                                                             Vacancy has risen from 3.9% in Jan 2020 to 5.6% in July 2020. We
                                      5.6%
                                                             are forecasting a steep rise in vacancy over the latter half of 2020,
                                 Jul-2021 (f)                primarily due to sub-lease options coming on to the market. Beyond
                                      9.4%                   that we expect vacancy to begin to decline in early 2022, as tenants
                                                             have more certainty of their space requirements and are more willing
                                                             to commit to leases.

        AVERAGE NET FACE RENTS (A$/m2 p.a.)                  Longer term, supply is going to have a major impact on the Sydney
        Prime                Secondary                       CBD, which will differentiate the 10 year outlook to 2030 from the
        L               H            L               H       previous 10 years, when supply in the Sydney CBD was reasonably
       $944           $1,195        $731           $846      limited. However, we expect that vacancy will revert to around long
                                                             term averages by 2023/24. This will be as a result of a large number
                                                             of leases due to expire in this time, as many tenants are currently
        AVERAGE GROSS INCENTIVES
                                                             holding over leases on a short term basis to deal with occupancy
        Prime                 Secondary
                                                             uncertainty.
        L               H            L               H
                27%                         25%
                                                             The Flexspace market is likely to play an even bigger role in the
                                                             Sydney CBD, and indeed the city more widely, as tenants rely on this
        AVERAGE YIELDS                                       sector for expansion and overflow capacity. This sector, therefore is
        Prime                       Secondary                likely to re-emerge as a strong source of tenant demand.
        L               H            L               H
      4.63%           4.78%        5.16%           5.25%

        AVERAGE CAPITAL VALUE (A$/m2)
        Prime                 Secondary
        L               H            L               H
      $19,224         $25,874     $14,007         $16,633

    YEAR TO JUL-2020            YEAR TO JUL-2021 (F)

      NET SUPPLY
                                     125,495m2

       -6,376m2

      NET ABSORPTION

       -98,290m2                     -75,909m2

                                                             52 Martin Place, Sydney
                                                             Managed on behalf of REST.

6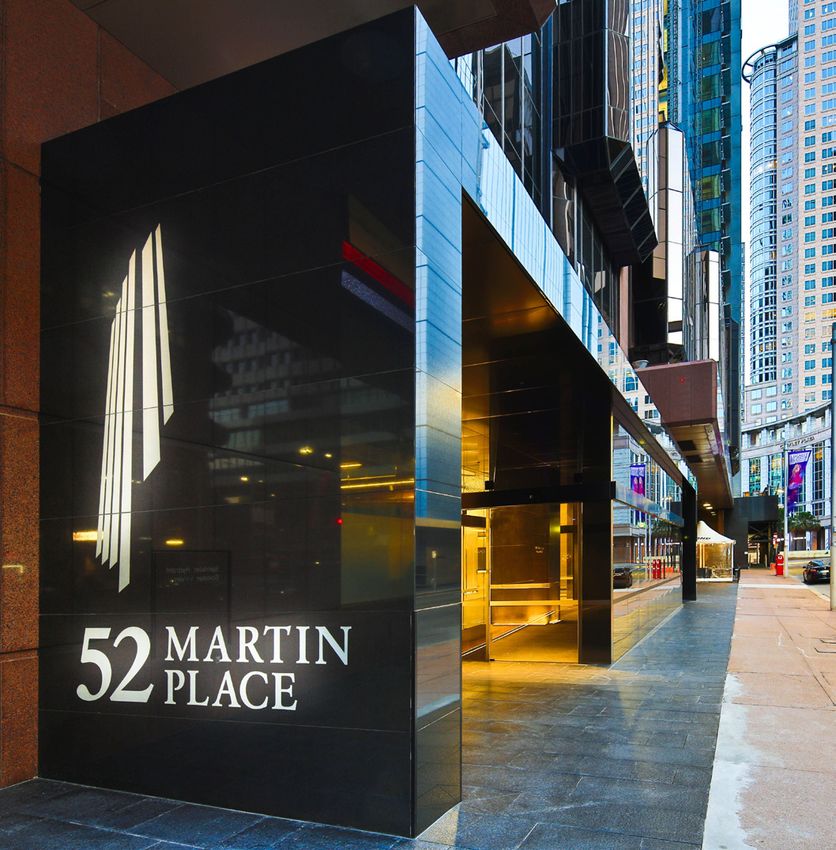
CBD OFFICE | Research & Forecast Report | H2 2020

 MELBOURNE CBD
 SNAPSHOT
 Market Indicators - Jun 2020
                                                                                       Melbourne CBD prime grade net face rents experienced an annual
                                                                                       rental growth of 6.3% over the year to June 2020. There was no
                                                                                       change in prime grade net face rents from Q1 to Q2 and we expect
                                                     TOTAL MARKET                      that to continue in the short term, offset by an increase in incentives.
                                                     VACANCY RATE
Melbourne                                           Jul-2020         YoY Change
                                                                                       An increase in sub-lease is starting to affect the market, with an
                                                            5.8%                       estimated 69,249sqm of space available as at June 2020 within
                                                    Jul-2021 (f)                       Melbourne’s CBD. We expect the volume of sub-lease space to swell
                                                            9.7%                       throughout the second half of 2020.

                                                                                       Deal activity across the Melbourne CBD has been limited since mid-
                                                                                       March, when the impact of the pandemic was first felt in Australia.
               AVERAGE NET FACE RENTS (A$/m2 p.a.)
                                                                                       Deals that have emerged were negotiated pre-COVID-19, with
               Prime                Secondary
                                                                                       incentives and rent reviews experiencing the most movement.
                 L                  H                      L                  H
              $621               $815                   $468               $560
                                                                                       The outlook for new supply over the medium-to-long term is difficult
                                                                                       to predict, with developers facing a number of new challenges before
               AVERAGE NET INCENTIVES                                                  commencing construction, including the change in risk profile, higher
               Prime                 Secondary                                         pre-commitment hurdles, an uncertain rental outlook and access to
                 L                  H                      L                  H        finance. For this reason, we expect to see several projects that are
                        33%                                       35%                  either approved or mooted, to be pushed back or not go ahead at all.

               AVERAGE YIELDS
               Prime                                     Secondary
                 L                  H                      L                  H
              4.67%             4.74%                   5.92%             5.05%

               AVERAGE CAPITAL VALUE (A$/m2)
               Prime                 Secondary
                 L                  H                      L                  H
            $13,156            $17,550                 $9,267            $11,382

         YEAR TO JUL-2020                         YEAR TO JUL-2021 (F)

             NET SUPPLY

              159,044m2                                   176,753m2

             NET ABSORPTION
               35,726m2
                                                           -22,302m2

                                                                                       200 Victoria Street, Melbourne
 Note: Melbourne incentives are as per August 2020, based on more up to date leasing   Sold for $72,000,000 on behalf of Australian Unity.
 data.

 7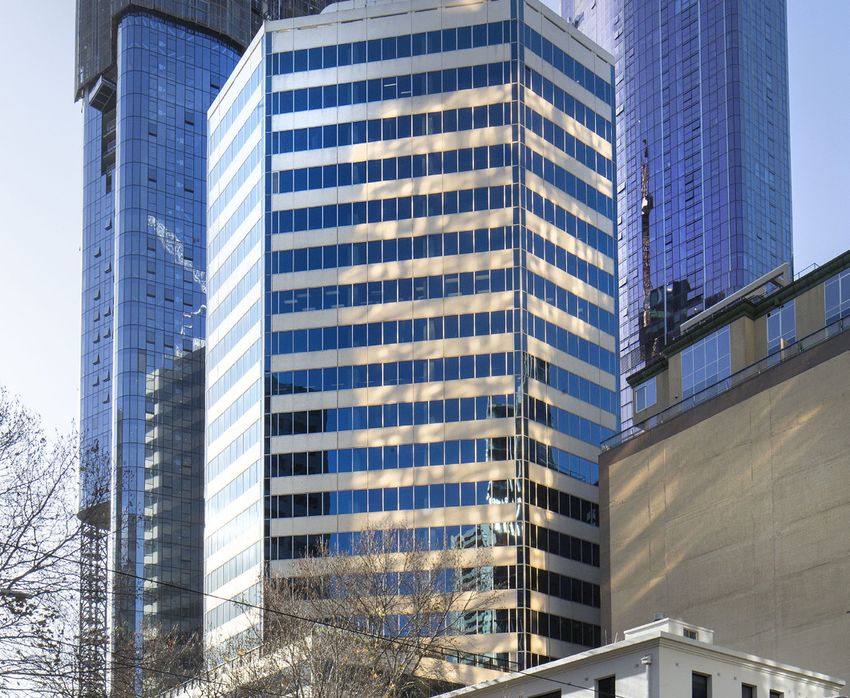
CBD OFFICE | Research & Forecast Report | H2 2020

BRISBANE CBD
SNAPSHOT
Market Indicators - Jun 2020
                                                             The long-term market fundamentals remain sound and supported
                                                             by a well-diversified pool of tenants, large government occupancy
                                                             (estimated at least at 30% of occupied stock) affordable net face
                                                             rents compared to the largest capital cities and restricted new supply
                                 TOTAL MARKET
                                 VACANCY RATE                under construction.

                                 Jul-2020       YoY Change   Whilst occupiers are expected to remain generally inactive over
                                      12.9%                  the next 6 months, vacancy is forecast to rise above the long-term
                                 Jul-2021 (f)                average of 12.9%. However, Premium grade vacancy is forecast to
                Brisbane              13.7%
                                                             remain at single-digit levels until at least early 2022.

                                                             New supply under construction is limited to two projects adding less
                                                             than 5% of the current office stock (103,000sqm). We are forecasting
        AVERAGE NET FACE RENTS (A$/m2 p.a.)                  a development gap beyond 2022 and we envisage that new
        Prime                Secondary                       development activity will be conditional upon achieving high levels of
        L               H            L               H       pre-commitment.
       $622            $684         $466           $499
                                                             Net effective rents are forecast to follow a downward trend for the
        AVERAGE GROSS INCENTIVES                             next three years and return to current levels between mid-2023 and
        Prime                 Secondary                      early-2024.
        L               H            L               H
                37%                         41%

        AVERAGE YIELDS
        Prime                       Secondary
        L               H            L               H
      5.11%           5.42%        6.06%           6.53%

        AVERAGE CAPITAL VALUE (A$/m2)
        Prime                 Secondary
        L               H            L               H
      $11,519         $13,406      $7,131          $8,236

    YEAR TO JUL-2020            YEAR TO JUL-2021 (F)

      NET SUPPLY
       48,680m2
                                      -932m2

      NET ABSORPTION

       27,305m2
                                     -17,839m2
                                                             ONE ONE ONE Eagle Street, Brisbane
                                                             Valued on behalf of The GPT Group.

8
CBD OFFICE | Research & Forecast Report | H2 2020

CANBERRA CBD
SNAPSHOT
Market Indicators - Jun 2020
                                                          Over H1 2020, Canberra has been the only Australian CBD to
                                                          demonstrate a decrease in vacancy, with the Civic vacancy recorded
                                                          at 6.8%. This has been attributable to the strong government
                                                          presence within the CBD, and their increase in take-up to support
                              TOTAL MARKET
            Canberra          VACANCY RATE                the additional load and strain that COVID-19 has imposed on the
                                                          economy.
                              Jul-2020       YoY Change
                                   6.8%                   Canberra is typically a ‘move within’ market, therefore, from an
                                                          occupancy outlook, we forecast little to no change in occupied stock
                              Jul-2021 (f)
                                                          and net absorption levels are forecast to remain subdued.
                                   5.7%

                                                          Net face rents have held steady over the first half of 2020, although
                                                          incentives have increased across the market. The increase in
       AVERAGE NET FACE RENTS (A$/m2 p.a.)
                                                          incentives has caused net effective rents in A and B grade assets to
       Prime                Secondary
                                                          decrease 7.1% and 5.9% respectively, over the first half of the year.
        L             H           L               H
              $405                      $290              Due to the lack of transactional activity within the Canberra Civic
                                                          market over H1 2020, there has been no change recorded to office
                                                          yields. In June 2020, yields for A and B grade remain at 5.63% and
       AVERAGE GROSS INCENTIVES
                                                          7.25% respectively.
       Prime                 Secondary
        L             H           L               H
              23%                        28%

       AVERAGE YIELDS
       Prime                     Secondary
        L             H           L               H
      5.00%          6.25%      7.00%            7.50%

       AVERAGE CAPITAL VALUE (A$/m2)
       Prime                 Secondary
        L             H           L               H
            $7,200                      $4,000

    YEAR TO JUL-2020         YEAR TO JUL-2021 (F)

      NET SUPPLY

       17,918m2                   51,650m2

      NET ABSORPTION

       13,789m2                   53,850m2

                                                          480 Northbourne Avenue, Dickson
                                                          Valued on behalf of Doma Group.

9
CBD OFFICE | Research & Forecast Report | H2 2020

ADELAIDE CBD
SNAPSHOT
Market Indicators - Jun 2020
                                                            There has been limited sublease come to the market which has
                                                            been related to the pandemic therefore, vacancy has only increased
                                                            marginally to 14.2%.
                                TOTAL MARKET
                                VACANCY RATE                Leasing enquiry fell during April and May, but has improved
                Adelaide                                    significantly in June and July.
                                Jul-2020       YoY Change
                                     14.2%
                                                            83 Pirie Street, Adelaide being developed by Cbus Property is
                                Jul-2021 (f)                due to commence this year with The Department of Transport &
                                     13.1%                  Infrastructure pre-committing to just over half the building. This
                                                            project is due for completion early 2023.

                                                            60 King William Street, Adelaide which is currently the Southern
        AVERAGE NET FACE RENTS (A$/m2 p.a.)
                                                            Cross Arcade and developed by Charter Hall will be demolished to
        Prime                Secondary
                                                            make way for a new building for the federal government commitment
         L              H           L               H
                                                            of Department of Human Services (DHS). This project is expected to
        $333          $455         $276           $376
                                                            complete in 2023.

        AVERAGE GROSS INCENTIVES
        Prime                 Secondary
         L              H           L               H
                45%                        50%

        AVERAGE YIELDS
        Prime                      Secondary
         L              H           L               H
       5.75%          7.25%       6.96%           7.46%

        AVERAGE CAPITAL VALUE (A$/m2)
        Prime                 Secondary
         L              H           L               H
       $5,779         $6,293      $3,966          $5,040

     YEAR TO JUL-2020          YEAR TO JUL-2021 (F)

       NET SUPPLY

         37,788m2                    27,063m2

       NET ABSORPTION

         40,092m2                       4,826m2

                                                            121 King William Street, Adelaide
                                                            Sold for $82,250,000 in May 2019. Colliers acted on behalf of purchaser,
                                                            Charter Hall who acquired the building from 151 Property.

10
CBD OFFICE | Research & Forecast Report | H2 2020
PERTH CBD
SNAPSHOT
Market Indicators - Jun 2020
Perth CBD incentives have begun to creep higher following the
easing of COVID-19 pandemic restrictions in Western Australia.
Businesses have had more time to assess their future staffing and
TOTAL MARKET space requirements and landlords re-assessing the demand outlook
VACANCY RATE resulted in the market reverting to being a tenants market.
Jul-2020 YoY Change Vacancy increased marginally to 18.4 percent from 17.5 percent in
18.4% January 2020. Colliers currently anticipates vacancy, as a base
Jul-2021 (f) case, will likely continue to increase to a 20.8 percent peak in
Perth
20.7% 2022. The resources sector remains resilient in the current crisis,
and the outlook for global stimulus puts the WA resources sector
and economy on a strong footing which, at the very least, will help
limit the increase in CBD vacancy. In the best case, improving hard
AVERAGE NET FACE RENTS (A$/m2 p.a.) commodity prices could trigger the revival of additional resource
Prime Secondary investment spend, leading to improving office space demand.
L H L H
$525 $775 $350 $410 Colliers has seen some early signs of a shift in A grade tenant
demand towards more cost effective B grade options. COVID-19’s
AVERAGE NET INCENTIVES impact on bottom-lines and subsequent business sentiment is likely
Prime Secondary driving this shift. More could go down that path if business conditions
continue to be impacted by this pandemic, including decentralisation
L H L H
options for tenants that seek higher car parking ratios and/or have
45% 50%
determined that a CBD location is not pertinent.
AVERAGE YIELDS WA’s success at limiting the health impacts, quicker phasing out
Prime Secondary of restrictions and more resilient economic base could see Perth
L H L H improve in attractiveness as a location to allocate investment capital;
5.65% 6.90% 6.75% 7.25% which we believe will, at the least, limit yield decompression and a
likelihood that Prime yields experience further compression over the
next twelve months.
AVERAGE CAPITAL VALUE (A$/m2)
Prime Secondary
L H L H
$8,015 $13,136 $5,000 $5,857
YEAR TO JUL-2020 YEAR TO JUL-2021 (F)
NET SUPPLY
26,043m2
-11,862m2
NET ABSORPTION
20,915m2
-51,247m2
Brookfield Place Tower 1, 125 St Georges Terrace, Perth
Valued on behalf of Brookfield.
11CBD OFFICE | Research & Forecast Report | H2 2020
CAPITAL MARKETS
OUTLOOK
By Karina Salas
Associate Director | Research
karina.salas@colliers.com
Economic uncertainty and market volatility have determined the fate Ownership structure supports asset value
of Australian’s capital markets over the first half of the year, with preservation
just a handful of CBD office buildings (over A$5 million) transacted
A recent commercial market sentiment survey conducted by NAB
across Sydney and Melbourne. We have estimated a decline of
has revealed a sentiment fall of 68 points across the Australian office
90% in CBD office sales volumes to A$664 million in H1 2020. This
market underpinned by the increase in vacancy and the expected fall
compares to A$5.5 billion office buildings transacted in H1 2019. Only
in capital values of 4.4% over the next year and 3% over the next two
during the global financial crisis, we saw a similar decline in CBD
years.
office sales volumes across the country, with the recovery taking at
least 2.5 years (or 5 half-year terms). The results of the survey are not a surprise because the office
market status quo has been altered and some experts even compare
Australia’s decisive economic and health response during the
these changes to the industrial revolution in the 19th century. Some
pandemic should not be underestimated as it has had and will
of the most-troubling challenges faced by the Australian CBD office
continue to have a large influence on investor’s sentiment, supporting
market include the now riskier nature of long-term cash flows, the
Australia’s value proposition compared to other advanced economies.
forecast 12-month negative net absorption (of circa 109,000 sqm to
At the time of writing, Australia remains as one of only 10 countries
July 2021), and the potential structural changes in the making.
around the world retaining its AAA credit rating by all three global
rating agencies. This superior credit rating has remained in place, Our analysis of ownership data reveals that 60-70% of CBD
even after the federal government announced (in mid-July) a 2020 office space is owned by institutional investors including public
forecast GDP fall of 3.5% that is expected to trigger a cumulative REITs, superannuation funds, investment managers and insurance
forecast deficit of A$184 billion (equivalent to nearly 10% of GDP) by companies. As a general principle, institutional investors make
June 2021. From a health perspective, many Australian geographical investment decisions based on a robust plan and strategy. As such,
areas have been able to safely reopen economic activity following the institutional investors generally:
successful implementation of pandemic containment measures.
• have a long-term view of the investment supporting the
Whilst we continue to see disruptions of capital flows into the delivery of risk-adjusted returns to investors,
Australian commercial property market, we have seen some early • adhere to best practice corporate governance principles
signs of improved investment appetite for CBD office buildings over supporting their financial strengths, and
the past few weeks. One of the most resilient deals exchanged in • recruit and retain skilled and talented staff able to strategically
June and expected to settle in Q4 this year, is the A$145 million sale reposition the use and purpose of portfolio assets to ensure
of the B grade building located at 350 Queen Street in Melbourne. alignment with occupiers’ needs.
The asset was acquired by a Singaporean institutional investor, TE
Our analysis of ownership data also reveals that about 15% of the
Capital Partners, at a passing yield of 4.8%. The investment offers a
CBD office space across Australia is owned by private investors/
95% building occupancy and a 3.5 years WALE.
developers, with the largest concentration (of at least 15% of stock
Despite the success of this transaction, CBD office investment ownership) seen in the smallest markets of Adelaide, Canberra and
volumes are forecast to remain below the long-term average for Perth. These three office markets combined comprise less than one
the next 12-24 months. This timeframe could extend if economic quarter of the Australian CBD office stock; hence its contribution to
conditions remain subdued beyond 2022. market value is limited.
Based on the outcomes of our analysis, we have the view that the
ownership structure of the Australian CBD office market underpins
the resilience of the sector, supports long-term value preservation
and reduces the risk to see significant distressed asset sales
released for sale during disruptive times.
12CBD OFFICE | Research & Forecast Report | H2 2020
Buyers already achieving higher risk premium As secondary grade assets carry a higher inherent risk, we expect
despite yields holding firmly the spread between the B grade and 10-year bond yields will
widen at a faster pace compared to Prime grade spreads, reaching
The pandemic has redefined the way people and companies
historical high levels of 630-640 bps by early to mid- 2022.
interact and operate, lifting the inherent risk profile of commercial
property assets, particularly in the office and retail sectors. When
investors weight up the risk and return of an investment opportunity,
they usually assess the risk premium of the investment which is
calculated as the difference between the asset yield and the risk-free
rate (in this instance measured as the 10-year bond yield). Under
uncertain economic and market conditions, investors are expected to
seek a higher risk premium to compensate the increase in risk.
As several countries globally have implemented monetary and fiscal
stimulus measures to reactivate economic activity, we have seen
several advanced economies like Australia, New Zealand, England
and United States reducing the official overnight interbank rate to
historical record low levels. This strategy has effectively triggered
a reduction of the 10-year bond yield allowing for an immediate
repricing of risk in the way of a higher risk premium.
Over the past 6 months, just a handful of CBD office sales have
350 Queen Street, Melbourne
reached unconditional contract stage or actual settlement, providing Sold for $145,000,000 on behalf of a local private investor.
limited evidence of yields holding steady. The 6-months upward
trend on the asset yield spread (compared to the 10-year bond yield)
reveals that investors are already achieving a higher risk premium
despite yields having held steady over the same period. In December
2019, Prime grade investors purchased CBD office buildings
expecting to achieve an average market risk premium of 430 bps
above the 10-year bond yield. In June 2020, the data reveals that
Prime grade investors were expecting to reach an average market
risk premium of 470 bps. Similarly, B grade investors were expecting
to achieve an average risk premium of 550 bps in June 2020
compared to 515 bps reached in December 2019.
Over the next 3 years, we expect that the spread between Prime
grade and 10-year bond yields will continue to widen underpinned by
a further reduction on the cash rate and potential softer asset yields.
We forecast that Prime grade investors will seek to achieve a market
risk premium in the range of 500-505 bps early to mid-2022.
55 Currie Street, Adelaide
Sold for $148,250,000 in September 2019 on behalf of ARC Equity
Partners.
Australian CBD Office Sales (A$5+ million) Australian CBD Office Yield Spread to 10-year Bond Yield
9 Forecast
700
8
600
7
500
6
Spread bp
A$ Billions
400
5
300
4
200
3
100
2
-
1
(100)
0
Jun-10
Jun-11
Jun-12
Jun-13
Jun-14
Jun-15
Jun-16
Jun-17
Jun-18
Jun-19
Jun-20
Jun-21
Jun-22
Jun-23
Jun-00
Jun-01
Jun-02
Jun-03
Jun-04
Jun-05
Jun-06
Jun-07
Jun-08
Jun-09
2007 H1
2007 H2
2011 H1
2011 H2
2015 H1
2015 H2
2018 H1
2018 H2
2016 H1
2016 H2
2014 H1
2014 H2
2012 H1
2012 H2
2009 H1
2009 H2
2008 H1
2008 H2
2010 H1
2010 H2
2017 H1
2017 H2
2020 H1
2013 H1
2013 H2
2019 H1
2019 H2
Half-year sales Long-term average half-year sales National Prime Grade Spread National B Grade Spread
Source: Colliers Edge Source: Colliers Edge
13CBD OFFICE | Research & Forecast Report | H2 2020
OFFICE OCCUPANCY
OUTLOOK
By Kate Gray
Director | Research
kate.gray@colliers.com
In a matter of months, the COVID-19 pandemic has turned life and So, what does all of this mean for the demand for offices going
work upside down. We have all had to get used to social distancing forward? Looking at the data on occupancy from past shocks can
and businesses rapidly adapting to shutdowns with many white- assist in forming a view of what is likely to happen in the future.
collar employees required to work from home. During the early We know that changes to workplaces is nothing new and they have
weeks of work from home, many businesses reported productivity evolved substantially over the last couple of decades. At the heart
was being maintained or even increased as they grappled with of change is the technological advances we have seen including
the rapid change in economic conditions and what that meant for development of Wifi (1997), Google (1998), cloud computing (2006)
their businesses. For many it is a matter of survival with revenue the iPhone (2007), Apps (2008) the iPad (2010) and Skype for
drying up overnight. This resulted in a massive shedding of jobs and Business (2015). Within workplaces we have seen activity-based
reduced work hours which led to the largest stimulus packages in working adopted in the 2000s, hot desking and the use of flexspace
Australian history including JobKeeper, increases in JobSeeker and in more recent years.
now JobTrainer.
1997 2006 2008 2015
Although there is still a high level of uncertainty as to how long the
pandemic will last, we are starting to turn our minds to how offices
will look and what lasting impact this pandemic will have on office
demand in the medium and long term. We have seen a plethora of WIFI CLOUD APPS SKYPE FOR
COMPUTING BUSINESS
workplace surveys on the effectiveness of work from home and the
preference of some to continue to do so permanently.
Technology has advanced significantly including the rapid adoption of 1998 2007 2010
video conferencing and ability to access work servers remotely with
this technology being put to the test globally during the pandemic.
In the short term many white-collar sectors were able to move to
remote working with limited impact on productivity. However, as the GOOGLE IPHONE IPAD
pandemic has progressed and we have needed to work remotely for
longer, the novelty has worn off and some of the cracks of working These evolutions have changed how we occupy office space and the
remotely are starting to show. Decision making can be slower, and type of space we occupy, rather than reduced our need for offices.
collaboration is more difficult due to the lack of face-to-face contact. We suspect that once the health crisis has passed and business
The ability to train new starters and turn around to ask a colleague starts to return towards more normal operations that this shock
how to do something or their thoughts on a problem is more difficult will be no different. Until 2004, secondary grade space had higher
remotely. The conversation around the water cooler with those occupancy than prime grade and by 2010 prime grade had higher
outside your team where an idea is shared doesn’t happen. The occupancy than secondary grade space. Occupancy in secondary
absence of all of these things in the medium to long term are likely to grade space is still equivalent to what it was in 1993, despite having
impact the team’s creativity, collaboration and productivity. cheaper rents than prime grade. This indicates that there is a tenant
preference for newer buildings which allow more efficient and
There have been a many surveys conducted on work from home
technologically adaptable workplaces, which improves staff retention,
which survey worker preferences, however they do not provide
engagement and therefore productivity.
true insight into the decisions regarding occupancy, the location of
offices and other factors such as, cybersecurity, workplace safety,
staff retention, training of new staff, client engagement and corporate
culture. The trend across most of these surveys is the majority of
office workers still want to have some face to face contact with
colleagues but would prefer that not all work hours are in the office.
One of the larger surveys conducted in late April was from Bates
Smart and showed that only 17% of people would give up their
permanent desk as 84% missed the social interaction with their
colleagues.
14CBD OFFICE | Research & Forecast Report | H2 2020
We are starting to see some trends start to emerge. In larger cities
Occupied Stock by Grade - Australian CBD’s
there is talk of a ‘hub and spoke’ model, where there is a smaller
CBD hub office and there are several satellite offices which are 12,000,000
closer to home. An interesting example is banking where the branch 10,000,000
network could also be utilised as an office for some of the current
8,000,000
CBD workforce. This could lead to higher demand in suburban office
locations. Conversely there are also some tenants which are looking
s qm
6,000,000
at consolidation of leases once a lease expires and moving to less
4,000,000
locations.
2,000,000
We are starting to see some tenants looking for more flexibility in
lease terms with the ability to increase and decrease occupancy as 0
Jul-94
Jul-96
Jul-95
Jul-98
Jul-99
Jul-93
Jul-97
Jul-00
Jul-02
Jul-04
Jul-06
Jul-08
Jul-03
Jul-05
Jul-09
Jul-07
Jul-01
Jul-10
Jul-12
Jul-14
Jul-15
Jul-16
Jul-18
Jul-19
Jul-13
Jul-17
Jul-11
their business needs change. We think that this is likely to lead to
more adoption of flexspace for the increases in demand when the Prime Secondary
business need requires. Source: PCA OMR Jan 2020, Colliers International
While we are seeing that the pandemic has changed the way we
work, we think that this will lead to the next evolution as to how
we use office space rather than all of us taking our laptops and
moving home. They are more likely to be collaborative spaces with
more break-out areas and more flexible hours where some are
worked in the office and some from home. Ultimately people are
wired for social connection and offices play a key part in providing
a place for that connection to take place. We see this as being key to
underpinning the next evolution of office design.
121 Marcus Clarke Street, Canberra 133 Mary Street, Brisbane
26,123 sqm managed on behalf of MTAA Superannuation Fund & Realmont Appointed and leased on behalf of ARA.
Property Partners.
15Maximise The Potential Of Your Property
CAPITAL MARKETS
RESEARCH INVESTMENT
SERVICES
VALUATIONS
& ADVISORY
REAL ESTATE
MANAGEMENT
OCCUPIER
SERVICES
PROJECT
LEADERS
LEASING
Offering a team of experts across every asset class and every service, we invest in relationships to
create enduring value. When it comes to delivering this value for your property, collaboration is key.
Our team of industry leaders work together to drive exceptional results.
OUR RESEARCH EXPERTS
Anneke Thompson Chris Dibble Joanne Henderson Luke Crawford
Head of Research Director Director Associate Director
Australia NZ Research & Colliers Edge Research
+61 3 9940 7241 Communications +61 2 9257 0286 +61 2 9257 0296
+64 9 357 8638
Karina Salas Kate Gray Quyen Quach Adrianna Kazzi
Associate Director Director Associate Director Database Analyst
QLD Research SA Research WA Research +61 2 9770 3229
+61 7 3908 9961 +61 8 8305 8806 +61 8 9261 6672
John Nicolopoulos
Manager
National Residential Research
+61 3 9940 7213
Colliers International does not give any warranty in relation to the accuracy of the information
contained in this report. If you intend to rely upon the information contained herein, you must take
note that the information, figures and projections have been provided by various sources and have www.colliers.com.au
not been verified by us. We have no belief one way or the other in relation to the accuracy of such
www.colliers.co.nz
information, figures and projections. Colliers International will not be liable for any loss or damage
resulting from any statement, figure, calculation or any other information that you rely upon that
is contained in the material. © Colliers International 2020. Accelerating success.You can also read