Antares Vision Presentation
←
→
Page content transcription
If your browser does not render page correctly, please read the page content below

Antares Vision
Presentation
June 2019
Management
Emidio Zorzella Massimo Bonardi Alioscia Berto
Co-CEO (co-founder) Co-CEO (co-founder) CFO
President and co-founder of Antares Managing and Technical Director and CFO since 2018
Vision (2007) co-founder of Antares Vision (2007)
Joined in 2015 from Fondo Italiano
Industrial Division General Manager of Industrial Division General Manager of d’Investimento SGR where he served as
Tattile (2004-2007), an Italian company Tattile (2004-2007), an Italian company Partner from 2011 to 2015
producer of vision system solutions producer of vision system solutions
Previously Senior Principal and
Co-founder of SemTec (1998), Co-founder of SemTec (1998), Managing Director of Italy at Doughty
University spin-off; collaboration with University spin-off; collaboration with Hanson & Co (1998-2010)
IMA for the integration of artificial IMA for the integration of artificial
Investment Banking at ING – Barings
vision systems with application on vision systems with application on
(1997-1998)
packaging machinery packaging machinery
Corporate Finance at KPMG (1994-
Researcher at University of Brescia Researcher at University of Brescia
1997)
(1997-1998) (1997-1998)
Graduated in Business Administration
Graduated in Opto-electronic at Graduated in Opto-electronic at
at Bocconi University (1994)
Politecnico di Milano (1995) Politecnico di Milano (1995)
2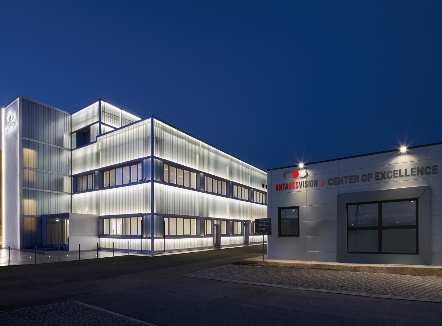
Table of contents

    I    Introduction to Antares Vision   4

    II   Equity story                     8

         Appendix                         18

3
Section 1

Introduction to Antares Vision
Vision                                                                                         “A series of forces are increasingly reshaping the
                                                                                              Track & Trace and the Visual Inspection markets…

                                                                                VISUAL INSPECTION
                                                         INCREASING PENETRATION                                      CROSS SELLING
                                                         of visual inspection solutions                              OPPORTUNITIES

                                                                                    TRACK & TRACE
                                   REGULATORY EVOLUTION ENLARGEMENT                FULL VALUE CHAIN         TECHNOLOGICAL ALIGNMENT          SMART SUPPLY CHAIN
                                     for prescription drugs to OTC products            CONTROL                 of the industrial market        MANAGEMENT

                                                                                          SMART DATA
                                                                   DATA                              CONTINUOUS INDUSTRIAL IMPROVEMENT
                                                                 MONITORING                            through big data and analytical tools

                                                 …where Antares Vision can leverage a unique set of skills…

 SHAREHOLDERS’ FORESIGHT                      STATE-OF-THE-ART                            ONE-STOP-SHOP                         CREDENTIALS and               360° SERVICE PORTFOLIO
 in selecting the pharmaceutical                TECHNOLOGY                         with the most complete offer of              TRANSFERABILITY              with the support of a worldwide
              market                        in the Track & Trace sector                hardware and software                of pharmaceutical know-how               specialized team

to obtain a critical competitive         to consolidate its leading role           to face customer needs and              to expand into the industrial          to guarantee clients
          advantage                      in the pharmaceutical market              technological development                market with a unique edge                  proximity

                                    …to become the global leader in the market for a healthier and safer world”

                                                                          #1     Technological leader in                  #1
                                                                                 tracing, inspection and
                                                                                         quality
Unique way to serve customer needs in the Track & Trace business
    Governmental /
    Supply chain                                                                Regulatory         External
                                                                                                                           CMOs
       Smart Data                                                                agencies        supply chain

                                                                                             ATS link
    Corporate                                                                                ATS Hub
    Level 4                                            Corporate ERP
       Smart Data

                                                                                         ITS interface tracking system                                      Warehouse management system

                                                           Plants ERP
    Production plant                                                                                                                      Site database
                                                                                                                                                          WTS warehouse and shipment manager
    Level 3
     T&T
                                                                                              GTS plant manager

                                                                                   Production lines
    Production line                                             Serialization                                     Aggregation

    Level 2                                                                            STS Automatic aggregation
                                                             MTS line manager          HTS Semi-automatic aggregation
     T&T               VI                                                                                                                                      WTS station and terminals
                                                                                       PTS Manual aggregation

    Devices
    Level 1                                                                                                                                                             Rework
                                                Visual         Serialization
                                                                                          Bundle                     Case              Pallet                          shipment
     T&T               VI                     Inspection       of cartons or
                                                                                        aggregation               aggregation       aggregation                       pick & pack
                                               machines           bottles
                                                                                                                                                                         recall

     AV offers a complete suite of serialization modules, aggregation systems and flexible software in order to be compliant to all legislations on serialization, aggregation and e-pedigree

                                                                                                      Corporate        Production   Warehouse
6           Sources:    Company information
Antares Vision at a glance
~47% ~27% ~€121m ~€33m 79% 60 500+ 35+ 300+ 2,500+ 5,000+
VoP CAGR 2018A EBIT 2018 VoP1 2018A EBIT1 Export Countries Workforce2 Partners Pharmaceutical Installed Processed SKUs
12A-18A1 margin1 served plants lines (m)
Overview of the Company Key financials1
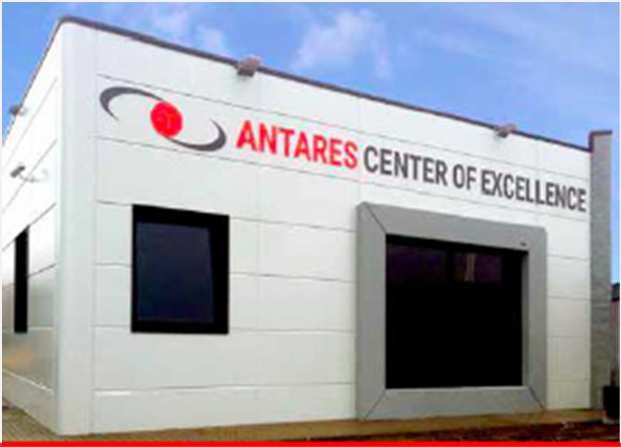
• Founded in 2007 and headquartered in Travagliato (Brescia), Antares Vision (“AV” €m
or the “Company”) is the leading global provider of traceability and vision control 121,5
solutions (a combination of hardware and software) for the pharmaceutical and
other industrial sectors 89,6
• The Company designs, manufactures, installs and maintains innovative serialization
58,7
and high performance inspection systems and machines and it recently entered
46,0
the Smart Data Management segment 22,6% 21,4% 23,0 32,7
25,4
11,8 7,1% 16,1 7,3% 8,7% 25,7% 26,9%
• AV products and software are used for serialization, inspection and data collection 10,4 12,6
activities both by direct customers and regulatory bodies 0,8 1,2 2,2
• The Company is leader in the pharmaceutical industry with a fast growing 2012A 2013A 2014A 2015A 2016A 2017A 2018A
presence into industrial sectors such as F&B, cosmetics and fashion VoP EBIT EBIT %
• Antares Vision systems are mainly installed stand-alone and to a lesser extent
integrated in high-performance third party machinery. As of today, there are: 2018 revenues 2018 revenues 2018 revenues
• More than 300 pharmaceutical plants equipped with AV’s serialization and
by region3 by product line3 by industry3
Middle East
aggregation technologies (more than 2,500 installed lines) & Africa Smart Other
Asia Data Industrial Other
4% 6% Italy Services 1% 1%4
• More than 5bn of SKUs serialized, aggregated and distributed worldwide 21% 5%
1% Track & Trace
4%
South America
thanks to AV solutions 2%
73%
• More than 25,000 inspection systems installed North America
10%
Visual
• The Company boasts a global reach (export accounts for c. 79% of 2018 revenues) Inspection
guaranteeing proximity to customers and service level through 10 local facilities 20%
and 35+ partners
RoE Pharma
57% 95%
Abbrev.: VoP = Value of Production
Notes: (1) All figures refer to statutory accounts;;; (2) Including partners’ employees; (3) Management accounts; (4) Other refer to non-allocated revenues
7 Sources: Company information
Section 3

Equity story

Antares Vision: a compelling and unique investment case

                  Unique & integrated solutions portfolio supported by a state of the art, proprietary technology
              1   providing cutting-edge solutions to a blue chip customer base

                          Outstanding financial track record with double-digit revenue growth, solid profitability, best in class
                  2       cash generation and high visibility over future years revenues

                             Attractive market fundamentals, driven by regulatory push, with secular trends towards product
                      3      safety, quality and traceability solutions favouring the penetration of track & trace and visual
                             inspection systems in new sectors

                      4      Flexible business model with unique capabilities to meet customers’ needs

                          A clear and high visible strategic path for future growth, driven by regulatory requirements, end-
                  5       markets served and consolidation in the industry

              6   Highly committed and experienced management team with deep roots in the industry

9
1
       Unique & integrated solutions portfolio supported by a state of the art, proprietary
       technology providing cutting-edge solutions to a blue chip customer base (1/2)
                                                                                                                        Unparalleled product offer…                                                 …serving a blue chip cusotmer base
                                                                                                                                                          Critical technologies Internal know-how
                                                                                                                                                                                                                                ~95%1
                                                                              Integration kit installed on existing                                         Software: user
                                                     Single                       production/packaging lines                                                   interface
                                                    machine                          (no product handling)                                                                                                 PHARMA

                                                                               Standalone systems able to work
                                                                                      independently from                                                    Real-time data
                                                    Systems                       production/packaging lines                                                 management
                     Track &                                                        (with product handling)
                      Trace
                          (“T&T”)                                           IT solutions to manage machines, lines,        GTS/MTS – plant/line manager         Artificial
                                                   Software                   plants, warehouses & shipment, etc.          WTS – warehouse and shipment       intelligence

                                                Installation &              Installation and project related services                                     SW: production line
                                                                              (e.g. PMO, expenses, training, etc.)                                         and plant (L2-L3)
                                               project services

                                                                                Equipment installed on existing
                                                  Inspection                      production/packaging lines
                                                                                                                                                            Software: user
                                                   systems                                                                                                     interface
                                                                                     (no product handling)
                                                                                                                                                                                                      Sole provider for 10 out of 20 of top
       AV                                                                                                                                                                                                 pharmaceutical companies
                     Visual                                                    Standalone systems able to work
    offering                                      Inspection                          independently from                                                    Real-time data
                   inspection                                                     production/packaging lines
                                                   machines                                                                                                  management
                     (“VI”)                                                         (with product handling)
                                                                                                                                                                                                                                ~4%1
                                                Installation &              Installation and project related services
                                                                                                                                                             Software and
                                               project services               (e.g. PMO, expenses, training, etc.)
                                                                                                                                                            automatic tools
                                                                                                                                                                                                         INDUSTRIAL

                                                                             IT solutions aimed at connecting the
                          Smart                                              company with external actors as well
                                                                                                                                                          SW: corporate (L4)

                           Data                    Software                  as quality and efficiency monitoring,                                            Blockchain
                                                                                       data management

                                                                             Including remote assistance, on-site
                                                After sales &
                     Services                                               maintenance, preventive maintenance,
                                                 spare parts                           spare parts, etc.

                                                               Leadership in track & trace offers unique edge into inspection in terms of technology and clients’ overlap

               Notes:       (1) The remaining stake refers to other non-allocated revenues
       10      Sources:     Company information
2
Outstanding financial track record with double-digit revenue growth, solid profitability, best in
class cash generation and high visibility over future years revenues
1 Revenues – Superior top-line growth 2 EBIT – Solid profitability
High revenues visibility thanks to backlog which covers c. 70-80% of one year forward
71% 79% 78% 71%
119,2 32,7
89,6
23,0
58,7
44,7 12,6
9,5
25,7% 27,4%
21,0% 21,4%
2015A 2016A 2017A 2018A 2015A 2016A 2017A 2018A
Revenues Backlogt-1 as % of Revenuest EBIT EBIT margin
Note: Backlog as of 31.12.2018 is Euro 80 millions.
3 Net Income – Exceptional bottom line 4 Cash conversion – Best in class cash generation
Cash
conversion1 59.3%2 97.7% 92.9% 93.5%
22,6 31,2
15,4 22,1
9,3 12,9
6,5
18,9% 6,1
14,4% 15,8% 17,2%
2015A 2016A 2017A 2018A 2015A 2016A 2017A 2018A
Net Income Net Income margin EBITDA - Capex
Notes: 2016A – 2018A figures refer to a new reclassification scheme (following the adoption of a new IT system), with the exception of 2016 and 2017 capex. Margins are calculated on sales.
2015 figures have been adjusted for accounting errors in North America (pls refer to 2016 1H financial report for detailed explanations).
11 (1) Computed as EBITDA – capex as % of EBITDA
(2) Lower cash conversion due to higher capex related to the new building located in Travagliato (Brescia) where the headquarter has been moved since June 2015
Sources: Company information,Attractive market fundamentals, driven by regulatory push, with secular trends towards product safety, quality and
3
traceability solutions favouring the penetration of track & trace and visual inspection systems in new sectors (1/2)
PHARMACEUTICAL MARKET at the forefront of the technological and regulatory development
2017 2021 AV potential
Visual Visual
Inspection Inspection Visual
18% 14% Inspection
€1.6bn1 €2.6bn1
Track & Trace
Track & Trace Track & Trace
82% 86%
Key features Growth drivers Antares Vision
Advanced technological footprint thanks to Increasing T&T penetration (from 3% in 2017 Consolidation of leading technological
earlier regulation enforcement to 55% in 2025) due to regulatory push positioning
Upstream/downstream integration of T&T
T&T solutions focused on the packaging Growing underlying pharma market (+4.6% solutions (e.g. suppliers, customers)
process CAGR 2017-22)
Cross-selling in the VI sector leveraging
relations with existing T&T clients
VI sector characterized by more standardized Fundamental shift towards technological
solutions solutions in the VI sector Increasing role of smart data management
T&T replacement cycle (revamping
Applications focused on prescription drugs Untapped OTC market (c. €115bn in 2016)
approximately every 6 years)
Notes: (1) Excluding OTC market
12 Sources: Company information, Markets and Markets, Efficacy AssociatesAttractive market fundamentals, driven by regulatory push, with secular trends towards product safety, quality and
3
traceability solutions favouring the penetration of track & trace and visual inspection systems in new sectors (2/2)
T&T/VI solutions in the INDUSTRIAL SECTORS will most probably align to the pharmaceutical market standards
2017 2021 AV potential
Visual Visual
Inspection Inspection Visual
14% 12% Inspection
€14.4bn €19.2bn
Track & Trace
Track & Trace Track & Trace
86% 88%
Key features Growth drivers Antares Vision
Relevant market size vs pharma (c. 9x the Positive growth outlook (+7.4% CAGR 2017-21)
21) Best-in-class technology to be the enabling
currently addressed market) widespread across several markets factor of a technological revolution
Full supply chain management to track and
Technological profile not aligned to the market trace the whole life cycle
needs Chemicals F&B Components Jewelry Transportation Others1
+6.4% +4.8% +4.4% +8.7% +13.0% +7.8% Cross-selling in the VI sector providing fully
integrated solutions
T&T solutions not applicable to the single SKU Increasing penetration
Increasing role of smart data management
Regulatory evolution starting to enforce Leverage on industrial investors know-how
Standard T&T solutions replacement cycle
structural changes in some industrial sectors and experience
Notes: (1) Testing labs & health institutes, utilities & municipalities and biotechnology Existing business
13 Sources: Company information, Markets and Markets, Efficacy Associates4 Flexible business model with unique capabilities to meet customers’ needs
• Most complete product offering combining hardware, software and
integrated solutions
FLEXIBILITY
• Production flexibility thanks to a lean business model allowing AV to focus
on value added phases (e.g. R&D) and to outsource manufacturing/assembly
• Recognized technological leadership as demonstrated by the several
certifications and awards received
QUALITY
• In-house co-testing activities before final order delivery to provide customers
with fully reliable and high quality solutions
• Widespread global presence guaranteeing local support to customers
PROXIMITY
• 24/7/365 after sale support to client on a global base
14 Sources: Company information5
A clear and high visible strategic path for future growth, driven by regulatory
requirements, end-markets served and consolidation in the industry
5
INORGANIC GROWTH
4 M&A optionality to
SMART DATA accelerate growth
3 Further upside potential
from the development of a
INDUSTRIAL
fully comprehensive digital
2 Scale-up of industrial solutions offer allowing big
segments with relevant data collection, monitoring
CROSS-SELLING
market size and positive and elaboration
1 Top-line expansion growth outlook (e.g.
consolidating the leading food & beverage, luxury
PHARMA position in the T&T & jewelry), leveraging
business and exploiting
Continued growth in best in class technology
cross-selling opportunities
existing pharma business, and distinct experience
in the VI one by relying on
driven by favourable and know-how of
a loyal and extended
market trends, increasing customer base industrial shareholders
penetration and
expansion into adjacent
OTC niche leveraging
state-of-the-art
technologies and relations
with existing clients
15 Sources: Company information4
5 Smart Data
Smart data management as the enabling factor for T&T and VI integration to provide product traceability across the entire supply chain
• Development of a cloud-based, high speed and safe
access database in order to provide FULLY
INTEGRATED SUPPLY CHAIN solutions
• DATA MONITORING in order to increase
optimization and production efficiency
• BIG DATA and other analytical connected tools
unlock a huge amount of data for commercial and
product development purposes
AV can leverage its technological leadership to provide fully integrated solutions with embedded analytical software triggering additional sales
NEW MACHINE ORDER BIG DATA ANALYSIS FULLY INTEGRATED SOLUTION
16 Sources: Company informationAntares Vision: the future is here
TRUSTPARENCY
PRIME POSITIONING in INDUSTRIAL MARKETS
to keep the leadership in the value proposition of a safer and
healthier world
TECHNOLOGIES and IMPLEMENTATION
on the market, developing track & trace solutions
EXPERTISE from PHARMA
leverage on more than 10 years in regulation
compliance
17 Sources: Company informationAppendix 1
Current group structure & shareholdings

                                                           Regolo Srl                       Mercato                       Sargas Srl

                                                                  74%                             12%                     14%

                                                                                        Antares Vision Srl

      100%                                    100%                         100%                   99.9%        100%                               100%            51%

Imago Tech                          Antares Vision Inc                  AV France Sas     AV Do Brasil       AV Ireland                         AV Russia        AV India

                                                                                                  99.9%                                                                 49%
                                        70%

                                                                                                                                                            Parag Khotari /JISL
                                                         Andrew Pietrangelo

                                                 30%

                                    Antares Vision NA                                    LEGG System

                                                                                                                   Holdings
                                                                                                                   Manufacturing/assembly and
                                                                                                                   commercial subsidiaries
             Sources: Company information                                                                          Commercial subsidiaries1
 19
                                                                                                                   Others
Management team
Proven top-line management…
Emidio Zorzella Massimo Bonardi
President and Managing and Technical
co-founder Director and co-founder
• 47 years old • 48 years old
• Industrial Division General Manager of Tattile (2004-2007) • Industrial Division General Manager of Tattile (2004-2007)
• Co-founder of SemTec (1998), University spin-off; collaboration • Co-founder of SemTec (1998), University spin-off; collaboration
with IMA for the integration of artificial vision systems for with IMA for the integration of artificial vision systems for
packaging machinery packaging machinery
• Researcher at University of Brescia (1997-1998) • Researcher at University of Brescia (1997-1998)
• Graduated in Opto-electronic at Politecnico di Milano (1995) • Graduated in Opto-electronic at Politecnico di Milano (1995)
…supported by a committed first line management team
Alioscia Berto Fabio Cardella Gianfranco Landolfi Adriano Fusco Micaela Orizio Gianpaolo Gasparini
CFO Technical Manager Sales Director Strategy Manager Marketing Communications R&D software Director
Director
• 48 years old
• 61 years old
• In Antares Vision since 2015 • 51 years old • 42 years old • 44 years old • 45 years old
• In Antares Vision since 2007
• Previously Partner at Fondo Italiano • In Antares Vision since 2008 • In Antares Vision since 2012 • In Antares Vision since 2017 • In Antares Vision since 2008
d’Investimento (2011-15); Senior • Responsible for the growth strategy
• Responsible for industrial vision • Responsible for developing the key • 20 years of experience, previously • Responsible for Track & Trace
Principal/Managing Director of Italy at of the operations in North American
systems sectors and establishing long-term working at SSAB (11 years), Abert (4 solutions (eg. ERP/MES and WMS
Doughty Hanson & Co (1998-2010); partnership with customers years) and Bialetti (5 years) integration, project management)
associate at ING Barings (1997-1998);
KPMG Consulting (1994-1997)
Carlo Marconi Carsten Strape Andrew Pietrangelo Silvia Baresi Elena Boniotti
General Manager General Manager General Manager QA Manager Information system
• 64 years old • 48 years old
• 56 years old • 41 years old • 43 years old
• In Antares Vision since 2018 • In Antares Vision since 2013
• In Antares Vision since 2009 • In Antares Vision since 2013 • In Antares Vision since 2014
• Responsible for the inspection • President of Antares Vision North
• Responsible for Imago Technologies • Responsible for the realization and • Responsible for the development of
machines business unit America
implementation of governance and the internal computer system
compliance systems
20 Sources: Company informationAppendix 2
Market size and trends
Track & trace and inspection solutions market size (2017) and growth trends (2017-21) Key growth drivers
T&T
14.5% 6.8% 4.5% 4.4% 9.3% 14.1% 8.3% 8.5% Track & Trace
CAGR 2017-21
Inspection • Pharma
CAGR 2017-21 5.9% 4.0% 6.8% 4.1% 5.2% 5.7% 4.2% 4.8%
• Regulatory evolution
Total • Enlargement to OTC products
CAGR 2017-21 13.1% 6.4% 4.8% 4.4% 8.7% 13.0% 7.8% 8.0%
• Increasing penetration
Other industries
18
•
2017, €bn
16
0,6 • Technological alignment to
2.3 pharma standards
14
• Replacement cycle
4,3
12 • Transparency with consumers
0,2
TECHNOLOGY/ 1,2 • Marketing communication
10
0,2 11
REGULATORY • Smart supply chain
0,3 1,3 10
8
GAP management
0,2 1,4 8 13.7
Inspection solutions
6
1,5
0,6
4
5
2,8 • Pharma
2
0,3 • Regulatory evolution
0
1,3 2 • Technological shift
Non è possibile v isualizzare l'immagine.
1
Pharma Chemical Food & Metal plastic & Raw materials & Transport & Others Total • Increase productivity and cost
Beverage electronic jewerly logistics savings
components
• Safety/quality
T&T
• Other industries
• The chart highlights that Pharma represents only c. 10% of the total T&T and VI market currently
Inspection2 served • Increasing penetration
• The differentiating factor (with respect to the industrial market) lies in the highly advanced • Products quality assurance
Existing business technology implemented to be aligned with the stringent regulation
• Waste reduction
• The industrial market is relevant in size but technologically backward and it will be disrupted by
New segments being • Safety
entered
regulatory and technological waves
Notes: (1) Testing labs & health institutes, utilities & municipalities and biotechnology; (2) Including visual inspection systems, leak detection systems, x-ray
22 inspection systems and others (e.g. checkweighers, metal detectors)
Sources: Company information, Markets and Markets, Efficacy AssociatesMarket size and trends – Focus on pharma market (1/2)
Track & trace and inspection solutions market size (2017) and growth trends (2017-21)
€bn CAGR ’17-’21
2,6
0,4 5.9%
1,6
0,3
2,2 14.5%
1,3
2017A 2021E
1
T&T Inspection
AV reference market was worth around €1.6bn in 2017 and it is expected to grow double digits in the future (+13.1% CAGR 2017-21) mainly driven by T&T solutions (+14.5% CAGR 2017-
21) in combination with hardware and software evolution
T&T Visual Inspection
1• Growing underlying pharma market (+4.6% CAGR 2017-22) with 1• Growing underlying pharma market (+4.6% CAGR 2017-22) with
untapped OTC potential untapped OTC potential
2• Increasing T&T penetration (from 3% in 2017 to 55% in 2025) due to Fundamental shift towards technological solutions in the VI business
2•
regulatory push
3• Expansion of the hardware portfolio, with new systems and single 3• Hardware technology innovation
machines introduced in the market
4• Development of smart data management tools to provide full value
4• Empowerment of the software suite leveraging on digital tools for line, chain control and visibility
plant and warehouse management
AV is best positioned to further consolidate its leading technological positioning in its reference market
Notes: (1) Including visual inspection systems, Leak detection systems, x-ray inspection systems and others (checkweighers, metal detectors, etc.)
23 Sources: Company information, Markets and Markets, Efficacy AssociatesMarket size and trends – Focus on pharma market (2/2)
T&T – Regulatory evolution for drugs with prescription
• T&T adoption will be mainly related to regulatory evolution driven by addition of new • Regulation evolution is boosting and will continue to boost T&T
countries, addition of aggregation requirements and enlargement to OTC products systems adoption in next years
• Drugs passing through T&T systems will increase from 23% in 2018
to 55% in 2025 and up to 67% by 2030
Se: serialization 1 67%
Se: by 2019 Se: since 2017
Ag: aggregation 55%
Ag: not yet Ag: not yet
Se: from 2018 (by 2020)
discussed discussed
Ag: from 2018 (by 2020)
Se: by 2025 23%
Se: since Ag: not yet
Se: since 2010
2017 discussed Se: by 2021
Ag: since 2012
Ag: not yet Ag: not yet
discussed discussed
2018E 2025E 2030E
T&T
Se: since 2016
Ag: not yet discussed
Se: by 2018
Ag: by 2022
Se: under discussion
Prescription drugs
Ag: under discussion SE
Se: by 2018
Ag: not yet Se: by 2022 AG
discussed Ag: not yet Se: under discussion
discussed Ag: under discussion
OTC
Se: since 2012 Se: since 2017
Ag: not yet discussed Ag: under discussion 2010 2012 2016 2017 2018 2019 2021 2022 2025
• Switching between manual or semi-automatic inspection machines
towards automatic systems in order to:
Inspection • Save on personnel costs
• Increase production lines' productivity • The adoption of automatic inspection solutions is mainly
Adoption of • Reduce human errors driven by cost saving and effectiveness targets set by
automatic • Improving OEE (Overall Equipment Effectiveness) pharmaceutical companies
solutions • Ensuring compliance with internal or external requirements
• Improving products’ uniformity and conformity to quality specifications
Notes: (1) In Russia, T&T will be adopted also for OTC products
24 Sources: Company information, Pharmaceutical Serialization and Traceability 2016 Report, Euromonitor, websitesAppendix 3
Consolidated historical Profit & Loss

     Antares Vision Consolidated P&L
                 ('000,€)
                                                    2016            2017           2018           CAGR '16-'18
                                                                                                                                               Commentary
 Sales                                                    58.679       89.632         119.165             42,5%   1
 CAPITALIZATION OF R&D                                                                  1.238                nm
 Other Tax Credit                                                                         107                nm
                                                                                                                      1•   Top-line expansion mainly driven by positive performances
                                                                                                                  2        in USA and Europe, which respectively significantly grew in
 Tax Credit                                                                               971                nm
 Value of Production                                     58.679        89.632        121.482             43,9%             2017 and 2018 thanks to the start of regulation in the
 CHANGES IN INVENTORY STOCK                               -6.344        -8.865          1.224                nm            following years.
 PURCHASE MATERIALS                                       23.367        34.025         36.350             24,7%
 Changes in work in progress                                -720            13              2                nm
 Cost of Goods Sold                                      16.303        25.174         37.577             51,8%
                                                                                                                      2•   In 2018 the Company capitalised some costs relating the
 Margin % on Sales                                        27,8%         28,1%          31,5%                               development of solutions for the beverage sectors and
                                                                                                                           benefited of about €1 million of ta credit for R&D activity.
 Commissions for agents                                    1.602         2.131          3.220             41,8%
 Installation Expenses                                     2.906         2.982          4.025             17,7%
 First Margin                                            37.868        59.345         76.660             42,3%
                                                                                                                  3   3•   First Margin structurally in the 64-66% range
 Margin % on Sales                                        64,5%         66,2%          64,3%

                                                             900         1.185          1.533             30,5%
                                                                                                                      4•   Growing operating costs mainly driven by the increase in
 Third party assets
 Operating expenses                                           62           197            101             27,3%
 Services                                                  7.989        13.497         15.363             38,7%   4        •    services costs in order to cope with the business growth
 Added Value                                             28.917        44.466         59.662             43,6%
 Margin % on Sales                                        49,3%         49,6%          50,1%
                                                                                                                           •    Personnel costs related to the hiring of 70 additional
 Labour Cost                                              15.513        20.513         26.107             29,7%                 employees in 2018 and 61 in 2017
    Employees                                             12.956        16.958         21.882             30,0%
    Professional Staff                                     2.558         3.555          4.224             28,5%       5•
 EBITDA                                                  13.404        23.953         33.556             58,2%             EBIT expansion is mainly driven by the resilience of the First
 Margin % on Sales                                        22,8%         26,7%          28,2%                               Margin and therefore by the operating leverage
 Provision                                                   156           177            220             18,9%
 Depreciation                                                677           772            650             -2,0%
    R&D intangible assets                                    457           422            420             -4,2%
    Tangible assets                                          220           350            231              2,4%
 EBIT_RICL                                               12.571        23.005         32.685             61,2%
                                                                                                                  5
 Margin % on Sales                                        21,4%         25,7%          27,4%

 Financial expenses                                           296           400            897            73,9%
 Extraordinary expenses                      -577                           122            262               nm
 Founds Release                                                                             -4               nm
 Altri Conti PL
 EBT_RICL                                                12.852        22.483         31.531             56,6%
 Margin % on Sales                                        21,9%         25,1%          26,5%

 Taxation                                                  3.527           6.387          8.656           56,7%

 Third Parties Profit                                          73           715            306           104,9%

 NET PROFIT                                                9.252       15.380         22.568             56,2%
 Margin % on Sales                                         15,8%        17,2%          18,9%

26          Sources:    Management Accounts - Company information
Focus on top-line evolution
Breakdown by geography1 Breakdown by business line Breakdown by industry
CAGR CAGR CAGR
€/000 ’16A - ’18A €/000 ’16A - ’18A €/000 ’16A - ’18A
119.165 119.165
166.9%
6.4% 5.4% 74.8% 119.165
3.7% 37.4% 1.1%
3.5% ~0% 37.4%
1.7% ~1%
(10.9%) 20.1% 57.7% 1.5%
9.5% 4.7% 90.6%
89.632 89.632
0.1%
7.1% 5.2% 89.632 16.1%
45.3%
10.1% 18.0% ~0%
8.5% 3.8%
~0%
4.6%
1.3% 21.5%
7.6% 34.5% 12.2%
58.679 58.679
28.0% 8.8%
1.8%
57.4% 45.8% 3.6 58.679
4.0% 6.9% ~0%
4.4% 3.8%
16.4% 2.7% ~0% 94.5%
19.3% 15.5%
72.1% 37.2%
14.7%
95.9%
8.5%
56.9% 42.6% 79.1%
39.5%
54.9% 57.6% 95.9%
77.7%
56.8%
21.2% 66.2%
15.6% 15.6%
2016 2017 2018 2016 2017 2018 2016A 2017A 2018A
Pharma
Italy RoE Machinery Component parts T&T Vision Services Smart data T&T
Industrial
North America South America Software Assistance
Vision Services Other 2 Total sales
Asia Middle East and Africa Other (Manuals etc.)
• Revenues by geography shows that Italy, Europe and • Machinery represents the main business line • Antares Vision is mainly focused on the
North America represents the key end markets. pharmaceutical industry which represents c. 95% of
• Assistance has been growing in order to provide full
North America declined in 2018 after the regulation total revenues and registered a CAGR of 41.4% over
customer support and be more competitive on the
was implemented. A new ramp-up is expected in the the 2016-18 period
market
next years thanks to the introduction of the
aggregation. • This service will become increasingly important • Service is a growing component that is recurrent in
assuming a relevant role within the Company nature and carries higher margins
Notes: (1) Based on country of invoicing; (2) 2018 non-allocated revenues (following the change in the information / reporting system)
27 Sources: Company informationConsolidated historical Balance Sheet
Antares Vision Consolidated BS ('000,€) 2017 2018 Commentary
Real Estate 5.307 6.393 1
Financial Assets 0 0
Net Tangible Assets 158 163 1• Tangible assets mainly include buildings: the headquarter in
Net Intangible Assets 1.246 1.682 2 Travagliato (BS); a new leasing started in Aug17 related to the
Total Fixed Assets 6.711 8.238 building located in Parma and a new building in Torbole
% Incid. On NIC 21,3% 20,1% Casaglia (BS)
Inventory Raw Material 15.014 17.361
Inventory Finished Goods 8.295 4.137
2• Intangible assets mainly refer to R&D capitalized costs in
Inventory WIP 1.274 743 period 2012-2014 and in 2018
Total Inventory 24.583 22.241
3• Trade working capital absorbed c. €11m in 2018
Trade Receivables 31.749 41.451
Trade Payables -10.299 -12.056 • Inventory: decrease due to fast delivery of finished
Advances from Clients -19.448 -14.231 products thanks to the regulation start in Europe
Trade Net Working Capital 26.585 37.405 3
% Incid. On NIC 84,4% 91,2%
beginning of 2019.
Other Current Assets 6.077 6.919 • Trade receivables: increase largely driven by business
4 growth with DSO remaining mostly in line
Other Current Liabilities -5.768 -8.926
Net Working Capital 26.895 35.399
% Incid. On NIC 85,4% 86,3% • Trade payables: increase mainly driven by the business
expansion with a slight reduction of DPO
Severance Indemnity Fund (TFR) -1.573 -2.102
• Advances from client: reduction driven by the
Other Funds -19 -64
Bad Debt -528 -465 completion of projects as a consequence of regulation
Net Invested Capital 31.485 41.006 start in Europe in 2019
% Incid. On NIC 100,0% 100,0%
4• Other assets/liabilities mainly include tax and social security
Net Equity 40.556 71.389 liabilities, payables to employees and advances to suppliers.
Net Equity 40.556 71.389 5
% Incid. On TSoF 128,8% 174,1% 5• Net Equity has benefited the €40 million capital increase
Long Term loans + Leasing 6.682 32.236 from Sargas, which (accounting-wise) has been partially offset
6
Net Cash -15.753 -62.619 by the reverse merger with the holding company H.I.T. S.r.l.
Net Financial Debt -9.071 -30.383
% Incid. On TSoF -28,8% -74,1% 6• Net Financial Debt incorporated €30 million coming form the
reverse merger (and clearly the capital increase).
Total Source of Financing 31.485 41.006
% Incid. On TSoF 100,0% 100,0%
28 Sources: Company informationHistorical cash generation – Net cash bridge
Since 2015 Net Cash Flow was largely driven by EBITDA growth; strong NWC dynamics with room for improvement
35000
€/000
30000
new leasing for
25000
the building in
(13.514) Parma
1.140 10.131
20000
23.814
(400) (122)
15000
16.998 (1.684) 16.429 16.307 (6.330)
10000 6.698 Currently being 375
15.314 15.689 8,668
optimized
9.977 (1.310)
5000
8.667
6.698 6.698
0
45000,0
€/000
40000,0
(8.504)
35000,0
529 22.903
7.958 30.383
30000,0
34.123 (2.177) (239) (897) (258)
31.945 32.235 31.339 31.081 (8.656)
25000,0
33.556
20000,0
22.425 22.425
15000,0
8.668 9.071
10000,0
403
5000,0
8.668 9.071
0,0
9.332
Working capital has not been the main point of attention with management focused on strengthening the team and identifying several recovering actions
Notes: (1) 2017A and 2018A figures refer to a new reclassification scheme (following the adoption of a new IT system); the 2016-2017 net cash bridge refers to the old
29 classification (since 2016 balance sheet figures have not be reclassified), so the ∆ reconciliation is needed to align the starting point of the 2018 net cash bridge
Sources: Company informationGlossary • A – Actual • SW – Software • CAGR – Compound Annual Growth Rate • TFR – Trattamento Fine Rapporto • CEO – Chief Executive Officer • TWC – Trade Working Capital • CFO – Chief Financial Officer • VoP – Value of Production • COGS – Cost of Goods Sold • Yoy – Year over Year • D&A – Depreciation and Amortization • DOI – Days of Inventory • DPO – Days Payables Outstanding • DSO – Days Sales Outstanding • E – Expected • EBIT – Earnings Before Interest and Taxes • EBITDA – Earnings Before Interests, Taxes, Depreciation and Amortization • FY – Full Year • F&B – Food and Beverage • IT – Information Technology • M&A – Merger and Acquisition • NWC – Net Working Capital • OCF – Operating Cash Flow • OTC – Over the Counter • PBT – Profit Before Taxes • PMO – Project Management Office • QA – Quality Assurance • R&D – Research and Development • RoE – Rest of Europe • SKU – Stock Keeping Unit 30
Disclaimer

This presentation (“Presentation”) has been prepared for information and discussion purposes only, it contains only summary information and data relating to Antares S.p.A. (“Company”), its subsidiaries.
Furthermore, it has been drafted without claiming to be exhaustive

This Presentation may contain financial information and/or operating data and/or market information regarding business and assets of the Company and its subsidiaries (collectively, the “Information”). Certain
financial information may not have been audited, reviewed or verified by any independent accounting firm

THIS PRESENTATION AND ANY RELATED ORAL DISCUSSION DO NOT CONSTITUTE AN OFFER TO THE PUBLIC OR AN INVITATION TO SUBSCRIBE FOR, PURCHASE OR OTHERWISE ACQUIRE ANY FINANCIAL PRODUCTS, AS
DEFINED UNDER ARTICLE 1, PARAGRAPH 1, LETTER (T) OF LEGISLATIVE DECREE NO. 58 OF 24 FEBRUARY 1998, AS AMENDED. Therefore, this document is not an advertisement and in no way constitutes a proposal to
execute a contract, an offer or invitation to purchase, subscribe or sell for any securities and neither it or any part of it shall form the basis of or be relied upon in connection with any contract or commitment or
investments decision whatsoever. The Companies have not prepared and will not prepare any prospectus or offering circular for the purpose of the initial public offering of securities. Any decision to purchase,
subscribe or sell for securities will have to be made independently of this Presentation. Therefore, nothing in this Presentation shall create any binding obligation or liability on the Companies and any of their
advisors or representatives.

Likewise, this Presentation is not for distribution in, nor does it constitute an offer of securities for sale in the United States of America, Canada, Australia, Japan or any jurisdiction where such distribution is unlawful,
(as such term is defined in Regulation S under the United States Securities Act of 1933, as amended (the “Securities Act”). Neither this Presentation nor any copy of it may be taken or transmitted into the United
States of America, its territories or possessions, or distributed, directly or indirectly, in the United States of America, its territories or possessions or to any US person. Any failure to comply with this restriction may
constitute a violation of United States securities laws.

No representation or warranty, express or implied, is or will be given by the Companies and/or by any subsidiaries as to the accuracy, completeness or fairness of any Information provided and, so far as is permitted
by law and except in the case of fraud by the party concerned, no responsibility or liability whatsoever is accepted for the accuracy or sufficiency thereof or for errors, omissions or misstatements, negligent or
otherwise, relating thereto. In particular, but without limitation, no representation or warranty, express or implied, is or will be given as to the achievement or reasonableness of, and no reliance may be placed for
any purpose on the accuracy or completeness of, any estimates, targets, projections or forecasts and nothing in these materials should be relied upon as a promise or representation as to the future.

The information and opinions contained in this document are provided as at the date hereof and are subject to change without notice. The recipient will be solely responsible for conducting its own assessment of the
information set out in the Presentation. Neither the Company, its subsidiaries,, nor any of their advisors or representatives shall be obliged to furnish or to update any information or to notify or to correct any
inaccuracies in any information. Neither the Company, its subsidiaries,, nor any of their advisors or representatives shall have any liability to the recipient or to any of its representatives as a result of the use of or
reliance upon the information contained in this document.

Certain Information may contain forward-looking statements which involve risks and uncertainties and are subject to change. In some cases, these forward-looking statements can be identified by the use of words
such as “believe”, “anticipate”, “estimate”, “target”, “potential”, “expect”, “intend”, “predict”, “project”, “could”, “should”, “may”, “will”, “plan”, “aim”, “seek” and similar expressions. The forecasts and forward-
looking statements included in this document are necessarily based upon a number of assumptions and estimates that are inherently subject to significant business, operational, economic and competitive
uncertainties and contingencies as well as assumptions with respect to future business decisions that are subject to change. By their nature, forward-looking statements involve known and unknown risks and
uncertainties, because they relate to events, and depend on circumstances, that may or may not occur in the future. Furthermore, actual results may differ materially from those contained in any forward-looking
statement due to a number of significant risks and future events which are outside of the Companies’ control and cannot be estimated in advance, such as the future economic environment and the actions of
competitors and others involved on the market. These forward-looking statements speak only as at the date of this Presentation. The Companies cautions you that forward looking-statements are not guarantees of
future performance and that its actual financial position, business strategy, plans and objectives of management for future operations may differ materially from those made in or suggested by the forward-looking
statements contained in this Presentation. In addition, even if the Companies’ financial position, business strategy, plans and objectives of management for future operations are consistent with the forward-looking
statements contained in this Presentation, those results or developments may not be indicative of results or developments in future periods. The Companies expressly disclaims any obligation or undertaking to
disseminate any updates or revisions to any forward-looking statements contained herein to reflect any change in the Companies’ expectations with regard thereto or any change in events, conditions or
circumstances on which any such statement is based.

By accepting this Presentation, you acknowledge and agree to be bound by the foregoing terms, conditions, limitations and restrictions.

31
You can also read