An evaluation of the CME CF Ether-Dollar Reference Rate as a benchmark for regulated financial products - February 2021 - Evolve ETFs
←
→
Page content transcription
If your browser does not render page correctly, please read the page content below
An evaluation of the CME CF Ether-Dollar
Reference Rate as a benchmark for
regulated financial products

February 2021

                                           0
Abstract
This study provides evidence that the CME CF Ether-Dollar Reference Rate (CME CF ETHUSD_RR),
a UK and EU-regulated benchmark price of Ether, is replicable at volumes that are likely to be
transacted by institutional financial market participants. When simulating a daily purchase of 500
Ether over 366 days at the CME CF ETHUSD_RR, transaction volumes averaged 12.94% of
weekday Constituent Exchange volume, with a standard deviation of 7.97%. Evidence of the
benchmark’s market integrity is also presented. The highest average percentage effect on CME
CF ETHUSD_RR when excluding contributions from individual Constituent Exchanges was 0.017%.
This demonstrates that the CME CF ETHUSD_RR was not subject to manipulation via Constituent
Exchange price manipulation. A pair-wise correlation analysis of CME CF ETHUSD_RR Constituent
Exchanges showed a clustering of coefficients towards 1.00, indicating the absence of
manipulation within individual Constituent Exchanges. Average transaction volume at the
benchmark price during a daily one-hour transaction window over 366 trading days amounted
to 0.00005% of Ether free float volume per day. Quantitative analyses support the replicability of
purchasing 500 Ether at the same price as the CME CF Ether-Dollar Reference Rate within the
volume limits indicated.
1Introduction
At the time of writing in February 2021, Ether remains the second largest cryptocurrency by
market value after Bitcoin. Just like the price of Bitcoin, the price of Ether rose rapidly in late 2020
and early 2021 amid an intensification of public interest in digital assets. Investors were seeking
alternatives to assets that were expected to decline in value in real terms in the wake of
loosening fiscal and monetary policy aimed at remediating the effects of the coronavirus
pandemic. However, with free-float capitalisations of Bitcoin and Ether estimated by CF
Benchmarks in January 2021 to be around $440 billion and $123.175 billion respectively, their
aggregate market value continued to dwarf the combined value of several lower-tier digital
assets. Their preeminent market values helped to explain, anecdotally at least, why demonstrable
interest from institutional market participants in the digital asset class was observed to be at its
strongest in relation to Bitcoin and Ether than for other digital assets. Yet both of these major
assets present considerable barriers to entry in terms of active participation by financial
institutions. Chiefly, for firms looking to create and manage financial products, there are doubts
over price discovery, market integrity and the perception that a lack of capital markets
regulations being applied to cryptocurrency trading venues implies risks inherent to the process
of participation that are too material to tolerate.
This paper proposes a framework through which regulated financial product providers can
overcome these risks by utilising the CME CF Ether-Dollar Reference Rate (CME CF ETHUSD_RR)
as the settlement, valuation and performance benchmark for financial products that will hold
Ether or offer financial exposure to Ether.
This paper will first outline the various risks that a product issuer might be subject to, then
describe in detail how they are mitigated through the use of the CME CF ETHUSD_RR. The paper
will then describe a practical application of the CME CF ETHUSD_RR by demonstrating that the
slippage that is likely to be incurred relative to the CME CF ETHUSD_RR when trading Ether at
scale would be low. The qualities of the CME CF ETHUSD_RR and tracking error analysis outlined
herein will thereby demonstrate how to deploy the CME CF ETHUSD_RR as the benchmark or
reference value for Ether-related financial products in a way that keeps those risks to a
satisfactory minimum.
2Ether emerges from Bitcoin’s shadow
Bitcoin vs. Ether: a condensed overview
According to CF Benchmarks’ monthly supply assessment of leading cryptocurrency assets for
January 2021, Bitcoin’s free float market capitalisation was approximately $440bn near the end of
that month.1 Ether’s free float market capitalisation was assessed at approximately $123.175bn.
The two most valuable crypto markets thereby maintained the respective ranks they had
occupied since the Ethereum blockchain went live in July 2015. This primary and secondary
status respectively, in terms of Bitcoin’s and Ether’s market value, reflects one of several factors
that play a role in defining the extent of institutional demand for Ether as an investment asset.
• Bitcoin’s ‘first-mover’ advantage - Bitcoin’s implementation in 2009 preceded
Ethereum’s proposal by programmer Vitalik Buterin by around four years, initiating a
developmental interval between the two assets that has had long-lasting consequences.
As the oldest cryptocurrency, it follows that Bitcoin enjoys a ‘first mover’ advantage to an
extent that is pertinent to Ether’s perceived development relative to Bitcoin. In turn, such
perceptions probably shape Ether’s perceived investability and consequently, its market
value.
• Guiding principles - Although the Bitcoin and Ethereum projects share several
fundamental characteristics including, peer-to-peer functionality, transactional
messaging, decentralization and incentivization, their related assets are underpinned by
different guiding principles, and it is the guiding principles that appear to have a more
significant impact on their notional investment cases than the fundamental
characteristics. Summarized very approximately, the essential differences in their guiding
principles are that Bitcoin was intended as digital, decentralized and permissionless
money, whilst Ethereum was intended to be a decentralized, permissionless ‘world
computer’2.
• Investment theses - It is quite cogent to assume that the ideological frameworks from
which Bitcoin and Ether emerged3,4 and that continue to permeate their functional focus,
play a role in determining the scope of their investment theses. It is also credible to
expect Bitcoin and Ether to be furnished with more than one major investment case each.
Nevertheless, anecdotally, Bitcoin has frequently been characterized as a form of ‘digital
gold’ that is a ‘store of value’ just like the precious metal of gold as a physical asset is
held to store value. Therefore, whilst cases for Bitcoin and Ether may veer quite closely to
classic patterns of asset accumulation in anticipation of value appreciation, Ether’s
investment case also implies a greater admixture of expected value that may be
attributable to future innovations and use cases through technological advancement. This
paper is not the place to explore such themes in detail, though in the authors’ view, it was
important to highlight the distinction outlined above, because the difference is likely to
continue helping to shape Ether’s investment case, and in turn institutional demand for
Ether instruments and products.
3Crypto adoption lifts prices
Deepening corporate and institutional engagement in cryptocurrency ownership, custody and
investment coincided with the rapid elevation of prices of Bitcoin and Ether in the second half of
2020. On 14th February 2021, the CME CF Bitcoin Reference Rate, published by regulated
benchmark administrator CF Benchmarks, logged a record price of $48,606.98. At the time of
writing, it was the latest among numerous price records of recent months and compared with
the Bitcoin Reference Rate price on 2nd October 2020 of $10,529.71, at that time, a one-month
low. The CME CF Ether Dollar Reference Rate reached its own cycle peak on 13th February 2021
of $1,819.01. Ether’s U.S. dollar price had appreciated more than six-fold since recording a
notable trough at the beginning of October 2020, together with Bitcoin. These remarkable price
movements followed in the wake of significant milestones for the top two crypto assets on the
path towards mass-market adoption in 2020. The milestones included PayPal becoming the first
major consumer payments platform to offer individuals the ability to transact with
cryptocurrencies, large U.S. corporations announcing significant Bitcoin investments and
Wyoming regulators awarding licenses to two firms associated with cryptocurrencies that
enabled them to become Special Purpose Depository Institutions, essentially the first federally
chartered crypto banks.5,6
Institutionalization begins
Professionalisation of the Ether market anecdotally lagged that of the Bitcoin market in 2020. For
example, Ether’s secondary position in that respect was demonstrated by the lower amount of
announcements and instigations of Ether investment products from large institutions compared
with those of Bitcoin investment products. Nevertheless, the Ether investment market still
showed unmistakeable signs of moving beyond its innovation phase and of becoming more
anchored in traditional institutional use cases. Examples include Grayscale Ethereum Trust
becoming an SEC Reporting Company7 and the CME Group launching cash-settled Ethereum
futures on 8th February 2021, using the CME CF Ether Dollar Reference Rate as the settlement
index.8
Grayscale Ethereum Trust
Grayscale Ethereum Trust9 (GET) is an OTC traded, closed-ended fund, shares of which reflect the
value of ETH held by the trust, less expenses and other liabilities. GET’s holdings are weighted
100% to ETH. Under the Alternative Reporting Standard for companies, it is not required to
register with the Securities and Exchange Commission (SEC), and like all such products, it can
only be marketed to accredited investors. This class of participants includes corporate
institutions undertaking investments on their own behalf and on behalf of third parties. The
existence of Grayscale Ethereum Trust in itself helps underline the growing institutional appetite
for exposure to Ether.
4CME Ether Futures launched
CME Group, the largest derivatives marketplace in the world by volume of contracts traded,
announced in December 2020 that it would launch trading of Ether futures contracts in February
2021. The Ether contracts10 are formulated much like the exchange’s first cryptocurrency product,
CME Bitcoin Futures. Like CME Bitcoin Futures, CME’s Ether Futures are cash-settled to an
independent reference rate. For Ether, that will be the CME CF Ether-Dollar Reference Rate, a UK-
authorised benchmark index provided and administered by CF Benchmarks. (The UK regulatory
regime has equivalence with the EU regime post-Brexit). Trading hours of the exchange’s Ether
contracts will be similar to those of most other CME futures, although The Last Day of Trading
for expiring Ether contracts will be 4pm London time. That is the same contract termination
arrangement as for CME Bitcoin Futures. It is clear that CME Ether Futures specifications were
designed to closely align with established futures contracts utilised by financial and industrial
participants to manage risk or gain exposure to the U.S. dollar price of Ether. Note that the CME
is regulated by the U.S. Commodity Futures Trading Commission (CFTC) and that the CME CF
Ether-Dollar Reference Rate is a Registered Benchmark authorised under UK Benchmark
Regulation, with active oversight by the UK FCA, whilst deemed equivalent by EU regulation.
Therefore, the CME’s Ether Futures are the only fully regulated Ether derivative available to U.S.
investors, just as CME Bitcoin Futures are the only fully regulated derivative of that asset for U.S.
investors.
CME Bitcoin open interest bodes well for Ether
CME Bitcoin Futures provide a further corollary of institutional demand for CME Ether Futures. In
mid-February 2021, open interest of CME Bitcoin Futures contracts stood at $2.81bn, the second
highest compared to open interest volumes at 11 other large Bitcoin futures exchanges,
according to data compiled by analytics provider skewAnalytics. CME Futures open interest
volumes were recorded at $784m in October 202011. Assuming a modicum of the demand seen
for CME Bitcoin Futures, the exchange’s Ether counterpart may see similar growth. Likewise, a
tendency for institutional market participants to keep Bitcoin Futures positions open for longer
on regulated exchanges – including the CME - than on unregulated ones12, was also suggestive
of market share growth for the CME’s Ether contract once launched.
In summary, the launch of CME Ether Futures and their initial reception - over $30m of contracts
were traded on their first full day of trading compared to $4.7m on the first day of CME Bitcoin
contracts trading in October 2017 - is another indication of demand for institutional participation
in the Ether market.
5An Ether market with integrity
Having presented satisfactory indications that an institutional investment market for Ether exists,
the next important consideration is how such a market can be delivered to institutional
participants in a manner that is compliant and commercially satisfactory. As detailed in the paper
‘An analysis of the suitability of the CME CF BRR for the creation of regulated financial products’13
published in December 2020, cryptocurrency exchanges and price instruments are more variable
in the degree to which they adhere to principles of market and price integrity and in the extent
of their compliance with capital markets regulations, compared with venues and prices for more
established asset classes. Consequently, regulated financial entities that are obliged to transact in
instruments and at venues demonstrating unequivocal adherence to securities regulations are
faced with an unsatisfactory set of choices if they intend to purchase Ether at scale. They can
either stand aside from the Ether market entirely or shoulder an unacceptable increase in market
and regulatory risk by participating in Ether markets where integrity has not been established.
Contributing to the resolution of this dilemma is the principal aim of this publication. In a
manner that is analogous with the methodology by which institutional market participants can
purchase Bitcoin at scale, as exemplified in the paper on the BRR referenced above, the current
publication will propose a framework by which institutional investors can purchase Ether at scale
in a manner that is compliant and commercially satisfactory.
More specifically, this paper will first detail the CME CF Ether-Dollar Reference Rate (CME CF
ETHUSD_RR), a transparent, regulated Ether benchmark. Next, evidence of the representativeness
of the CME CF ETHUSD_RR of the verifiable Ether market will be presented. Subsequently,
measures pursued to ensure that the CME CF ETHUSD_RR is possessed of price integrity and, in
particular, is free of manipulation of any kind, will be described. Finally, the replicability of the
ETHUSD_RR’s benchmark prices will be demonstrated in terms of the achievability of CME CF
ETHUSD_RR prices when purchasing Ether ‘at scale’ at any time of the trading day.
6Representation
CME CF Ether-Dollar Reference Rate
The CME CF Ether-Dollar Reference Rate is a once-a-day benchmark index price for Ether
denominated in U.S. dollars. Input data is obtained from major cryptocurrency exchanges that
conform to the CME CF Constituent Exchange Criteria. Calculated every day since its launch on
14th May 2018, the CME CF ETHUSD_RR is a highly trusted source of Ether pricing and the pre-
eminent price benchmark for Ether risk settlement, being a Registered Benchmark under the
European Union’s Benchmark Regulation regime. The CME CF ETHUSD_RR has become the
settlement index for Ether futures contracts listed by CME Group and has been the settlement
index for Ether-U.S. dollar futures traded on the Crypto Facilities MTF since 2018.
Calculation Methodology
The CME CF ETHUSD_RR calculation methodology aggregates transactions of Ether in U.S.
dollars conducted only on the most liquid markets for which data is publicly available, operated
only by exchanges that meet the CME CF Constituent Exchange Criteria. Constituent Exchanges
at the time of writing were Bitstamp, Coinbase, Gemini, itBit and Kraken. Information about
changes to the composition of this list are available at the following URL:
https://www.cfbenchmarks.com/docs/CME+CF+Constituent+Exchanges.pdf
The full methodology is also available:
www.cfbenchmarks.com/docs/CME+CF+Constituent+Exchanges+Criteria.pdf
The methodology can be summarised thus:
• Transactions conducted on Constituent Exchanges are observed during a one-hour
window from 15.00 to 16.00 London Time
• The one-hour window is divided into 12 partitions of equal length (five minutes each)
• For each partition, a volume-weighted median (VWM) is calculated
The index value is expressed as the arithmetic mean of the 12 VWMs calculated in the previous
step.
7Suitability of 16.00 London Time as CME CF Ether-Dollar Reference Rate
calculation time
The graph in Figure 1 illustrates the rationale of calculating the CME CF Ether-Dollar Reference
Rate at 16.00 London Time. For the data set illustrated, Ether-U.S. dollar transaction volumes on
Constituent Exchanges were measured over an observation period of 1st January 2020 to 31st
December 2020.
Figure 1
Ether can be traded at any time of the day. But the trading data graphed above suggests that
Ether market participation volume adheres closely to times when traditional markets tend to
experience their own highest trading volumes.
The most liquid time of the day for Constituent Exchange volumes, together with the typical 4pm
traditional market closing time of several large European cities, pointed to an optimal time of
15.00 to 16.00 London Time to measure transactions for an Ether risk settlement benchmark.
8The question of volume sufficiency
For the CME CF ETHUSD_RR to be deemed a valid benchmark, the volume observed in its
calculation must be sufficient for that purpose. From a practical perspective, the CME CF
ETHUSD_RR needs to have sufficient volume in its calculation in order to be replicable by
institutional market participants and institutional product and service providers. These
prerequisites are addressed by data presented in Tables 1 and 2 below.
The tables describe the volume of transactions per day during the observation period in both
Ether and U.S. dollar terms. The parameters provided are range, median and average
transactions per day. It is important to note that the CME CF ETHUSD_RR is calculated every day
of the year, including public holidays, due to the market trading 24 hours a day, 365 days a year.
The data summaries below include all CME CF ETHUSD_RR calculations from throughout the
observation period.
Table 1
Metrics
Trades Volumes (ETH) Volumes ($)
MIN 373.00 1,175.79 187,879.48
MAX 27,468.00 128,251.70 56,474,645.71
MEAN 4,134.77 18,305.82 5,829,964.62
MEDIAN 3,030.50 12,897.09 3,519,200.68
Note that on average 18,305.82 Ether were traded over an average of about 4,134 transactions,
worth an average $5,829,964.62 during the one-hour observation window of 15.00 to 16.00
London Time. (Prices were contemporaneous with when the trades were observed. As such, the
data are free of distortions from asset price inflation.) Although this appears to qualify as
significant volume prima facie, the average transaction volume needs to be regarded in context
of the Ether market’s free-float market capitalisation of about $123.175 billion towards the end
of January 2021. The average sum transacted was equivalent to less than 0.00005% of Ether free
float volume. On the other hand, in the cryptocurrency market, determining the size of a typical
intended institutional transaction, and then the scope of an order that an institutional market
participant would generally undertake, is problematic. This is partly due to the dearth of research
covering institutional crypto transaction volumes. In turn, that paucity is a consequence of the
emergent nature of the market. Parallels with institutional behaviour patterns in traditional
markets, enabling extrapolation to crypto, may be possible. However, any such conceptual
connections will be tenuous in lieu of definitive research.
A 2013 analysis of institutional equity transaction sizes, citing data compiled by post-trade
analytics firm Ancerno14, may be pertinent. It noted that average order sizes were nearly three
times the average transaction size in a sample of 847 unique institutional investors. The average
daily position change was nearly double the average order size. Incidentally, the average
9transaction size in the analysis was $151,216 (5,359 shares). The researchers concluded that
position changes were largely achieved by means of multiple orders and that orders were
typically executed with multiple transactions. This coheres with widely observed institutional
transaction patterns in many asset classes.
Current research permits only limited conclusions
Without extensive research it is difficult to determine conclusively whether such patterns are also
present in institutional cryptocurrency transactions. For now, the data presented in the current
publication provide a guide as to the minimum hypothesized size of institutional Ether
transactions that can replicate the CME CF ETHUSD_RR price. Furthermore, in view of the
expectation that cryptocurrency orders at institutional scale will—like those in other asset
classes—be completed through multiple transactions, data presented here are also suggestive of
the minimum transaction size at which the CME CF ETHUSD_RR remains replicable. The authors
propose that the analysis in this publication represents a useful increment to a conclusive model
for replicating CME CF ETHUSD_RR at institutional scale. Nevertheless, the authors also concede
that design flaws of the research reported in this publication may have limited the scope of
conclusions relating to replicability possible from the dataset presented.
10Integrity
This section will address the extent of market integrity of the CME CF Ether-Dollar Reference
Rate in the specific sense of securities regulations. The practical imperative is that a benchmark
requires integrity because it will be used for asset valuation and settling financial risk.
Specifically, the benchmark must be free of manipulation. Furthermore, it must be administered
and calculated in a manner that deters and impedes manipulation.
The methodological design underlying the CME CF ETHUSD_RR and its system of administration
incorporate measures that promote integrity as outlined in the sub-sections below.
Data integrity by data selection
CF Benchmarks exclusively sources input data from Constituent Exchanges that meet published
criteria as set out in its Constituent Exchanges Criteria. The criteria are available at this link:
https://www.cfbenchmarks.com/docs/CF+Constituent+Exchanges+Criteria.pdf
Particular attention is drawn to the following statement from the Constituent Exchanges Criteria
document (part 3 of Section 5, page 4: ‘Eligibility Criteria’):
“The venue has published policies to ensure fair and transparent market conditions at all times and
has processes in place to identify and impede illegal, unfair or manipulative trading practices.”
CF Benchmarks ascertains the presence of fair and transparent market conditions and processes
to identify and impede illegal, unfair or manipulative practices by conducting a thorough review
of any exchange under consideration for inclusion as a Constituent Exchange. The arrangements
of all Constituent Exchanges are reviewed annually to ensure that they continue to meet all criteria.
This due diligence is documented, and the information is distributed to CF Benchmarks’ oversight
committees and provided to its regulator, the UK Financial Conduct Authority (FCA).
Manipulation resistance by design
Resistance to manipulation is a priority aim of the design methodology underlying the CME CF
Ether-Dollar Reference Rate. The methodology takes an observation period and divides it into
equal partitions of time. The volume-weighted median of all transactions within each partition is
then calculated. The benchmark index value is determined from the arithmetic mean of the
volume-weighted medians, equally weighted. The benefits of this process with respect to
achieving manipulation resistance are outlined below.
• Use of partitions
Individual trades of large size have limited effect on the Index level as they only influence the
level of the volume-weighted median for that specific partition
11A cluster of trades in a short period of time will also only influence the volume-weighted median
of the partition or partitions they were conducted in
• Use of volume-weighted medians
Use of volume-weighted medians as opposed to volume-weighted means ensures that
transactions conducted at outlying prices do not have an undue effect on the value of a specific
partition
• Equal weighting of partitions
By not volume weighting partitions, trades of large size or clusters of trades over a short period
of time will not have an undue influence on the index level
• Equal weighting of constituent exchanges
CF Benchmarks applies equal weight to transactions observed from constituent platforms. With
no pre-set weights, potential manipulators cannot target one platform for the conduct of
manipulative trades
• Use of arithmetic mean of partitions
Using the arithmetic mean of partitions of equal weight further denudes the effect of trades of
large size at prices that deviate from the prevailing price having undue influence on the
benchmark level
Manipulation resistance by exclusion of input data
A specific procedure for dealing with potentially erroneous data is incorporated into the
methodology of the CME CF ETHUSD_RR. Although volume-weighted medians of transaction
prices from individual data sources are not a part of the benchmark determination process, they
are calculated as a means of quality control and manipulation resistance.
In the event of an instance of index calculation in which a Constituent Exchange’s volume-
weighted median transaction price exhibits an absolute percentage deviation from the volume-
weighted median price of other Constituent Exchange transactions greater than the potentially
erroneous data parameter (10%), then transactions from that Constituent Exchange are deemed
potentially erroneous and excluded from the index calculation. (Since the inception of the CME
CF Ether-Dollar Reference Rate in May 2018, its potentially erroneous data parameter has never
been triggered.) Any instances of data excluded from a calculation will trigger a Benchmark
Surveillance Alert that is investigated.
12An analysis of the volume-weighted median per exchange during the observation period of the
research reported in this publication produced the results in Table 3. The results illustrate that
during the observation period, no Constituent Exchange’s input data needed to be excluded due
to exhibiting potential manipulation.
Table 1
Metric Absolute VWM Deviation %
Bitstamp Coinbase Gemini ItBit Kraken
MIN 0.00 0.00 0.00 0.00 0.00
MAX 2.21 -1.23 -1.61 4.06 -1.57
MEAN 0.11 0.07 0.11 0.18 0.10
MEDIAN 0.05 0.03 0.06 0.08 0.05
Benchmark Surveillance
Although a series of measures have been undertaken to mitigate the risk of benchmark
manipulation, CF Benchmarks remains vigilant against attempted benchmark manipulation and
monitors input data continuously. To that end, CF Benchmarks has implemented a benchmark
surveillance programme for the investigation of alerts. Instances of suspected benchmark
manipulation are escalated through appropriate regulatory channels in accordance with CF
Benchmarks’ obligations under European Union Benchmark Regulation (EU BMR). Regarding
benchmark manipulation, Article 14 of the EU BMR, Reporting of Infringements, states:
1. An administrator shall establish adequate systems and effective controls to ensure the
integrity of input data in order to be able to identify and report to the competent authority any
conduct that may involve manipulation or attempted manipulation of a benchmark, under
Regulation (EU) No 596/2014.
2. An administrator shall monitor input data and contributors in order to be able to notify the
competent authority and provide all relevant information where the administrator suspects that, in
relation to a benchmark, any conduct has taken place that may involve manipulation or attempted
manipulation of the benchmark, under Regulation (EU) No 596/2014, including collusion to do so.”
As a Regulated Benchmark Administrator, CF Benchmarks is subject to supervision by the UK
FCA. This supervision ensures CF Benchmarks is in compliance with all aspects of EU BMR
requirements.
Furthermore, CF Benchmarks’ Control Procedures with respect to compliance with the EU BMR
have been audited by ‘Big Four’ accountancy firm Deloitte. The Independent Assurance Report
13on Control Procedures Noted by CF Benchmarks Regarding Compliance with EU Benchmark
Regulation as of 31 July 2020 is available at the following link:
www.cfbenchmarks.com/docs/Deloitte_CF+Benchmarks+SOC1+Audit+Report.pdf
This further verification of CF Benchmarks’ compliance with EU BMR places the CME CF Bitcoin
Reference Rate on the same level of scrutiny applied to widely used traditional financial
benchmarks like ICESWAP, SONIA and ICE LIBOR.
Assessing CME ETHUSD_RR values and input data for signs of manipulation
The CME CF ETHUSD_RR was designed and is administered to the highest standards, including
efforts to uphold provisions of EU BMR. Nevertheless, further analysis of the benchmark price
data has been undertaken to better ensure the instrument’s integrity.
Were there to be a lack of integrity in the input data that could in turn affect the integrity of the
benchmark, one would expect to see one of a number of phenomena reflected in the input data
provided by Constituent Exchanges. One potential example would be significant price
dislocations between Constituent Exchanges.
What happens when an exchange is removed from the calculation?
• The CME CF Ether-Dollar Reference Rate methodology aggregates trades observed on
Constituent Exchanges during a one-hour observation period between 15.00 and 16.00
London Time
• One means of detecting dislocations in price between different Constituent Exchanges is
to recompute the CME CF ETHUSD_RR calculation without the participation of one of the
exchanges and to repeat this process for each of the exchanges in turn. This process
gives a strong indication of how closely the exchanges track each other in terms of price
per unit of volume transacted
• In the period analysed – 1st January 2020 to 31st December 2020 – absolute impacts
exhibited when each exchange was removed from the index calculation versus index
values are summarised in Table 4 below
14Table 2
Metric Absolute Diff W/O Exchange
Bitstamp Coinbase Gemini ItBit Kraken
MIN 0 0 0 0 0
MAX 0.32 0.33 0.12 0.2 0.21
MEAN 0.021 0.048 0.009 0.005 0.029
MEDIAN 0.01 0.04 0.01 0 0.02
• As well as the absolute impact of removing individual exchanges from the index
calculation, the proportionate impact on the CME CF ETHUSD_RR from the same exercise
in the same period can also be shown, as in Table 5 below
Table 3
Metric Percentage Diff W/O Exchange
Bitstamp Coinbase Gemini ItBit Kraken
MIN 0.000% 0.000% 0.000% 0.000% 0.000%
MAX 0.063% 0.086% 0.052% 0.039% 0.077%
MEAN 0.007% 0.017% 0.003% 0.001% 0.010%
MEDIAN 0.005% 0.012% 0.002% 0.000% 0.006%
It is clear that Constituent Exchanges exhibit very similar price action to each other when
analysed through the lens of the CME CF ETHUSD_RR methodology. This in turn demonstrates
that the CME CF ETHUSD_RR has not been subject to manipulation through manipulation of
prices on individual Constituent Exchanges.
Even so, examination of relationships between Constituent Exchange price characteristics can be
taken a step further. The pair-wise correlation between each Constituent Exchange can also be
scrutinised. This may reveal indications of potential manipulation within CME CF ETHUSD_RR
Constituent Exchange prices that may be occurring on a subtler or smaller scale than would be
captured by the potentially erroneous data parameter and by which the CME CF ETHUSD_RR
index value itself is not impacted due to its aggregating heuristic.
15How well corelated are Constituent Exchange prices?
An analysis was undertaken of the pair-wise correlation of prices from Constituent Exchanges on
a per-minute basis (the price difference between transactions for each minute at each exchange)
during the observation period. The results of this analysis are shown in Table 6.
Table 4
Pair-Wise Correlation of Constituent Exchanges to the ETHUSD_RR
Constituent Pair Platform Mean Correlation % Median Correlation % Standard Deviation
Bitstamp - Coinbase 93.79% 96.55% 7.68%
Bitstamp – Gemini 89.82% 93.62% 10.76%
Bitstamp – ItBit 72.92% 84.32% 30.89%
Bitstamp – Kraken 92.69% 95.65% 8.70%
Coinbase – Gemini 91.10% 94.56% 10.14%
Coinbase – ItBit 73.43% 85.29% 31.02%
Coinbase – Kraken 94.95% 96.99% 6.08%
Gemini – ItBit 74.82% 85.43% 30.00%
Gemini - Kraken 91.88% 94.89% 9.11%
ItBit - Kraken 75.50% 86.56% 29.50%
The clustering towards correlation coefficients of 1.00 demonstrate strong price correlation
between the Constituent Exchanges.
16Replicability and Implementation
The final characteristic of the CME CF Ether-Dollar Reference Rate that this paper will examine
with respect to its merits as a benchmark price is its replicability. In other words, that the CME CF
ETHUSD_RR benchmark price can be transacted in practice on any given day.
How to purchase 500 Ether each day at the CME CF ETHUSD_RR price
To begin demonstrating the replicability—or to use another term, the achievability—of the
strategy presented in this paper for purchasing Ether ‘at scale’, observations taken whilst
modelling the purchase of a notional large amount of Ether are presented below. The purchase
of 500 Ether was simulated on each day between 1st January and 31st December 2020, an
observation period of 366 days. It was decided that the purchase of 500 Ether was an adequate
scale to represent a large Ether trade of the kind that institutional traders might need to
undertake for a major client, or that an issuer of a financial product (such as an ETF or a
derivative) would be required to execute, in order to facilitate trading of that product. A simple
replication simulation was thereby conducted to exemplify the extent of slippage that
implementation of the CME CF ETHUSD_RR would probably encounter.
It is worth noting that in the ‘real world’, institutions deploy algorithmic systems to execute
large-scale asset purchases. It is probable that conducting the exercise presented here by means
of algorithmic systems would have produced outcomes more favourable than those described in
this paper. For research purposes, a simplified simulation methodology was favoured.
Simulation Methodology
• Trades are executed on n (5) Constituent Exchanges, during a 3,600-second calculation
window
• One trade is executed every second and the price achieved is assumed to be the last
execution price observed in that second. Its associated volume is assumed to be the
volume executed during that second
• If no trade is completed in any single-second period, then the price achieved is assumed
to be the price achieved in the previous second, but the associated volume from the
previous second is not added to the volume executed in the latest second
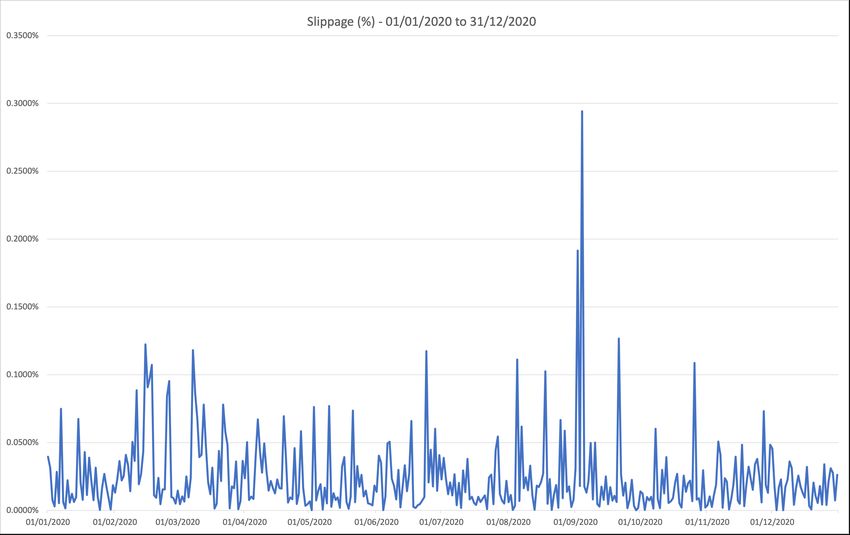
17The results of this exercise are displayed in Figure 3. The data are summarised in Table 7.
Figure 2
Table 5
Slippage %
MAX 0.2943%
MIN 0.0000%
MEDIAN 0.0167%
MEAN 0.0243%
STANDARD DEVIATION 0.000288719
18The need to restrict information leakage
Information leakage can often exacerbate slippage during ‘real world’ transactions. In order to
measure the level of slippage that would probably occur when transacting 500 Ether as per our
simulation, an estimate of the market impact of a trade of 500 Ether within a 3,600-second
calculation window of our simulation was required.
Table 8 below contains maximum, minimum, median, arithmetical mean and spread (standard
deviation) represented by the purchase of 500 Ether during the observation period as
percentages of total CME CF ETHUSD_RR volume.
Table 6
Daily CME CF ETHUSD_RR volume represented by 500 Ether (%)
Metric All Days Weekdays Only
Maximum 104.29% 50.40%
Minimum 1.66% 1.66%
Median 12.40% 11.41%
Mean 16.32% 12.94%
Standard Deviation 13.30% 7.97%
Conclusion
Considering the profile of CME CF ETHUSD_RR trading volumes suggested by Figure 1, it is clear
that the liquidity of the Ether market peaks at times that cohere with traditional market trading
times. It is therefore reasonable to suggest that weekdays are more pertinent for the exercise of
purchasing Ether ‘at scale’, as working days are the likeliest times that institutional participants
would seek to do so. On that basis, the salient data in the exercise presented here are the
maximum and average weekday CME CF ETHUSD_RR Constituent Exchange volumes that would
be represented by the purchase of 500 Ether during the observation period, together with the
standard deviation of the percentage of volumes represented over the observation period.
The maximum volume of the CME CF ETHUSD_RR that would have occurred during weekdays
was 50.40%. The average weekday volume over the observation period was 12.94%. The spread
between all weekday volumes observed was 7.97%. These figures indicate reasonable ease to
achieve (or replicate) the CME CF ETHUSD_RR, albeit with the provisos relating to replicable
volume noted under the section above titled ‘The question of volume sufficiency.’
Table 9 presents the rate at which some discrete percentages of CME CF ETHUSD_RR volume
occurred during the observation period. As stated above, weekday volumes are the most salient.
On that basis, a 0.38% rate of occurrence of 50% of the weekday volume traded on CME CF
Ether-Dollar Reference Rate Constituent Exchanges when purchasing 500 Ether, demonstrates a
low proportion of days when that purchase represented a relatively high market volume.
19In turn, it is indicated that purchasing 500 Ether when it was a relatively low proportionate
volume of a verified market occurred frequently, whilst it was only possible to make such
purchases when they were a relatively large proportion of that market very infrequently.
Combined, the readings from Tables 8 and 9 support the replicability of purchasing 500 Ether at
the same price as the CME CF Ether-Dollar Reference Rate within the volume limits indicated.
Furthermore, the readings support the position that purchases of the stated amount of Ether by
deployment of the strategy outlined in this paper will reduce to a minimum the kind of slippage
that can be caused by third-party participants being alerted to such trades. The analysis
presented here assumes that trading is confined to the Constituent Exchanges and is not
executed on other venues such as those in the OTC market.
If the OTC market were to be taken into account, it is likely that the measured price impact of
attempts to replicate the CME CF ETHUSD_RR would be lower than that described in this paper.
Table 7
Days on which 500 Ether exceeded 10%, 25%, 50% of CME CF ETHUSD_RR volume
Percentage All Days Weekdays Only
10% 62.13% 56.65%
25% 15.26% 6.46%
50% 2.72% 0.38%
20References
1 Basket Working Model (unpublished, available on request), CF Benchmarks Ltd., January 2021
(CF Benchmarks Ltd., 2021)
2
Bitcoin, Ethereum or Crypto, Sound Money, October 2020 (Price, 2020)
3
Bitcoin: A Peer-to-Peer Electronic Cash System, Bitcoin.org, 2009 (Nakamoto, 2009)
4
Ethereum White Paper: A Next Generation Smart Contract & Decentralized Application Platform,
Ethereum.org, 2013 (Buterin, 2013)
5
The First Cryptocurrency Bank, National Law Review, (Boot & Laskowski, 2020)
6
Avanti Financial Joins Kraken as a Wyoming-Approved Crypto Bank, CoinDesk, October 2020
(DiCamillo, 2020)
7
Top 6 Things to Know About Grayscale Ethereum Trust Now That it’s an SEC Reporting Company,
Grayscale Investments, October 2020 (Grayscale Investments, 2020)
8
CME Group to Launch Ether Futures on February 8, 2021, CME Group, December 2020 (CME
Group Inc., 2020)
9
Grayscale Investor Deck January 2021, Grayscale, January 2021 (Grayscale Investments, 2021)
10
Defining Ether Risk Management, CME Group, December 2020 (CME Group Inc., 2020)
11
CME‘s Bitcoin growth is a low-key big splash, CF Benchmarks blog, October 2020 (Odeluga,
2020)
12
Institutional Investors Turn 'Hodlers' on Bitcoin Futures Markets, Zubr blog, September 2020
(Zubr, 2020)
13
An analysis of the suitability of the CME CF BRR for the creation of regulated financial products,
CF Benchmarks Ltd., December 2020 (CF Benchmarks, 2020)
14
Transaction Sizes and Institutional Investor Trading Patterns around Earnings Announcements,
Florida International University College of Business, (Cready, W., Kumas, A., and Subasi, M., 2013)
21You can also read