Investor Presentation - August 2021 Update

Page created by Jessie Perez
 
CONTINUE READING
Investor Presentation - August 2021 Update
Investor Presentation
August 2021 Update
Investor Presentation - August 2021 Update
Disclaimer
About this Presentation
This investor presentation (this “Presentation”) relates to a proposed business combination (the “Business Combination”) between Supernova Partners Acquisition Company, Inc. (“Supernova”) and OfferPad, Inc. (the “Company”). The information contained herein does not purport to be
all-inclusive and none of Supernova, the Company or their respective affiliates or representatives makes any representation or warranty, express or implied, as to the accuracy, completeness or reliability of the information contained in this Presentation.
This Presentation does not constitute (i) a solicitation of a proxy, consent or authorization with respect to any securities or in respect of the proposed Business Combination or (ii) an offer to sell, a solicitation of an offer to buy, or a recommendation to purchase any security of Supernova,
the Company, or any of their respective affiliates. No offering of securities shall be made except by means of a prospectus meeting the requirements of Section 10 of the Securities Act of 1933, as amended, or an exemption therefrom.

Forward-Looking Statements
Certain statements in this Presentation may be considered forward-looking statements. Forward-looking statements generally relate to future events or Supernova’s or the Company’s future financial or operating performance. For example, statements regarding the Company’s outlook
for the third quarter and full year 2021, and projections of, the Company’s future financial results and other metrics and ownership of the combined company following the Business Combination, anticipated growth in demand for the Company’s services, anticipated growth in the
industry in which the Company operates and the anticipated timing of the proposed Business Combination are forward-looking statements. In some cases, you can identify forward-looking statements by terminology such as “pro forma,” “may,” “should,” “could,” “might,” “plan,”
“possible,” “project,” “strive,” “budget,” “forecast,” “expect,” “intend,” “will,” “estimate,” “anticipate,” “believe,” “predict,” “potential” or “continue,” or the negatives of these terms or variations of them or similar terminology. Such forward-looking statements are subject to risks,
uncertainties, and other factors which could cause actual results to differ materially from those expressed or implied by such forward-looking statements.
These forward-looking statements are based upon estimates and assumptions that, while considered reasonable by Supernova and its management, and the Company and its management, as the case may be, are inherently uncertain. Factors that may cause actual results to differ
materially from current expectations include, but are not limited to: the occurrence of any event, change or other circumstances that could give rise to the termination of definitive agreements with respect to the Business Combination; the outcome of any legal proceedings that may be
instituted against Supernova, the Company, the combined company or others following the announcement of the Business Combination and any definitive agreements with respect thereto; the inability to complete the Business Combination due to the failure to obtain approval of the
stockholders of Supernova or to satisfy other conditions to closing; changes to the proposed structure of the Business Combination that may be required or appropriate as a result of applicable laws or regulations or as a condition to obtaining regulatory approval of the Business
Combination; the ability to meet stock exchange listing standards following the consummation of the Business Combination; the risk that the Business Combination disrupts current plans and operations of the Company as a result of the announcement and consummation of the Business
Combination; the ability to recognize the anticipated benefits of the Business Combination, which may be affected by, among other things, competition, the ability of the combined company to grow and manage growth profitably, maintain relationships with customers and suppliers and
retain its management and key employees; costs related to the Business Combination; changes in applicable laws or regulations; the ability to respond to general economic conditions; the health of the U.S. residential real estate industry; the ability to grow market share in existing
markets or any new markets; the impact of the COVID-19 pandemic; the ability to manage growth effectively; the ability to accurately value and manage inventory, and to maintain an adequate and desirable supply of inventory; the ability to successfully launch new product and service
offerings, and to manage, develop and refine the technology platform; and other risks and uncertainties set forth in the sections entitled “Risk Factors” and “Cautionary Note Regarding Forward-Looking Statements” in the registration statement on Form S-4 and proxy
statement/prospectus discussed below and other documents filed by Supernova from time to time with the Securities and Exchange Commission (SEC).
Supernova and the Company caution that the foregoing list of factors is not exclusive. Nothing in this Presentation should be regarded as a representation by any person that the forward-looking statements set forth herein will be achieved or that any of the contemplated results of such
forward-looking statements will be achieved. You should not place undue reliance on forward-looking statements, which speak only as of the date they are made. Neither Supernova nor the Company undertakes any duty to update these forward-looking statements.

Financial Information; Non-GAAP Financial Measures
This Presentation also includes certain financial measures not presented in accordance with generally accepted accounting principles (“GAAP”) including, but not limited to, Contribution Margin, Adjusted EBITDA and certain ratios and other metrics derived therefrom. Contribution Margin
means net sale proceeds less holding and selling costs, plus other services. Adjusted EBITDA includes adjustments for amortization of share based compensation, impairments and other non-cash expense. These non-GAAP financial measures are not measures of financial performance in
accordance with GAAP and may exclude items that are significant in understanding and assessing the Company’s financial results. Therefore, these measures should not be considered in isolation or as an alternative to net income, cash flows from operations or other measures of
profitability, liquidity or performance under GAAP. You should be aware that the Company’s presentation of these measures may not be comparable to similarly-titled measures used by other companies. Supernova and the Company believe these non-GAAP measures of financial results
provide useful information to management and investors regarding certain financial and business trends relating to the Company’s financial condition and results of operations. Supernova and the Company believe that the use of these non-GAAP financial measures provides an additional
tool for investors to use in evaluating ongoing operating results and trends in and in comparing the Company’s financial measures with other similar companies, many of which present similar non-GAAP financial measures to investors. These non-GAAP financial measures are subject to
inherent limitations as they reflect the exercise of judgments by management about which expense and income are excluded or included in determining these non-GAAP financial measures.
This Presentation also includes certain projections of non-GAAP financial measures. Due to the high variability and difficulty in making accurate forecasts and projections of some of the information excluded from these projected measures, together with some of the excluded information
not being ascertainable or accessible, Supernova and the Company are unable to quantify certain amounts that would be required to be included in the most directly comparable GAAP financial measures without unreasonable effort. Consequently, no disclosure of estimated comparable
GAAP measures is included and no reconciliation of the forward-looking non-GAAP financial measures is included.

                                                                                                                                                                                                                                                                                                          1
Investor Presentation - August 2021 Update
Disclaimer (cont’d)
Use of Projections
This Presentation contains financial forecasts for the Company with respect to certain financial results for the Company. Neither Supernova’s nor Company's independent auditors have audited, studied, reviewed, compiled or performed any procedures with respect to the projections for
the purpose of their inclusion in this Presentation, and accordingly, they did not express an opinion or provide any other form of assurance with respect thereto for the purpose of this Presentation. These projections are forward-looking statements and should not be relied upon as being
necessarily indicative of future results. In this Presentation, certain of the above-mentioned projected information has been provided for purposes of providing comparisons with historical data. The assumptions and estimates underlying the prospective financial information are
inherently uncertain and are subject to a wide variety of significant business, economic and competitive risks and uncertainties that could cause actual results to differ materially from those contained in the prospective financial information. Accordingly, there can be no assurance that
the prospective results are indicative of the future performance of the Company or that actual results will not differ materially from those presented in the prospective financial information. Inclusion of the prospective financial information in this Presentation should not be regarded as a
representation by any person that the results contained in the prospective financial information will be achieved.

Industry and Market Data
In this Presentation, Supernova and the Company rely on and refer to certain information and statistics obtained from third-party sources which they believe to be reliable. Neither Supernova nor the Company has independently verified the accuracy or completeness of any such third-
party information.

Trademarks
This Presentation may contain trademarks, service marks, trade names and copyrights of other companies, which are the property of their respective owners. Solely for convenience, some of the trademarks, service marks, trade names and copyrights referred to in this Presentation may
be listed without the TM, SM © or ® symbols, but Supernova and the Company will assert, to the fullest extent under applicable law, the rights of the applicable owners, if any, to these trademarks, service marks, trade names and copyrights.

Additional Information
Supernova has filed a registration statement on Form S-4 with the Securities and Exchange Commission (the “SEC”), which includes a proxy statement/prospectus, that is both the proxy statement that was distributed to holders of Supernova’s common stock in connection with its
solicitation of proxies for the vote by Supernova’s stockholders with respect to the proposed Business Combination and other matters as described in the registration statement, as well as the prospectus relating to the offer and sale of the securities to be issued in the Business
Combination. Supernova has mailed the definitive proxy statement/prospectus and other relevant documents to its stockholders. This Presentation does not contain all the information that should be considered concerning the proposed Business Combination and is not intended to form
the basis of any investment decision or any other decision in respect of the Business Combination. Supernova’s stockholders and other interested persons are advised to read the definitive proxy statement/prospectus and other documents filed in connection with the proposed Business
Combination, as these materials will contain important information about the Company, Supernova and the Business Combination. Stockholders are also able to obtain copies of the definitive proxy statement and other documents filed with the SEC, without charge, at the SEC’s website
at www.sec.gov, or by directing a request to Supernova’s secretary at 4301 50th Street NW, Suite 300 PMB 1044, Washington, D.C. 20016, (202) 918-7050.

Participants in the Solicitation
Supernova and its directors and executive officers may be deemed participants in the solicitation of proxies from Supernova’s stockholders with respect to the proposed Business Combination. A list of the names of those directors and executive officers and a description of their interests
in connection with the proposed Business Combination is contained in Supernova’s registration statement on Form S-4, which is available free of charge at the SEC’s website at www.sec.gov. To the extent such holdings of Supernova’s securities may have changed since that time, such
changes have been or will be reflected on Statements of Change in Ownership on Form 4 filed with the SEC.

The Company and its directors and executive officers may also be deemed to be participants in the solicitation of proxies from the stockholders of Supernova in connection with the proposed Business Combination. A list of the names of those directors and executive officers and
information regarding their interests in the proposed Business Combination is contained in Supernova’s registration statement on Form S-4, which is available free of charge at the SEC’s website at www.sec.gov.

                                                                                                                                                                                                                                                                                                       2
Investor Presentation - August 2021 Update
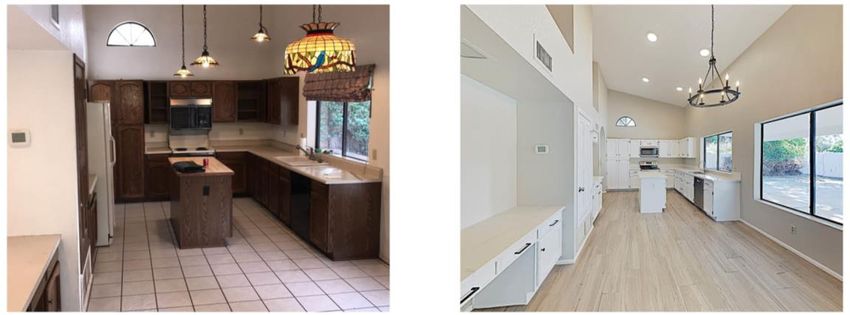
Our mission is to provide the best
way to buy and sell a home. Period.

                                      3
Investor Presentation - August 2021 Update
Online penetration in real estate is nascent compared to
other industries but following a similar trajectory

                          ~$350B1                                                                  $210B2
                     Prescription meds                                                            Car buying
                     opportunity today                                                         opportunity today                                                                     $1.9T
                                                                                                                                                                                    Real Estate
                               ~6%
                              Digital
                                                                                                             ~1%
                                                                                                            Digital
                                                                                                                                                                                 opportunity today
                            penetration5                                                                  penetration6
                                                                                                                                                                                    99% analog
     $600B3                                                ~$650B4                                                                     $1.3T2
    Restaurant                                         Grocery delivery                                                           Insurance buying
 opportunity today                                     opportunity today                                                          opportunity today                                      ~1%
                                                                                                                                                                                        Digital
                                                                                                                                                                                      penetration
         ~5%                                                           ~10%
Investor Presentation - August 2021 Update
Offerpad – A Perfect Match For Supernova
Supernova’s Acquisition Criteria             Offerpad Meets All Of Supernova’s Acquisition Criteria

                                                   Large and growing TAM ripe for disruption
 1      Large addressable market
                                                   $850 billion Offerpad “Buy Box” immediate opportunity

                                                   Offerpad is a leading iBuyer platform with a highly efficient business model
 2      Robust business model
                                                   Proprietary tech platform + hybrid local market experts

                                                   Significant capital efficiency at similar revenue levels compared to Zillow and Opendoor
 3      Competitive differentiation
                                                   Achieved more with less capital

                                                   Attractive financial profile, growth, and unit economics
 4      Attractive growth profile
                                                   $1.7 - $1.85 billion 2021E revenue, 67% YoY growth at the midpoint

                                                   World-class management with deep industry expertise
 5      Proven management team
                                                   Led by Brian Bair, Founder & CEO, supported by exceptional senior management team

        Fundamental value with significant         Compelling valuation & ability to enhance value through partnership with Supernova
 6      upside                                     Deliver synergies through leveraging broad network and proven operational expertise

                                                                                                                                              5
Investor Presentation - August 2021 Update
Partnering with Offerpad to create meaningful
shareholder value
   Full commitment of Supernova team, working hand in hand with board of directors and management, to
                    create the leading next-generation real estate technology platform

                    Internally                                                 Externally

    Assist in attracting the best talent through our            Become the most well known, well respected real
    broad and deep network                                      estate technology brand

    Support Offerpad’s high class profile with our              Effectively positioning the company’s story for a
    operating expertise                                         successful public debut

    Assemble a top tier public company Board                    Supplementing value creation through our
    consistent with Offerpad’s caliber                          experience with inorganic growth

    Leverage our network to drive diversity across the          Leverage our networks for expert
    organization and position the company for                   assistance
    tremendous success

                                                                                                                    6
Investor Presentation - August 2021 Update
We are transforming the largest asset class: real estate
         Market opportunity                                                                                                                   Highly fragmented market

                $1.9T                                                                                                                                              1.4M
          Annual residential                                                                                                                               Agents per NAR
           real estate sales                                                                                                                                membership3

                $950B
              “Buy Box”                                                                                                                                            107K
         opportunity over time1                                                                                                               U.S. real estate brokerages3

                 $850B
Investor Presentation - August 2021 Update
Our differentiated approach

                           Selling services                                                                                       Buying services

Competitive cash      No showings or       Pick your              Free                                          Self-tour         Bundle           Closing cost          Early access to
offer in 24 hours      open houses        closing day         local move*                                   Offerpad homes       and Save           incentives          Offerpad homes

                            Sell to Offerpad                                                                                       Buy with Offerpad
       Cash offer within 24hrs, no showings, choose your closing date                                             Customizable buying process, access to local experts and guided
                                                                                                                             support, and flexible closing solutions.

                    Free list-ready home services
      Personalized listing service including free maintenance, renovation
                      advances, and concierge coordinator

                                                                            Additional ancillary services

                             Moving                                         Remodel             Energy             Smart                                           Home
       Title                                       Mortgage                                                                            Insurance
                             services                                       services           efficiency          home                                           warranty

                                                                                       Today     Future
                                                                                                                                                                                           8
Investor Presentation - August 2021 Update
A simple, tech-enabled solution for our customers

       Request a cash Offer
 3-minute request form and offer will
        be delivered within 24 hours

  Search Offerpad & Non-
  Offerpad Homes Online
Research all homes on the market as
well as Offerpad coming soon homes

  Access Vacant Offerpad
   Homes via Mobile App
   Visit Offerpad homes on your own
time in a safe, socially distant manner

      Complete Inspection,
          Virtual Closings
      Utilize virtual tools to complete
             closing process if desired

                                                    9
Our customers are our best reference

        95%                                                                               81                   9 out of 10
  Customer Satisfaction                                  Net Promoter Score (NPS) 1                          Recommend to a Friend 1
        Rating 1

             (1) YTD 2021 Survey of approx. 1,400 respondents of customers who sold their home to Offerpad

                                                                                                                                       10
Operational expertise that maximizes value
Best-in-Class Renovations                  Renovation Time Efficiencies                                  Helix GO Field Automation
                                          23.3
Workforce optimization
Internal / external workforce mix

                                           2.0                                           16.4
                                                           15.1
                                                                      13.2
Local project managers
Offerpad employees who oversee each
renovation from start to finish                             1.2
                                                                        1.0                1.0

Project standardization                                                                                   Labor and material tracking
Market-by-market, to ensure quality,                                                                      Work-order dispatch & management
cost and time efficiency                  Q1 ‘18           Q1 ‘19      Q1 ‘20             Q1 ‘21
                                                                                                          Live inspections / progress reporting
                                             Average Days in Reno   Average Renovation Days / $k Spent

                    16K+ renovations completed since inception, $15K average renovation during 2020

                                                                                                                                                   11
Renovation before and after
              Tempe, AZ: $62k Renovation, $81k Contribution Margin/Home
     BEFORE              AFTER                       BEFORE               AFTER

     BEFORE              AFTER                       BEFORE               AFTER

                                                                                  12
Offerpad by the numbers

 ~1,000 Cities and towns                                            ~$8.7B Transactions to date2                                                                      95% customer satisfaction3
 17 Markets1                                                        $1.7-$1.85B Revenue in                                                                            81 Net promote score (NPS)3
                                                                           2021E
 ~16,000                                                                                                                                                               9 out of 10 recommend
  Renovations to date                                                      Positive contribution margins                                                                     to a friend 3
                                                                           per home since 2016

                   (1) 1 of the 17 Markets launched in July 2021 (2) Homes acquired and homes sold as of Q2’21; (3) YTD 2021 Survey of approx. 1,400 respondents of customers who sold their home to Offerpad
                                                                                                                                                                                                                13
We have achieved rapid growth and scale
                                                                                             21
  Total markets at year end                                                                                         Homes acquired

                                                                                             19                                                      4,998                          6,455
                                                                          14
                                                      12                                                                                     3,848
                                    10                                                                                                                              3,519
                    8
                                                                                                                                     1,999
       5
                                                                                                                       583

     2016         2017            2018               2019               2020               2021E                      2016           2017    2018    2019           2020 1          2021E

                                                                                            $1.7
                                                                                                                                                                                    5,612
  Total revenue ($B)                                                                         to                     Homes sold
                                      +92%                                                                                                                                            to
                                                                                           $1.85
                                      CAGR2                                                                                                                                         6,000
                                                                         $1.1               $1.4                                                     4,680
                                                      $1.1                                                                                                                          5,612
                                                                                                                                                                    4,281
                                   $0.9                                                                                                      3,666

                                                                                                                                     1,351
                   $0.3
      $0.1                                                                                                             265
                                                                                1                                                                                          1
      2016         2017           2018               2019                2020              2021E                      2016           2017    2018    2019           2020            2021E

                                       Significant scale with
Highly attractive unit economics
TTM as of Q2’21 contribution margin per home after interest

         $35K                $(2K)
                              0.6%                $(9K)

                                                   3.3%
                                                                      $25K
                                                                                               $23K                   $1K             $24K

         12.8%

                                                                      9.0%                                                            8.6%
                                                                                               8.2%

    Net sale proceeds      Holding costs        Selling costs   Contribution margin   Contribution margin after   Other services       Total
                                                                                                                                     Total CM
       Net sale                                                                            Contribution
                            Holding               Selling         Contribution                interest                Other        contribution
       proceeds                                                                            margin after
                             costs                 costs            margin                                           services      margin after
                                                                                            interest
                                                                                                                                     interest

                                                 Express

                                                                                                                                                  15
Q2’21 Financial and Operational Highlights
  Revenue                                      $379M                                              +32%
                                                                                                       YoY

                                                                                                 +340%
                                                                                                                                            Key Q2’21 Milestones
  Homes acquired                                  2,025                                                YoY
                                                                                                                                      •   Announced planned expansion into 4
                                                                                                   +22%                                   additional markets, bringing anticipated
  Homes sold                                      1,259                                 avg. revenue per home
                                                                                               sold YoY                                   end of year market count target up to 21

                                                                                                +16.6M                                •   Launched Offerpad bundled reward
  Net Income                                    $9.2M                                                  YoY                                program, allowing customers to save by
                                                                                                                                          utilizing multiple Express, Flex, and
  Adj. EBITDA                                 $13.1M                                            +16.8M                                    Mortgage services
                                                                                                       YoY

  Contribution Profit after                                                                      +30.1K
  Interest per Hold Sold                       $31.5K                                                  YoY

                    Note: YoY represents an annual comparison against the comparable period in the prior year (eg Q2’21 vs. Q2’20).
                                                                                                                                                                                     16
2021 guidance

  Homes sold        5,612 – 6,000

                                     “We’re thrilled with the record number of acquisitions and the
                                      extraordinary contribution margin we achieved in the second
  Revenue           $1.7 – 1.85B            quarter. At Offerpad, we celebrate the wins, such as our
                                            performance this quarter, while also staying focused on
                                     keeping our business model adaptable. For the balance of the
  Gross profit      $170 – 180M                year, we expect continued growth and high customer
                                    satisfaction levels as we further our mission to provide the best
                                                       way to buy and sell a home” – Brian Bair, CEO

  Adjusted EBITDA   ($15) – (6)M

                                                                                                        17
Improving KPIs Post-COVID-19
   Revenue ($M)                                                         Homes Acquired & Homes Sold
                                                                                                                     Acquired       Sold
   $368                                                 $379
                                                                                                                                2,025
              $287                         $284
                                                                          1,517
                                 $223                                                                                           1,259
                        $186                                                         1,166                           1,196
                                                                                                             1,032
                                                                          1,258                  749
                                                                                                                      1,018
                                                                                                              849
                                                                                                 769
                                                                                      460
   Q1'20      Q2'20     Q3'20    Q4'20     Q1'21        Q2'21             Q1'20      Q2'20      Q3'20        Q4'20   Q1'21      Q2'21

   Net Income (Loss) & Adj. EBITDA ($M)    Net Income      Adj EBITDA   Contribution Profit after Interest
                                           (Loss)                       Per Home Sold ($K)
                                                        $13.1
                                                                                                                                $31.5
                                            $3.0
                                  $1.5                  $9.2                                                          $23.1
                        $(0.8)                                                                               $20.7
               $(3.7)                                                                            $15.4
    $(5.2)
                                  $(1.3)   $(0.2)
                        $(2.9)
                                                                            $5.1
               $(7.4)                                                                  $1.4
    $(11.5)
    Q1'20     Q2'20     Q3'20    Q4'20     Q1'21        Q2'21              Q1'20      Q2'20      Q3'20       Q4'20   Q1'21      Q2'21

                                                                                                                                           18
Our traction has been accelerating in top markets
Market share in top 10 markets
(as % of total home transactions in each market)
2.0%

                                                                                                                                     >5x market share improvement
                                                                                                                                     in our fastest growing market
1.5%
                                                                                                                                     over the last year1

1.0%

                                                                                                                                     >3.5x average market share
0.5%                                                                                                                                 improvement in our top 10
                                                                                                                                     markets over the last year1
0.0%
         Q2'20       Q3'20                     Q4'20                       Q1'21                        Q2'21

                       Source: Based on internal transaction data and market level information from third party aggregator sources
                       (1) Calculation excludes markets with market share
Market level contribution continues to expand
Contribution Margin After Interest1                                                                                                                                                                  LTM as of 6/30/2021
                                                                                                                                                                                                     Full Year 2020

       10%
                  9%                  9%                  9%                  9%                  9%                  8%                                                                                              9%
                                                                                                                                          8%                  8%
                                                                                                                                                                                  6%
                                                                                                                                                                                                      6%

                                                                                                                                           6%
                                      5%                  5%                                      5%
                   4%
                                                                                                                       3%                                                                                             4%
        3%                                                                                                                                                                         3%

                                                                             (0%)                                                                            (1%)
                                                                                                                                                                                                      (2%)

      Market A   Market B          Market C            Market D            Market E            Market F            Market G            Market H             Market I            Market J           Market K    Company-wide

                            (1) Represents markets with a minimum of 50 homes sold in 2020; contribution margins (“CMs”) are not additive; bars reflect, respectively, CM per market LTM 6/30/21 and FY 2020
                                                                                                                                                                                                                              20
Significant untapped growth potential
                                         2021E                                                                                                                               Future opportunity

                                                                                                    Each market adds
  Markets                                     211                                                   ~$0.5B3 in revenue                                                                           48

                                                                                                    Each % share adds
  Market-share                               ~1%                                                     ~$6B4 in revenue                                                                            4%

  Annual revenue /
                                   $1.7-$1.85B2                                                                       13x                                                                    $23B5
  run rate revenue

                                           Existing market                                                     Potential new markets 2021-2023                                                 Announced

             (1) 17 as of July’21 (2) Projected 2021 figures; (3) On average, reflects annual, run-rate revenue opportunity in 48 markets at 4% market share; based on 2019 median sales prices and number of transactions in markets; (4)
             On average, reflects annual, run-rate revenue based on all 48 markets with 2019 transaction data; (5) Reflects annual, run-rate revenue based on all 48 markets with 2019 transaction data
                                                                                                                                                                                                                                             21
We are in early innings in our growth story
                                                     3-4%
                                                 Market share
                                                 (~0.8% YTD
                                                                                                                                   A   Increase penetration
                                                    2021)

                                                                                        $8
                 Contribution
                 margin uplift                                                      billion+1
                 opportunity                                                           Run-rate
                                                                                       revenue
                                                                                                                                   B   Grow new markets
                                                                                                                          48
   Strong                                                                                                              Markets
  Attach rates                                                                                                         by 2023
                                              Looking ahead                                                           (17 today)
                                                                                        $23
                    1:2+
                                                                                      billion2
                                                                                                                                   C   Flex offering
                 Express / Flex
                 long-term mix                                                       Broader run-
                                                                                     rate revenue

                                                     ~50%
                                                  Gross margin                                                                     D   Ancillary services

                   (1) Assumes 4% market share in 14 markets as of 2020 year end; (2) Assumes 4% market share in 48 markets

                                                                                                                                                              22
Founder-led & experienced team across real estate and tech
       Brian Bair                  Mike Burnett                Steve Johnson
       Founder & Chief Executive   Chief Financial Officer     Chief Operating Officer
       Officer

       Ben Aronovitch              Vaughn Bair                 Casey Bair
       Chief Legal Officer         Chief Real Estate Officer   Chief Acquisition Officer

                                                                Heather Baily
       Darrin Shamo                Gint Grabauskas
                                                                Chief Human
       Chief Marketing Officer     Chief Technology Officer     Resources Officer

       Dan Mayes                   Jaidip Singh                 David Connelly
       Chief of Tactical Real      Chief Data &                 Chief Growth
       Estate Operations           Analytics Officer            Officer

                                                                                           23
Transaction overview
Overview of Supernova Partners Acquisition Company
Deep industry expertise and strong sponsorship                               Delivering on Supernova’s acquisition criteria
• Supernova Partners Acquisition Company, Inc. ("Supernova"), a publicly
                                                                             Large addressable market
  traded company (NYSE: SPNV) raised $402.5 million at IPO in October 2020
• Diverse management team and board with deep sector expertise and
  decades of operational, investment and acquisition experience              Attractive growth profile

         Spencer Rascoff                                                     Proven management team
         Co-Chair
                                                                             Competitive differentiation
         Alexander Klabin
         Co-Chair                                                            Robust business model

         Robert Reid                                                         Ability to scale
         CEO
                                                                             Transparent and strong corporate culture
         Michael Clifton
         CFO                                                                 Fundamental value with significant upside

                     Affiliates of Supernova are committed to this transaction by personally investing $50M of capital

                                                                                                                              25
Transaction summary
($ Millions)

 Transaction highlights                                                                                                                         Pro forma valuation
 • Pro Forma Enterprise Value of $2.4B based on 1.0x 2022E Revenue of $2.4B                                                                      Pro Forma Valuation Calculation
 • Existing Offerpad equity holders will roll 100% of their equity and will own 67% of the
                                                                                                                                                 Offerpad Illustrative Share Price                                                                            $10.00
   pro forma company                                                                                                                                                               3
                                                                                                                                                 Pro Forma Shares Outstanding (M)                                                                                300
 • Founder Brian Bair will receive high vote stock for approximately 34% of the voting
   power of the pro forma company1                                                                                                               Equity Value                                                                                             $    3,003
 • Affiliates of Supernova are committed to this transaction by personally committing                                                            (Less) Cash                                                                                                     635
   $50M of capital                                                                                                                               Enterprise Value                                                                                         $    2,368
 Sources of funds
 Sources                                                                                                                                         TEV / 2022E Revenue                                                         $     2,417           1.0x
                                                                                                                                                 TEV / 2023E Revenue                                                         $     3,943           0.6x
 Cash Held in Trust¹                                                                                                        403
 Issuance of Shares                                                                                                       2,250
 Supernova FPA                                                                                                               50                 Pro forma ownership % @ $10.00 / share4
 Proceeds from PIPE                                                                                                         200
 Cash on Balance Sheet                                                                                                      106                 1.5% FPA
 Total                                                                                                          $         3,008
                                                                                                                                                3.0% Supernova Sponsor
 Uses of funds                                                                                                                                  5.9% PIPE investors
 Uses
                                                                                                                                                11.9% Public equity holders
 Offerpad Equityholder Stock Consideration                                                                                2,250
 Secondary Proceeds                                                                                                           -                 11.0% Equity Incentive Plan + ESPP5
 Est. Transaction Fees & Expenses²                                                                                           60
 Cash to Balance Sheet                                                                                                      635
 Debt paydown                                                                                                                63                                                                                                              66.7%
                                                                                                                                                                                                                                           Offerpad equity
 Total                                                                                                          $         3,008                                                                                                                holders
                                 (1) Assumes no shareholder redemption; (2) Transaction expenses are estimates; (3) Total shares includes 225 million shares, 40 million SPNV public shares, 20 million shares from PIPE, 10
                                 million SPNV founder shares and 5 million Supernova FPA shares. Assumes no shareholder redemption and does not include impact of dilution from warrants; (4) Shares subject to vesting are
                                 included in the ownership percentages presented; (5) No grants have been made under the incentive plan or ESPP
                                 Note: 20% of Sponsor promote subject to vesting; Vests in full if, at any time during the 5 year period post-closing, the VWAP of pubco shares is greater than or equal to $12/share for any 20                                       26
                                 trading days within a 30 consecutive trading day window; Also vests in full upon a change of control of the pubco; If and when the shares vest, they are entitled to receive back dividends
Valuation highlights
     Large and growing iBuying opportunity with penetration rates estimated to grow 30%+ CAGR1 over the next decade
     $850 billion Offerpad “Buy Box” immediate opportunity
     Penetration rates expected to continue to increase from current ~1%

     Offerpad is a leading iBuyer platform with a highly efficient business model
     Proprietary tech platform + hybrid local market experts allows for efficient operations of logistically complex model
     Proven expansion strategy in target markets

     Attractive financial profile, growth, and unit economics
     $1.7 - $1.85 billion 2021E revenue, 67% YoY growth at the midpoint
     Posted quarterly net profit Q2 2021

     Disciplined, high-ROI operating approach that is best-in-class among peers
     Achieved significant scale with
We are closely tracking to Carvana’s proven execution
                                                                                                                        : Actual 2020, management projections as of 03/18/21                  : 2021E guidance midpoint

                                                                                                                                                                               $5.6
                                                                                                                         $3.9                                                                    $3.9
                                                                                                                                             $2.4
  Revenue ($B)                          $0.9            $1.0
                                                                                     $2.0              $1.8
                                                                                                        $1.4
                                        2017     2018   2020                         2018      2019    2021E             2019      2020     2022E                              2020 2021E 2023E

                                                                                    128%
                                                                                                                         102%
                                                                                                       67%                                   73%                                                 63%
 Revenue growth                                                                                                                                                                41%
                                                                                                        32%
                                        2017     2017   2020                        2018       2018    2021E             2019      2019 2022E                                  2020    2020    2023E

                                                                                                                                                                               14.8%
  Gross profit                                          8.2%                        10.1%              10.1%
                                                                                                                        12.9%
                                                                                                                                             8.7%                                                8.9%
                                        7.9%
    margin
                                                                                                        8.4%
                                        2017     2017   2020                        2018       2018    2021E             2019      2019 2022E                                  2020    2020    2023E

                                                                                                                                                                                                         Current
                                 $400
                                                                                                                                                                                                           $358.15
                                 $300                                                          2018                              2019
  Carvana stock                                                                                                                                                                                           3,127%
                     Price ($)

  performance                    $200                                                          118%                             514%
                                                                                                                                                                               2020
   (since IPO)                   $100
                                        $11.10                                                                                                                             1,497%
                                  $0
                                   Apr-17           Sep-17       Mar-18            Aug-18             Jan-19   Jun-19      Nov-19             Apr-20            Sep-20            Feb-21            Jul-21

                  Source: Company filings and Management estimates; FactSet as of 08/12/2021
                                                                                                                                                                                                                          28
Capital-efficient model with high returns on investment
Illustrative ROI based on 2020 metrics

                         95 days
                      Time to cash
                                                                                                                                                                          15.3%
                                                                                                                                                              Annualized ROI for every $2

                                                                                                                                                                       vs. ~5% cost of debt3

                                                                                                                                                               91% Annualized ROI in Q2 2021
                            8.2%
                      Gross margin
                 vs. 7.5% industry average1

                                                                                                                                                                              92%
                                                                                                                                                                        Revenue CAGR4
                             $9K
                                                                                                                                                                              2016-2021E
            Contribution after interest per home

                 vs. $5K industry average1

                    Source: Company model, company filings
                    (1) Based on the average of Zillow Homes and Opendoor as of YE2020; (2) Calculated based of contribution profit after interest / (Total operating costs + Interest expense) annualized by time to cash; (3) Denotes Q2 2021
                    blended cost of debt for warehouse facilities and assumes a 1-month LIBOR of 0.1%; (4) Based on latest 2021 guidance                                                                                                          29
Attractive valuation entry point compared to peers
EV / 2021E revenue multiple

                                 Digital real estate platforms median1                                          Vehicle iBuyers median2

                                                         3.9x                                                                                                   19%
                                                                                         2.6x                                                               discount to Opendoor
                                                                                         Median
                                                                                                                               3.5x
                                                                                                                                                               2.6x
                                                                                                                                                               Median2

                                                                                                                                                                66%
                                                                             Opendoor: 1.6x
     1.3x3                                                                                                                                                  discount to Digital real
                                                                                                                                                               estate platforms

                                            Gross profit margin
                                                                                                                                                                62%
                                                                                                                                                             discount to Vehicle
      10%                          11%                 34%                 23%                                       7%                 16%                       iBuyers

                     Source: Company guidance, FactSet as of 08/12/21 and Wall Street research; % discounts based on EV / 2021E revenue comparison
                     (1) Includes Opendoor, Redfin and Zillow; (2) Includes Carvana and Vroom; (3) Based on $3.0B valuation and revised guidance midpoint                              30
Offerpad is poised to deliver attractive returns to investors
Illustrative calculations based on current management projections
                                                                                             Implied future value at                                                    Implied future value at Digital
                                                                                               Offerpad’s current                                                       Real Estate Platform’s 2022E
                                                                                             2022E Multiple of 1.0x                                                            multiple of 2.6x
                                                                                                                                                                                       Multiple Expansion
                                                                                                                                                                                                                 (2)
                                                                                                                                                                                                   $10.3B

                                                                                                  At Current Multiple

                                                                                                                                                          +182%
                   Valuation Today                                                                                                                         IRR(3)

                                                                                                                            (1)
                                                                                                                $3.9B
                                                                       +41%
                            $2.4B                                      IRR(3)

                           Aug-21                                                                              Dec-22                                                                              Dec-22
                   Source: FactSet (as of 8/12/2021) and Wall Street Research.
                   (1) Calculated based on Offerpad’s 2023E Revenue of $3.9B and Offerpad’s CY2022E revenue multiple of 1.0x; (2) Calculated based on Offerpad’s 2023E Revenue of $3.9B and median consensus CY202 revenue multiple of 2.6x among Digital Real
                   Estate Platform peer group; (3) IRR assumes entry investment on 8/1/2021                                                                                                                                                                      31
Appendix
Offerpad driving significant change in “sell-side” real estate
transactions

                                                                                             As long as 6 months or
                                   30+ days &        10+ showings                             more to buy or sell a
                    30+                                                     30-45
Traditional         days          $1,000s of list    30+ days on        days in escrow               home
                                    ready repairs        market                                Lacks transparency, multiple
                                                                                             counterparties, time-consuming,
                                                                                                   stressful, uncertain

                                 Prepare listing     Showing /
    vs.       Broker search
                                 & marketing        Open house
                                                                           Closing

                                                    Zero showings                             24 hrs for sellers to
                  24 hrs           Instant &         or open houses     Close in as little   receive certainty and
               to receive cash    zero list ready   under contract in      as 3 days
                    offer             repairs                                                 move on their own
                                                        24 hrs                                     schedule

                                                                                                                               33
Offerpad is the new way to buy a home

 See a home at your own schedule – not only
  when it works for the seller
 Get access to a home with your phone – no
  agent needed
 Use an agent or not at your own discretion
 Buy a home that has been refurbished by a
  skilled experienced team
 Offers can be submitted online

                                               34
Local expertise supercharges our proprietary technology
                                                                           Advantaged combination of machine evaluation & human review

                                                    Public
                  Proprietary
                                                    Record

                                        Private

                           Robust data sources

                                                                          Automated verification,               Real estate
   Offer                          Data                                                                                                          Offer
                                                                          valuation & renovation              expert review &
  request                       collection                                                                                                     delivered
                                                                                 modeling                   communications CRM
                  500+ data points per home                                      120K+                              10 min                       99%
                     from 14 sources
                                                                                                             Median time spent per asset
                                                                          Property valuations per year                review1              underwritten to actual
                                                                                                                                            sales price accuracy2
                                                                                                                     300+
                                                                                                                     Offers sent
                                                                                                              per underwriter per month
                                                                                    Knowledge Distillation and Feedback Loop

            (1) As of January 2021; (2) Based on homes acquired in 2019
                                                                                                                                                               35
Attractive conversion metrics with significant continued
upside
10-15k            17(1)                                99%
 Requests         Markets                   Acquisitions sourced
per month                                   via Offerpad Platform

     Attractive top of funnel acquisition
                                                                                                                                                         20+%                   $3K
                                                                                                                                                              Organic    Blended CAC of seller

                                                                                                                                                               77%
                                                                                                                                                  of sellers contacted         99%
             Limited competition                                                                                                                                 1           underwriting
                                                                                                                                                                               accuracy
                                                                                                                                                 agent before selling2

                                                                                                                                                                         Flex has potential to
               Strong conversion                                                                                                                                         increase conversion
                with significant                                                                                                                              3.6%          opportunity by
                    upside                                                                                                                        Gross request to
                                                                                                                                                  close conversion3            2-3x
                   (1) 1 of the 17 markets was launched in July’21; (2) Estimate per National Association of Realtors Data; (3) Figures as of December 2020
                                                                                                                                                                                                 36
While further improving cash conversion rates
 Time to sell distribution (months)                                                                                                                                                                                                     Average time to cash
                             ~89% of homes sold
                               in 10.0

                                                                               (1) Based on homes sold since inception

                                                                                                                                                                                                                                                                                    37
Our current and planned footprint
Market Strategy
 Geographic Diversification
                                                                                                                  $23B in run-rate revenue from future markets       1

 High Population Growth Cities
 Affordable Median Sales Price
 Increasing Employment Characteristics
 Single Family Rental Buyer Presence

                                                   19%
                              17%       18%

                       13%

                10%
                                                    17
        7%                               14
                               12
                        10
                 8
 3%                                                                      Expected new market expansion
         5
  2
                                                                         2021: ~7
                                                                         2022: ~10
 2015   2016    2017   2018   2019      2020     Current
                                                                         2023: ~20
             % of Total US Transactions
                                                                                                                                       Existing market   Potential new markets 2021-2023
             Covered by Active Markets
                                                                                                                                                         Announced
                              (1) Reflects annual, run-rate revenue based on 4% market share of 2019 transaction data for 48 markets

                                                                                                                                                                                           38
Ancillary services opportunities
Product Expansion Strategy
                                                                Title
 Today
 Core transaction services focused on
 maximizing organic conversion rate                Mortgage
                                                                            Energy
                                                                           efficiency

 Mid-Term                               Offerpad
                                          Flex                Ancillary
 Additional transaction services and                          services
 entry into home personalization
                                                    Home
                                                                          Smart home
                                                   warranty

 Long-Term
                                        Remodel
 Full home ownership partnership:                             Insurance
                                        services
 personal, efficient, hassle-free

                                                                                        39
Summary of our warehouse financing agreements
 Debt capitalization (as of Q2 ’21)                                                                      Loan to cost: Property debt / inventory
                                                                                                         7.5%               7.5%                   7.5%
                                                                      Capacity                   Drawn
                                                                                                                                                 96%                97%                   97% 3
 Senior secured facility 1 (Libor + 4.0%)                                   $225                 $160                       95%

                                                                                                                                                                           L+5.25%

 Senior secured facility 2 (Libor + 2.5%)                                    4001                 229      77%                                          L+3.50%                                   L+4.0%
                                                                                                                                                                           L+3.50%

                                                                                                                                                                                                 L+2.50%
 Mezzanine   (13.0%)2                                                            75                63

 Total                                                                      $700                 $452
                                                                                                           2016             2017                 2018               2019                  2020

                                                                                                             Loan to cost          Senior secured facility 1 rate          Senior secured facility 2 rate

                  Greater advance rates and improving terms have been accretive to free cash flow
                          (1)   Capacity of $250M as of Q2’21. Upsized to $400M in July’21
                          (2)   Reflects mezzanine portion from both facility 1 and facility 2
                          (3)   2020 Quarter End Average                                                                                                                                                    40
Non-GAAP Reconciliations
                                                                                                                                                     Three Months Ended
(in thousands, except percentages and homes sold, unaudited)                June 30, 2021                 March 31, 2021                  December 31, 2020       September 30, 2020                           June 30, 2020                   March 31, 2020
Gross profit                                                           $               50,864           $            33,537             $             25,254     $             19,766                     $               17,861           $              24,898
Gross margin                                                                            13.4%                         11.8%                             11.3%                   10.6%                                       6.2%                            6.8%
Homes sold                                                                              1,259                         1,018                               849                     749                                      1,166                           1,517
Gross profit per home sold                                                               40.4                          32.9                              29.7                    26.4                                       15.3                            16.4
Adjustments:
  Inventory impairment - current period                                                     177                             104                              144                               28                               311                          1,553
  Inventory impairment - prior period                                                        (95)                          (138)                              (46)                           (398)                           (1,696)                          (579)
  Interest expense capitalized                                                              767                             606                              396                              426                               920                          1,219
Adjusted gross profit                                                                    51,713                          34,109                           25,748                           19,822                           17,396                          27,091
Adjusted gross margin                                                                     13.7%                           12.0%                            11.5%                            10.6%                              6.1%                           7.4%
Adjustments:
  Direct selling costs                                                                    (8,787)                         (8,036)                          (5,981)                          (5,599)                         (8,853)                         (10,445)
  Holding costs on sales - current period                                                   (533)                           (461)                            (434)                            (489)                           (865)                           (1,261)
  Holding costs on sales - prior period                                                     (188)                           (193)                            (158)                            (424)                         (1,147)                           (1,033)
  Other income                                                                                 7                             241                               47                              289                             269                               230
Contribution profit                                                                      42,212                          25,661                           19,221                           13,599                            6,800                           14,581
Contribution margin                                                                       11.1%                             9.0%                             8.6%                             7.3%                            2.4%                              4.0%
Homes sold                                                                                 1,259                           1,018                              849                              749                           1,166                             1,517
Contribution profit per home sold                                                           33.5                            25.2                             22.6                             18.2                             5.8                               9.6
Adjustments:
  Interest expense capitalized                                                              (767)                           (606)                           (396)                            (426)                            (920)                          (1,219)
  Interest expense on homes sold - current period                                         (1,345)                         (1,117)                           (916)                            (742)                          (1,506)                          (2,565)
  Interest expense on homes sold - prior period                                             (386)                           (446)                           (336)                            (899)                          (2,697)                          (3,008)
Contribution profit after interest                                                       39,714                          23,491                           17,574                           11,533                            1,677                            7,789
Contribution margin after interest                                                        10.5%                             8.3%                            7.9%                             6.2%                             0.6%                             2.1%
Homes sold                                                                                 1,259                           1,018                             849                              749                            1,166                            1,517
Contribution profit after interest per home sold                                            31.5                            23.1                            20.7                             15.4                              1.4                              5.1

                                       Note: Current period represents adjustments for costs incurred on homes sold in the period presented and prior periods represents adjustments for costs incurred in prior periods on homes sold in the period presented.
                                                                                                                                                                                                                                                                        41
Non-GAAP Reconciliations, cont.

                                                                                                            Three Months Ended
(in thousands, except percentages, unaudited)       June 30, 2021         March 31, 2021         December 31, 2020       September 30, 2020          June 30, 2020            March 31, 2020
Net income (loss)                               $               9,190   $              (233)   $              (1,321)   $             (2,942)    $              (7,390)   $              (11,465)
  Interest expense                                              2,257                 1,918                    1,626                    1,312                     2,418                     4,674
  Amortization of capitalized interest                            767                   606                      396                      426                       920                     1,219
  Income tax expense                                               89                     0                      163                      -                         -                         -
  Depreciation and amortization                                   146                   130                      125                      104                       102                       102
  Amortization of stock-based compensation                        649                   613                      488                      337                       288                       249
Adjusted EBITDA                                                13,098                 3,034                    1,478                     (763)                  (3,662)                   (5,221)
Adjusted EBITDA margin                                           3.5%                  1.1%                     0.7%                   (0.4%)                    (1.3%)                    (1.4%)

                                                                                                                                                                                                    42
Thank you
You can also read