The AES Corporation Barclays CEO Energy-Power Conference - Andrés Gluski, President & CEO September 2, 2014
←
→
Page content transcription
If your browser does not render page correctly, please read the page content below
The AES Corporation
Barclays CEO Energy-
Power Conference

Andrés Gluski, President & CEO
September 2, 2014
Safe Harbor Disclosure

Certain statements in the following presentation regarding AES’ business operations may
constitute “forward-looking statements.” Such forward-looking statements include, but are
not limited to, those related to future earnings growth and financial and operating
performance. Forward-looking statements are not intended to be a guarantee of future
results, but instead constitute AES’ current expectations based on reasonable assumptions.
Forecasted financial information is based on certain material assumptions.           These
assumptions include, but are not limited to accurate projections of future interest rates,
commodity prices and foreign currency pricing, continued normal or better levels of
operating performance and electricity demand at our distribution companies and operational
performance at our generation businesses consistent with historical levels, as well as
achievements of planned productivity improvements and incremental growth from
investments at investment levels and rates of return consistent with prior experience. For
additional assumptions see Slide 42 and the Appendix to this presentation. Actual results
could differ materially from those projected in our forward-looking statements due to risks,
uncertainties and other factors. Important factors that could affect actual results are
discussed in AES’ filings with the Securities and Exchange Commission including but not
limited to the risks discussed under Item 1A “Risk Factors” and Item 7: Management’s
Discussion & Analysis in AES’ 2013 Annual Report on Form 10-K, as well as our other SEC
filings. AES undertakes no obligation to update or revise any forward-looking statements,
whether as a result of new information, future events or otherwise.

Contains Forward-Looking Statements                                                            2
Who We Are: A Diversified Power Generation and Distribution
Company
FY 2013 Adjusted PTC1: $1.8 Billion Before Corporate Charges of $0.6 Billion

                                                          Asia
Rest of World                                               8%
                                                                               US
    27%                                                                       24%
                                               EMEA3
                                                19%
                                                                                     Andes
                                                                                     19%
                                                      MCAC2                                  Americas
                                                       18%              Brazil                 73%
                                                                        12%

1.   A non-GAAP financial measure. See Appendix for definition and reconciliation.
2.   Mexico, Central America and Caribbean.
3.   Europe, Middle East and Africa.
Contains Forward-Looking Statements                                                                     3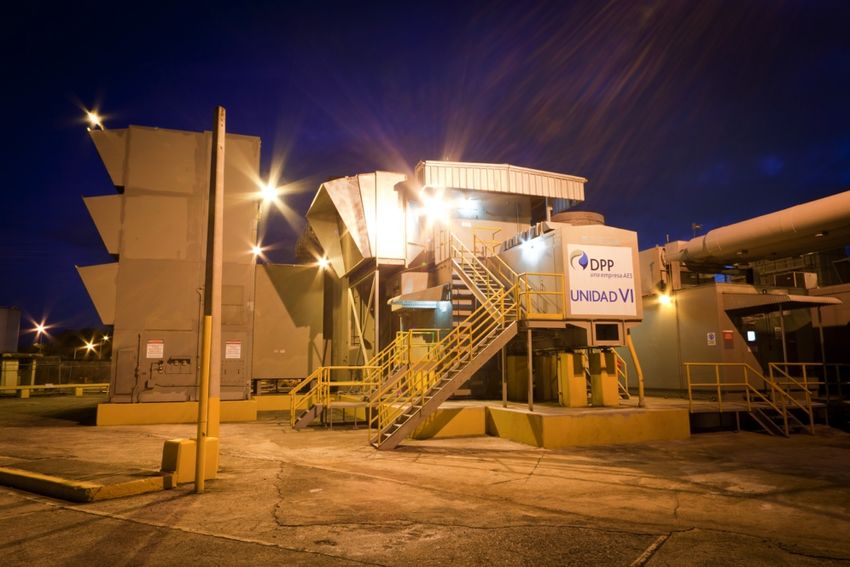
Executive Summary
l Accomplishments since September 2011:
8% average annual growth in Adjusted EPS1
13% average annual growth in Proportional Free Cash Flow1
Reduced Parent debt by 20%
Returned an average of $400 million per year to shareholders in 2012-2013
Reduced global overhead by $143 million
Exited 8 countries
l Focus going forward:
Reducing risk
Bringing in financial partners with a lower cost of capital
Selectively investing in growth projects benchmarked against share repurchases
Goal: Deliver Higher Risk-Adjusted Returns
1. A non-GAAP financial measure. See Appendix for definition.
Contains Forward-Looking Statements 4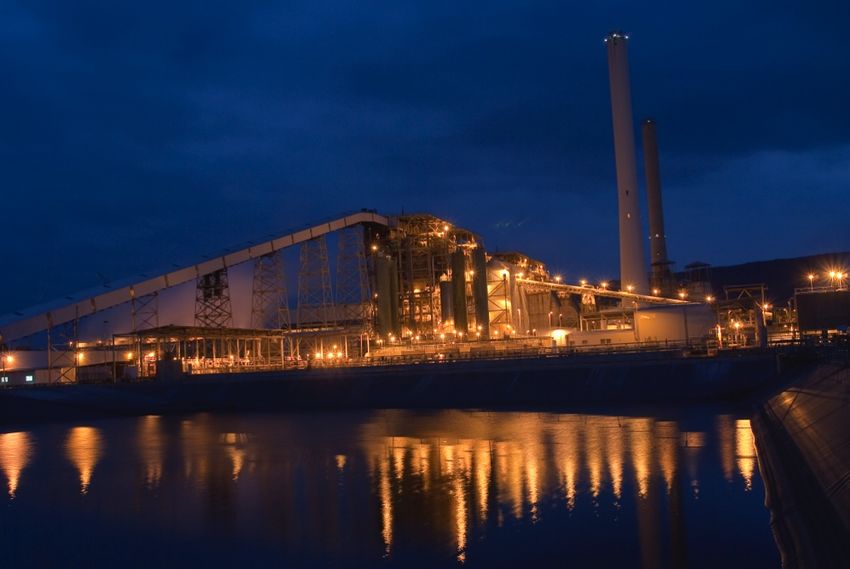
Our Strategic Pillars Leverage Our Platforms to Drive Growth;
Partnerships Reduce Risk and Enhance Returns
Reducing Performance Leveraging Our Expanding
Complexity Excellence Platforms Access to
Capital
l Exiting businesses l Be the low-cost l Expanding existing l Building strategic
with no competitive manager businesses partnerships
advantage
l On track to lower l Building on strong l Lower cost source
l Achieved $2 billion global G&A by $200 presence in key of funding for new
in asset sale million by 2015 markets projects
proceeds – Exited 8
countries l Reducing O&M by l Selling down
$185 million1 by existing businesses
l Expect to raise an 2018 reduces risk,
additional $500 improves returns
million by and frees-up capital
December 2015
1. On a proportional basis. $250 million on a consolidated basis.
Contains Forward-Looking Statements 5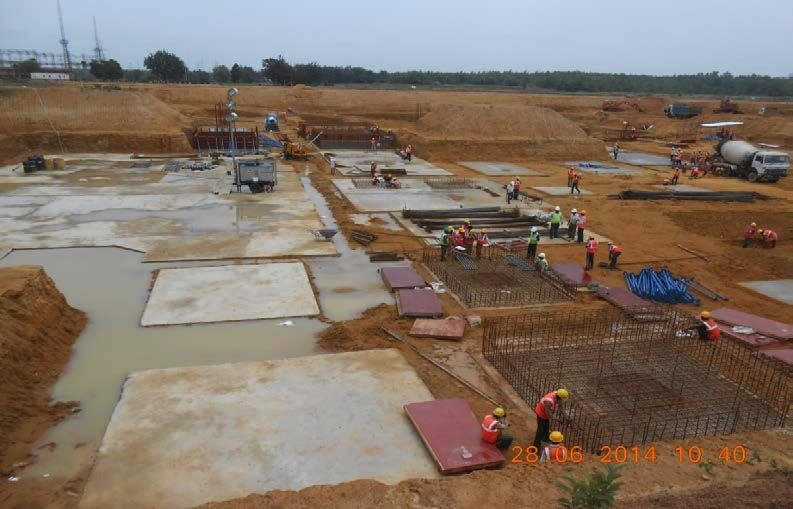
Growth Focused on Leveraging Our Competitive Advantages
and Expertise
Platform
l 6,947 MW under construction
Expansions
l Energy storage
Adjacencies &
l Desalinization
Enhancements
l Fogging
Targeted
l Complementary to existing position in key markets
M&A
Growth Projects Benchmarked Against Share Repurchases
Contains Forward-Looking Statements 6
Leveraging Our Platforms: Construction Program Contributes
to Long-Term Growth
MW Additions by Year

     4,547 MW, Plus 2,400 MW of MATS                                                   AES Equity Investments of
       Upgrades Under Construction                                                           $1.5 Billion

                                                           1,851

                                               671

                                                                                   Asia        31%                         33%         US

                                2,400

                  1,433          572

       20                                                                                                   36%
      2014        2015          2016          2017         2018
                                                                                                           Chile1
       New Capacity Under Construction                IPL MATS

1.  AES Gener, listed in Santiago.
Note: These are some of our construction projects. Other projects not currently on this slide, whether developed through acquisitions or otherwise,
may be brought on-line before these projects. In addition, some of these examples may not close or be completed as anticipated, or they may be
delayed, due to uncertainty inherent in the development process.
Contains Forward-Looking Statements                                                                                                                   7
Increasing Per Share Value on a Risk-Adjusted Basis
$ in Millions
                                     Construction Program & IPL MATS
                                           15% ROE1 and 7x P/E

     Non-Recourse                                                                                   $450              To Be Invested
     Debt/Partner
     Funding
                  $7,100
                                                  $1,500 AES Equity
                                                                                                  $1,050              Already Funded/
                                                                                                                      In-Country Cash

                     70% of AES’ Equity Commitments Already Funded
1.    Based on 2018 contributions from all projects under construction and IPL MATS upgrades. Assumes a full year contribution from Alto Maipo,
      which is expected to come on-line in 2H 2018.Weighted Average Return on Equity is net income divided by AES equity contribution. See Slide 40
      for details.
Contains Forward-Looking Statements                                                                                                               8
Attracting Low-Cost Capital by Bringing in Partners
$ in Millions

                                           $1,181          $1,790

                                      ● Guacolda (Chile)
                                      ● Masinloc
                                        (Philippines)

                    $609

            ● Cochrane (Chile)
            ● Alto Maipo (Chile)
            ● Silver Ridge
              Power (Solar JV)

                    2013                    2014            Total

      Objective: Reduce Risk, Improve Returns and Free-Up Capital

Contains Forward-Looking Statements                                 9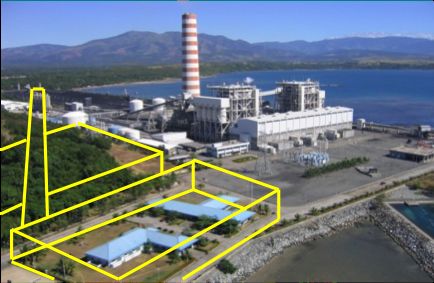
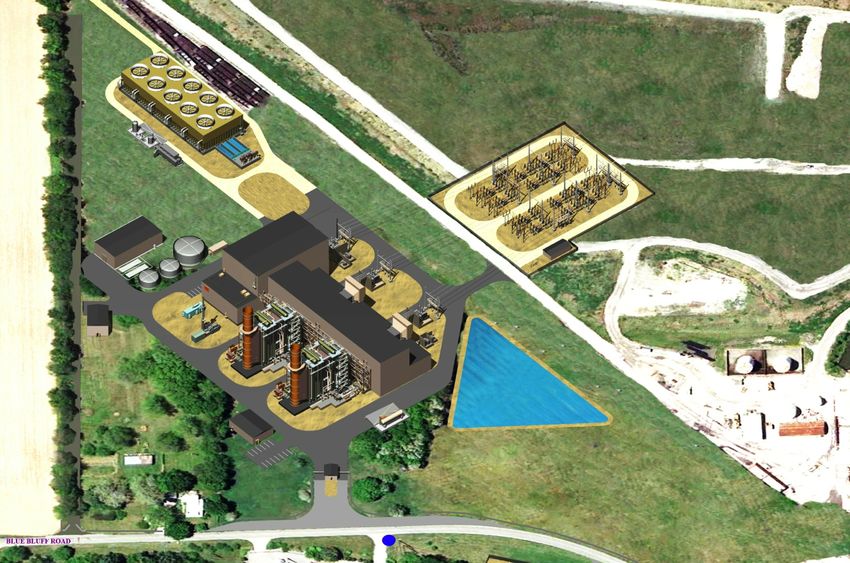
Construction Program: Indianapolis Power & Light (US)

            671 MW Eagle Valley CCGT – Expected On-Line 1H 2017

Contains Forward-Looking Statements                               10
Construction Program: OPGC (India)
1,320 MW OPGC II
Existing 420 MW OPGC I
Expected On-Line 1H 2018
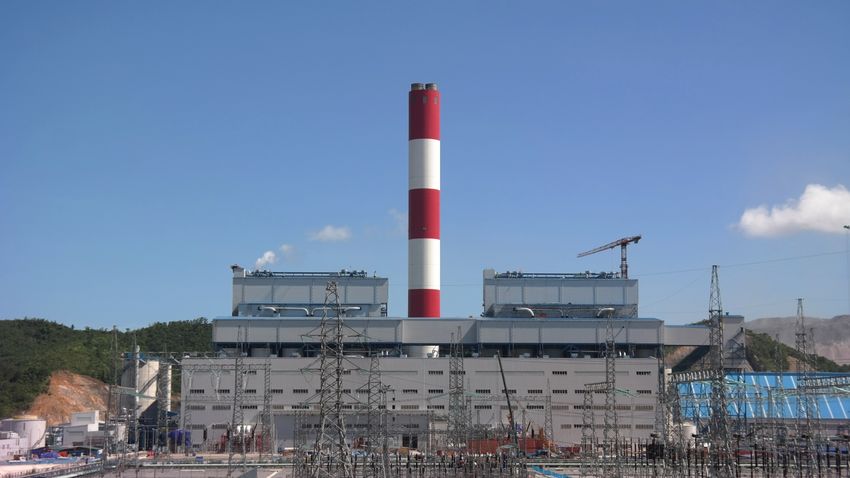
Contains Forward-Looking Statements 11Construction Program: Mong Duong 2 (Vietnam)
1,240 MW Mong Duong 2 – Expected On-Line 2H 2015
Contains Forward-Looking Statements 12Construction Program: Cochrane (Chile)
572 MW Cochrane
Existing 545 MW Angamos
Expected On-Line 1H 2016
Contains Forward-Looking Statements 13Development Pipeline: Well-Positioned to Benefit from Strong
Competitive Advantages
Development Pipeline 18,000 MW
l Expansion of existing facilities
l Rate base growth
l Repowering opportunities
l Privatization of new projects in existing markets
l Adjacencies and enhancements
Energy storage
Water desalinization
Fogging
Expect Returns that Exceed Return on Share Repurchases
Contains Forward-Looking Statements 14Development Pipeline: Examples of Rate Base Growth
IPL 410 MW Harding Street Station IPL Petersburg Wastewater
Coal to Natural Gas Conversion Compliance Plan
l $125 million estimated project cost l $225 million estimated project cost
l Includes wastewater compliance and l Regulatory order expected September
closure of ash pond and coal pile 2015
l Regulatory order expected September l Construction expected to begin
2015 December 2015
l Conversion completion 2H 2016 l Operations 2H 2017
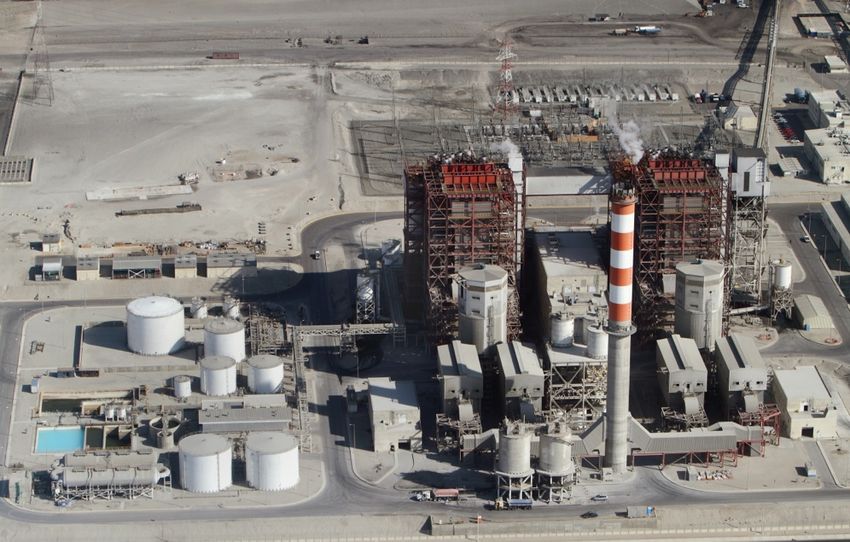
Contains Forward-Looking Statements 15Development Pipeline: Example of Expansion of Existing
Facility
Dominican Republic: Increasing Capacity by 122 MW to 358 MW
l Signed a 6-year PPA
l Selected an EPC contractor
l Expect to fund majority of capital
cost with debt capacity in the
Dominican Republic
l Operations expected mid-2016
Contains Forward-Looking Statements 16Development Pipeline: Example of Expansion of Existing
Facility
Philippines: 600 MW Expansion of Existing 630 MW Masinloc Facility
l All permits in place
l Working on securing EPC contract
and power offtake agreements
l Up to 200 MW of energy storage
Contains Forward-Looking Statements 17Development Pipeline: Example of Repowering Opportunities Opportunities at Existing Southland Facilities in Southern California l 3,400 MW across three sites l Permits expected 2014 and 2015 l Seeking long-term contracts l Construction expected to begin in 2017 Contains Forward-Looking Statements 18
Development Pipeline: Example of New Projects in Existing
Market
Mexico
l Our competitive advantage:
Almost 15 years in Mexico
Currently own/operate 1,055 MW –
one of the largest IPPs in-country
l Recently approved energy reforms
l Potential capacity increase of
>25,000 MW in 5-7 years
Contains Forward-Looking Statements 192014 Parent Capital Allocation Plan
$ in Millions
Discretionary Cash – Sources Discretionary Cash – Uses
($1,600-$1,700) ($1,600-$1,700)
Shareholder Target Closing
$1,600- Dividend $100 Cash Balance
$1,700 Completed Share
$450-$550 $63 Buyback Through $47
8/6/14 $145
$955
$433-
Debt $500- To be Allocated
$633
Prepayment and $600
$132 Refinancing3
$275
Cash Asset Sales Parent FCF 2 Return of Total
Balance as of Proceeds Capital & Discretionary Approved Investments
1
December Received Other Cash
31, 2013
in Subsidiaries (Largely
Gener & IPL MATS)
Unallocated Cash Available to Invest in Share Buybacks,
Platform Expansions and Debt Paydown
1. Includes announced or closed asset sale proceeds net of transaction costs of: $435 million (Masinloc in the Philippines), $175 million (solar),
$155 million (Sonel, Kribi and Dibamba in Cameroon), $155 million (UK Wind), $25 million (3 US wind facilities) and $8 million (India wind).
2. A non-GAAP financial metric. See Appendix for definition and reconciliation.
3. Includes $460 million recourse debt prepayment, associated premiums and $12 million net use of cash related to first half 2014 refinancings.
Contains Forward-Looking Statements 20Adjusted EPS1 Growth: 4%-6% Through 2015, Expecting
Faster Growth in 2017-20182
See Slides 35-38 for Assumptions and Sensitivities
2016: Expect flat
to modest growth, 6%-8%
despite $0.11
Average
6%-8%
4%-6% headwind at
Tietê and DPL Annual
$1.30-$1.38 Growth
$1.29
+ Completion of + Completion of + Performance
Mong Duong 23 724 MW of improvement
Expect low end of
range (impact from construction5
+ Full year of + Capital allocation
adverse hydrology) operations in + Rate base growth
Jordan4 at IPL (US) + 2018: Completion
of 1,851 MW of
+ Capital allocation + Full year of construction
operations in projects6
Vietnam
+ Capital allocation
– Tietê contract
step-down
– DPL PJM
capacity prices
2013 2014 2015 2016 2017-2018
1. A non-GAAP financial measure. See Appendix for definition and reconciliation.
2. 2014 guidance reaffirmed on August 7, 2014 and 2015-2018 growth rates provided on February 26, 2014.
3. 1,240 MW Mong Duong 2 project in Vietnam.
4. 247 MW IPP4 project in Jordan.
5. 152 MW Guacolda V and 572 MW Cochrane projects in Chile.
6. 531 MW Alto Maipo project in Chile and 1,320 MW OPGC II project in India.
Contains Forward-Looking Statements 21Growth in Proportional Free Cash Flow (Prop FCF)1
$ in Millions
2014-2018
$1,000-$1,300 10%-15%
$1,271
Average Annual
Mid-point of $1,150
Represents 11% Yield Growth
on Current Market Cap
$100 Million Headwinds: Drivers for Higher Prop
FCF1 versus Adjusted
– ($40) million – Higher
EPS1
environmental capex
in Andes + Maintenance capex lower
than depreciation from
– ($60) million – Cameroon
new businesses2
asset sale announced in
November 2013 + Mong Duong (Vietnam)
accounting treatment
+ Completion of
environmental capex in
Chile
2013 2014 2015-2018
Strong and Growing Proportional Free Cash Flow1 – Increasing Capital
Available for Debt Repayment, Growth & Distributions to Parent
1. A non-GAAP financial measure. See Appendix for definition and reconciliation. 2014 guidance reaffirmed on August 7, 2014 and 2015-2018 growth rates provided
on February 26, 2014.
2. Consistent with existing operations. 2013 actual proportional depreciation was $975 million versus proportional maintenance capex of $610 million.
Contains Forward-Looking Statements 22Conclusion
l Diversified power company with concentration in higher growth markets
l Well-positioned to benefit from growth opportunities
l Executing on a strategy to deliver higher risk-adjusted returns
l Attractive and growing total return at a compelling valuation
Proportional Free Cash Flow1 yield of 12%; expecting growth of 10%-15%
annually (2014-2018)2
Total return3 potential increases to 8%-10% annually from current level of
6%-8%2
1. A non-GAAP financial measure. See Appendix for definition.
2. 2014 guidance reaffirmed on August 7, 2014 and 2015-2018 growth rates provided on February 26, 2014.
3. Current total return is based on 4%-6% Adjusted EPS growth and a 1%-2% dividend. Future total return based on 2017-2018 Adjusted EPS
growth outlook of 6%-8% and a 1%-2% dividend.
Contains Forward-Looking Statements 23Appendix l Hydrology Slide 25 l In Brazil, Improvement in Forward Curves Provides Upside Potential Slide 26 l Business Developments Slides 27-29 l Dividend Policy Slide 30 l Parent Only Cash Flow Slide 31 l DPL Modeling Tools Slide 32 l DPL Debt Schedule Slide 33 l Asset Sales Slide 34 l Key Assumptions for 2014-2018 Outlook Slide 35 l Year-to-Go 2014 Guidance Estimated Sensitivities Slide 36 l Currency and Commodity Sensitivities Slides 37-38 l AES Modeling Disclosures Slide 39 l Construction Program Slide 40 l Reconciliation Slide 41 l Assumptions & Definitions Slides 42-44 Contains Forward-Looking Statements 24
Continue to Expect FY 2014 Adjusted EPS1 Impact from Poor
Hydrology of $0.07-$0.10 Per Share, Including $0.04 YTD 2014
Chile, Colombia &
Panama Brazil
Argentina
l In-line with prior l Inflows have improved l Expect inflows to be in-
expectations since May line with historical
l Rainy season: May- average through
November; forecast for November and thermal
the remainder of the year dispatch to remain high,
is 20%-30% below to preserve reservoir
average levels
l Proactive steps mitigate l Reservoir levels should
potential impact in 2014 be sufficient to avoid
by $0.04 per share rationing in 2014
l Impact of dry conditions
for 2015 dependent on
rainfall during next rainy
season (December-April)
Reduced 2014 Impact Through Proactive Steps Despite
Drier Hydrology than 2013
1. A non-GAAP financial measure. See Slide 41 for reconciliation and “definitions”.
Contains Forward-Looking Statements 25In Brazil, Improvement in Forward Curves Provides Upside
Potential
Tietê’s Contracted Position Forward Power Prices
26% 36% 63%
l 2016 current forward power prices
Uncontracted Uncontracted Uncontracted for uncontracted energy: R$180-R
$210/MWh
$0.01-$0.02 upside in Adjusted EPS1
in 2016
l Beyond 2016 forward power prices
for uncontracted energy: R$140-R
74% 64% 37% $150/MWh
Contracted at Contracted at Contracted at
an average of an average of an average of On an unhedged basis, every R$10/
R$125/MWh R$125/MWh R$128/MWh
MWh improvement in power prices,
2016 2017 2018 relative to our long-term expectation2
of R$120-R$130, translates to $0.01
Energy Available for Sale (MWh)
upside in Adjusted EPS1
Energy Sold (MWh)
1. A non-GAAP financial measure. See Slide 41 for reconciliation and “definitions”.
2. Expectations provided on February 26, 2014.
Contains Forward-Looking Statements 26Maritza Update
690 MW Coal-Fired Plant in Bulgaria
l Contributes $140 million or 7% of Adjusted PTC1
l Long-term Power Purchase Agreement (PPA) with NEK, the state-owned utility, through 2026
l Announcements by State Energy and Water Regulatory Commission (SEWRC) in June 2014:
Requested European Commission to scrutinize PPA under European state aid rules
Instructed NEK to initiate negotiations on the terms of the PPA, in order to lower payments
l Maritza is in discussions with NEK and the Government of Bulgaria
l Taking steps to lower receivables balance
Last week, NEK agreed to settle $45 million in receivables overdue for more than 90 days – NEK assumed $17
million fuel obligation and agreed to pay remaining amount over four months
NEK has paid $63 million since last earnings call in May 2014
As of July 31, 2014: $206 million in receivables, of which $47 million is not yet due and $69 million is overdue for
more than 90 days
Objective is to Preserve the Value of the Business Through a
Negotiated Agreement or by Seeking to Enforce Rights
1. Based on 2014 expectations. A non-GAAP financial measure. See “definitions”.
Contains Forward-Looking Statements 27Other Business Developments
Argentina Puerto Rico
l Contributes $60 million or 3% of l Contributes $40 million 2% of
Adjusted PTC1 Adjusted PTC1
l Currently no impact from l In July, government debt
government’s selective default downgraded, again
l Competitive generation fleet of l PREPA, the government-owned
2,930 MW utility, is the offtaker for AES’ 524
MW coal-fired power plant; also
l Devaluation factored into our owns oil-fired generation fleet
forecast; extreme devaluation could serving 70% of Puerto Rico’s energy
have a negative impact needs
l AES Puerto Rico sells electricity at
9.5 cents/kWh vs. >20 cents/kWh of
PREPA-owned capacity – saving
PREPA ~$250 million annually
1. Based on 2014 expectations. A non-GAAP financial measure. See “definitions”.
Contains Forward-Looking Statements 28DPL
Regulatory Developments Business Update
l ESP case l Retaining DPL generation assets
Public Utilities Commission of Ohio Selling at less than long-term value
(PUCO) has ruled on all pending would have left remaining business
matters with significant debt
Generation separation deadline Additional value creation potential:
extended to January 1, 2017 w Movements in power prices create a
more positive outlook
l Generation separation case w PJM capacity market
Close to a consensus with PUCO Staff w Operational and commercial optimization
Expect PUCO decision in the third l Planning to prepay debt by using
quarter of 2014 DPL’s excess free cash flow
Reducing consolidated debt by $200-
$300 million by 2016
Contains Forward-Looking Statements 29Dividend Policy: Payout Ratio Target of 30%-40% of
Sustainable Parent Free Cash Flow (Parent FCF)1
$ in Millions
l Dividend level to be tied to Parent
FCF1 29%2
Expecting Parent FCF1
to grow in-line
with Proportional FCF1 growth of
10%-15% annually 23% 23%
l Current payout ratio of 29% is at the
low-end of the target range
l Will be reviewed annually in the ~$1203 ~$120 ~$145
fourth quarter
$ in Millions 2012 2013 2014
Parent FCF1 $521 $516 $450-$550
1. A non-GAAP financial measure.
2. Based on mid-point of $450-$550 million range.
3. Annualized; initiated dividend in fourth quarter 2012 for $30 million.
Contains Forward-Looking Statements 30Parent Sources & Uses of Liquidity
Q2 YTD
$ in Millions
2014 2013 2014 2013
SOURCES
Total Subsidiary Distributions1 $210 $308 $441 $510
Proceeds from Asset Sales, Net $155 $154 $189 $209
Financing Proceeds, Net $765 $746 $1,508 $746
Increased/(Decreased) Credit Facility Commitments - - - -
Issuance of Common Stock, Net - $1 $1 $3
Total Returns of Capital Distributions & Project Financing
Proceeds $26 $1 $36 $163
Beginning Parent Company Liquidity2 $825 $1,222 $931 $1,106
Total Sources $1,981 $2,432 $3,106 $2,737
USES
Repayments of Debt ($797) ($1,204) ($1,662) ($1,206)
Shareholder Dividend ($36) ($30) ($72) ($60)
Repurchase of Equity ($32) ($18) ($32) ($18)
Investments in Subsidiaries, Net ($228) ($12) ($258) ($87)
Cash for Development, Selling, General & Administrative
and Taxes ($52) ($87) ($164) ($193)
Cash Payments for Interest ($114) ($163) ($195) ($241)
Changes in Letters of Credit and Other, Net ($28) ($10) ($29) ($24)
Ending Parent Company Liquidity2 ($694) ($908) ($694) ($908)
Total Uses ($1,981) ($2,432) ($3,106) ($2,737)
1. See “definitions”.
2. A non-GAAP financial measure. See “definitions”.
Contains Forward-Looking Statements 31DPL Inc. Modeling Disclosures
Based on Market Conditions and Hedged Position as of June 30, 2014
Full Year 2014 Full Year 2015 Full Year 2016
Volume Production (TWh) 16 13 14
% Volume Hedged >90% ~75% ~20%
EBITDA Generation Business1 ($ in Millions) $80 to $100 per year
EBITDA DPL Inc. including Generation and T&D
($ in Millions) ~ $350 per year
Reference Prices
Henry Hub Natural Gas ($/mmbtu) 4.6 4.2 4.2
AEP-Dayton Hub ATC Prices ($/MWh) 47 38 39
EBITDA Sensitivities (with Existing Hedges)2 ($ in Millions)
+/-10% Henry Hub Natural GasNon-Recourse Debt at DP&L and DPL Inc.
$ in Millions
Amount Outstanding as of
Series Interest Rate Maturity June 30, 2014 Remarks
● Callable at make-whole T
2013 First Mortgage Bonds 1.875% September 2016 $445.0 +20
2006 OH Air Quality Pollution ● Non-callable; callable at par
Control 4.8% September 2036 $100.0 in September 2016
2005 Boone County, KY ● Non-callable; callable at par
Pollution Control 4.7% January 2028 $35.3 in July 2015
2005 OH Air Quality Pollution ● Non-callable; callable at par
Control 4.8% January 2034 $137.8 in July 2015
2005 OH Water Quality ● Non-callable; callable at par
Pollution Control 4.8% January 2034 $41.3 in July 2015
2008 OH Air Quality Pollution
Control VDRNs Variable November 2040 $100.0 ● Callable at par
Total Pollution Control Various Various $414.4
● No contractual
Wright-Patterson AFB Note 4.2% February 2061 $18.7 prepayment option
● Redeemable at pre-
DP&L Preferred 4.7% N/A $22.9 established premium
Total DP&L $900.9
2018 Term Loan Variable May 2018 $190.0 ● No prepayment penalty
● Callable at make-whole T
2011 Senior Unsecured 6.50% October 2016 $430.0 +50
● Callable at make-whole T
2011 Senior Unsecured 7.25% October 2021 $780.0 +50
Total Senior Unsecured Various Various $1,210
2001 Cap Trust II Securities 8.125% September 2031 $20.6 ● Non-callable
Total DPL Inc. $1,420.6
TOTAL $2,321.5
Contains Forward-Looking Statements 33Narrowing Our Geographic Focus: Since September 2011,
Sold 30 Assets and Exited 8 Countries
$ in Millions
AES Share of Proceeds
Business Country Remarks
September 2011-
December 2012 2013 2014 Total
Non-core asset; Paid down $197
Atimus (Telecom) Brazil $284 $284 million1 in debt at Brasiliana
subsidiary
Bohemia Czech Republic $12 $12 Limited growth
Edes and Edelap Argentina $4 $4 Underperforming businesses
Cartagena Spain $229 $24 $253 No expansion potential
Red Oak and Ironwood U.S. $228 $228 No expansion potential
Limited growth/
French Wind France $42 $42 no competitive advantage
Limited growth/
Hydro, Coal and Wind China $87 $46 $133 no competitive advantage
Limited growth/
Tisza II Hungary $14 $14 no competitive advantage
Limited growth/
Two Distribution Companies Ukraine $108 $108 no competitive advantage
Limited growth/
Trinidad Trinidad $30 $30 no competitive advantage
Wind Turbines U.S. $26 $26 No suitable project
Sonel, Dibamba and Kribi Cameroon $2022 $202
Wind Project & Pipeline India & Poland $16 $16
3 Wind Projects U.S. $22 $22 Limited growth
Silver Ridge Power (Solar) Various $178 $178
Masinloc Partnership Philippines $453 $453
4 Wind Projects United Kingdom $155 $155
TOTAL $900 $234 $1,026 $2,160
1. AES owns 46% of its Brasiliana subsidiary. Proceeds and debt reflect AES’ ownership percentage.
2. $40 million to be received in 2016.
Contains Forward-Looking Statements 34Key Assumptions for 2014-2018 Outlook
l 2014
Foreign currency and commodity forward curves as of June 30, 2014
Adjusted EPS1 impact of $0.07-$0.10 per share from more severe
hydrological conditions
l 2014-2018
Adjusted effective tax rate in low- to mid-30% range, which includes
anticipated extension of CFC look-thru rule2
Continued progress to achieve operating efficiencies
Uses of Parent discretionary cash:
w Quarterly dividend ($145 million in 2014)
w $450 million remaining equity investment in on-going construction projects (~$200
million in 2014 and remaining in 2015-2016)
w Capital allocation
1. A non-GAAP financial measure. See “definitions”.
2. Beyond the one-time 2014 impact, other effects of the potential Chilean tax law change have not been considered.
Contains Forward-Looking Statements 35Year-to-Go 2014 Guidance Estimated Sensitivities
Interest Rates1 l 100 bps move in interest rates over YTG 2014 is equal to a change in EPS of approximately $0.01
l 10% appreciation in USD against the following key currencies is equal to the following negative EPS impacts:
YTG 2014
Average Rate Sensitivity
Argentine Peso (ARS) 9.05 $0.005
Currencies Brazilian Real (BRL) 2.28 $0.005
Euro 1.37 Less than $0.005
Great British Pound (GBP) 1.71 $0.005
Kazakhstan Tenge (KZT) 186.6 $0.005
10% increase in commodity prices is YTG 2014
forecasted to have the following EPS
impacts: Average Rate Sensitivity
NYMEX Coal $62/ton Less than $0.005,
Commodity Rotterdam Coal (API 2) $75/ton negative correlation
Sensitivity NYMEX WTI Crude Oil $104/bbl
$0.005, positive correlation
IPE Brent Crude Oil $112/bbl
NYMEX Henry Hub Natural Gas $4.5/mmbtu
$0.005, positive correlation
UK National Balancing Point Natural Gas £0.47/therm
Note: Guidance provided on August 7, 2014. Sensitivities are provided on a standalone basis, assuming no change in the other factors, to illustrate
the magnitude and direction of changing market factors on AES’ results. Estimates show the impact on YTG (July-December) 2014 adjusted EPS.
Actual results may differ from the sensitivities provided due to execution of risk management strategies, local market dynamics and operational
factors. 2014 guidance is based on currency and commodity forward curves and forecasts as of June 30, 2014. There are inherent uncertainties in
the forecasting process and actual results may differ from projections. The Company undertakes no obligation to update the guidance presented
today. Please see Item 3 of the Form 10-Q for a more complete discussion of this topic. AES has exposure to multiple coal, oil, and natural gas
indices; forward curves are provided for representative liquid markets. Sensitivities are rounded to the nearest ½ cent per share.
1. The move is applied to the floating interest rate portfolio balances as of June 30, 2014.
Contains Forward-Looking Statements 36Foreign Exchange (FX) Risk Mitigated Through Structuring of
Our Businesses and Active Hedging
2014 Adjusted PTC1: $2 Billion 2014 Full Year FX Sensitivity2,3
FX Risk by Currency by SBU (Cents Per Share)
ARS Other FX
GBP 3% 2%
5%
1.0
EUR
8%
1.0
COP
7% 0.5
0.5 3.5
USD- 2.5
Equivalent 2.0
BRL 1.5
63%
12% 0.5
US Andes Brazil MCAC EMEA Asia CorTotal
FX Risk After Hedges Impact of FX Hedges
l Balance of 2014 correlated FX risk after hedges is $0.01 for 10% USD appreciation
l 63% of 2014 earnings effectively USD
USD-based economies (i.e. U.S., Panama)
Structuring of our PPAs
l FX risk mitigated on 12-month rolling basis by shorter-term active FX hedging programs
1. Before Corporate Charges. A non-GAAP financial measure. See Appendix for definition and reconciliation.
2. Sensitivity represents full year 2014 exposure to a 10% appreciation of USD relative to foreign currency as of December 31, 2013.
3. Andes includes Argentina and Colombia businesses only, due to limited translational impact of USD appreciation to Chilean businesses.
Contains Forward-Looking Statements 37Commodity Exposure is Largely Hedged Through 2015, Long
on Natural Gas in Medium- to Long-Term
Full Year 2016 Adjusted EPS1 Commodity Sensitivity2
for 10% Change in Commodity Prices
8.0
6.0
Cents Per Share
4.0
2.0
0.0
Coal Gas Oil Correlated Total
(2.0)
(4.0)
(6.0)
l Primarily hedged in 2014 – correlated sensitivity in 2014 as of December 31, 2013 was
$0.025, balance of year as of June 30, 2014 is $0.010
l Coal fleet at DP&L is the primary driver of increase in sensitivity to coal and gas
1. A non-GAAP financial measure. See Appendix for definition.
2. Domestic and International sensitivities are combined and assumes each fuel category moves 10%. Adjusted EPS is negatively correlated to coal
price movement, and positively correlated to gas and oil price movements.
Contains Forward-Looking Statements 38AES Modeling Disclosures
$ inCommodity
l Millions 2014 Assumptions
and foreign currency exchange rates forward curves as of December 31,
2013
Income Statement Assumptions
Adjusted PTC1 $1,250-$1,490
Tax Rate 30%-32%
Diluted Share Count 730
Parent Company Cash Flow Assumptions
Subsidiary Distributions (a) $1,150-$1,250
Cash Interest (b) $400
Cash for Development, General & Administrative and Tax (c) $300
Parent Free Cash Flow (a – b – c) $450-$550
1. A non-GAAP financial measure. See reconciliation on Slide 41 and “definitions”.
Contains Forward-Looking Statements 39Attractive Returns from 2014-2018 Construction Pipeline
$ in Millions, Unless Otherwise Stated
Total
AES Gross Expected AES
Project Country Ownership Fuel MW COD Total Capex ROE Comments
Equity
Construction Projects Coming On-Line 2014-2018
Lease capital structure at
Tunjita Colombia 71% Hydro 20 2H 2014 $67 $21
Chivor
Warrior Run ES US-MD 100% Energy Storage 20 1H 2015 $8 $8
Guacolda V Chile 36% Coal 152 2H 2015 $454 $48
Mong Duong 2 Vietnam 51% Coal 1,240 2H 2015 $1,948 $249 Lease accounting
Andes Solar Chile 71% Solar 21 2H 2015 $44 $22
Environmental (MATS)
IPL MATS US-IN 100% Coal 1H 2016 $511 $230
upgrades of 2,400 MW
Coal 532
Cochrane Chile 42% 1H 2016 $1,350 $130
Energy Storage 40
Eagle Valley CCGT US-IN 100% Gas 671 1H 2017 $585 $263
OPGC II India 49% Coal 1,320 1H 2018 $1,600 $225
Alto Maipo Chile 42% Hydro 531 2H 2018 $2,050 $335
Weighted average; net
ROE2 IN 2018 ~15% income divided by AES
equity contribution
Weighted average;
subsidiary distributions
CASH YIELD2 IN 2018 ~16%
divided by AES equity
contribution
1. AES equity contribution equal to 71% of AES Gener’s equity contribution to the project.
2. Based on projections. See our 2013 Form 10-K for further discussion of development and construction risks.
Contains Forward-Looking Statements 40Reconciliation of 2014 Guidance
$ in Millions, Except Per Share Amounts
2014 Guidance
Adjusted EPS1 $1.30-$1.38
Proportional Free Cash Flow1 $1,000-$1,300
Consolidated Net Cash Provided by Operating
$2,200-$2,800
Activities
Reconciliation Consolidated Adjustment Factor Proportional
Consolidated Net Cash
Provided by Operating $2,200-$2,800 $550-$850 $1,650-$1,950
Activities (a)
Maintenance &
Environmental Capital $700-$1,000 $200 $500-$800
Expenditures (b)
Free Cash Flow1 (a - b) $1,350-$1,950 $350-$650 $1,000-$1,300
l Commodity and foreign currency exchange rates forward curves as of June 30, 2014
1. A non-GAAP financial measure. See “definitions”.
Contains Forward-Looking Statements 41Assumptions Forecasted financial information is based on certain material assumptions. Such assumptions include, but are not limited to: (a) no unforeseen external events such as wars, depressions, or economic or political disruptions occur; (b) businesses continue to operate in a manner consistent with or better than prior operating performance, including achievement of planned productivity improvements including benefits of global sourcing, and in accordance with the provisions of their relevant contracts or concessions; (c) new business opportunities are available to AES in sufficient quantity to achieve its growth objectives; (d) no material disruptions or discontinuities occur in the Gross Domestic Product (GDP), foreign exchange rates, inflation or interest rates during the forecast period; and (e) material business-specific risks as described in the Company’s SEC filings do not occur individually or cumulatively. In addition, benefits from global sourcing include avoided costs, reduction in capital project costs versus budgetary estimates, and projected savings based on assumed spend volume which may or may not actually be achieved. Also, improvement in certain KPIs such as equivalent forced outage rate and commercial availability may not improve financial performance at all facilities based on commercial terms and conditions. These benefits will not be fully reflected in the Company’s consolidated financial results. The cash held at qualified holding companies (“QHCs”) represents cash sent to subsidiaries of the Company domiciled outside of the U.S. Such subsidiaries had no contractual restrictions on their ability to send cash to AES, the Parent Company, however, cash held at qualified holding companies does not reflect the impact of any tax liabilities that may result from any such cash being repatriated to the Parent Company in the U.S. Cash at those subsidiaries was used for investment and related activities outside of the U.S. These investments included equity investments and loans to other foreign subsidiaries as well as development and general costs and expenses incurred outside the U.S. Since the cash held by these QHCs is available to the Parent, AES uses the combined measure of subsidiary distributions to Parent and QHCs as a useful measure of cash available to the Parent to meet its international liquidity needs. AES believes that unconsolidated parent company liquidity is important to the liquidity position of AES as a parent company because of the non-recourse nature of most of AES’ indebtedness. Contains Forward-Looking Statements 42
Definitions
l Adjusted Earnings Per Share (a non-GAAP financial measure) is defined as diluted earnings per share from continuing operations excluding gains or losses of both consolidated
entities and entities accounted for under the equity method due to (a) unrealized gains or losses related to derivative transactions, (b) unrealized foreign currency gains or losses,
(c) gains or losses due to dispositions and acquisitions of business interests, (d) losses due to impairments, and (e) costs due to the early retirement of debt, adjusted for the
same gains or losses excluded from consolidated entities. The GAAP measure most comparable to Adjusted EPS is diluted earnings per share from continuing operations. AES
believes that Adjusted EPS better reflects the underlying business performance of the Company and is considered in the Company’s internal evaluation of financial performance.
Factors in this determination include the variability due to unrealized gains or losses related to derivative transactions, unrealized foreign currency gains or losses, losses due to
impairments and strategic decisions to dispose or acquire business interests or retire debt, which affect results in a given period or periods. Adjusted EPS should not be construed
as an alternative to diluted earnings per share from continuing operations, which is determined in accordance with GAAP.
l Adjusted Pre-Tax Contribution (a non-GAAP financial measure) represents pre-tax income from continuing operations attributable to AES excluding gains or losses of both
consolidated entities and entities accounted for under the equity method due to (a) unrealized gains or losses related to derivative transactions, (b) unrealized foreign currency
gains or losses, (c) gains or losses due to dispositions and acquisitions of business interests, (d) losses due to impairments, and (e) costs due to the early retirement of debt,
adjusted for the same gains or losses excluded from consolidated entities. It includes net equity in earnings of affiliates, on an after-tax basis. The GAAP measure most
comparable to Adjusted PTC is income from continuing operations attributable to AES. AES believes that Adjusted PTC better reflects the underlying business performance of the
Company and is considered in the Company’s internal evaluation of financial performance. Factors in this determination include the variability due to unrealized gains or losses
related to derivative transactions, unrealized foreign currency gains or losses, losses due to impairments and strategic decisions to dispose or acquire business interests or retire
debt, which affect results in a given period or periods. Earnings before tax represents the business performance of the Company before the application of statutory income tax
rates and tax adjustments, including the affects of tax planning, corresponding to the various jurisdictions in which the Company operates. Adjusted PTC should not be construed
as an alternative to income from continuing operations attributable to AES, which is determined in accordance with GAAP.
l Free Cash Flow (a non-GAAP financial measure) is defined as net cash from operating activities less maintenance capital expenditures (including non-recoverable environmental
capital expenditures), net of reinsurance proceeds from third parties. AES believes that free cash flow is a useful measure for evaluating our financial condition because it
represents the amount of cash provided by operations less maintenance capital expenditures as defined by our businesses, that may be available for investing or for repaying
debt. Free cash flow should not be construed as an alternative to net cash from operating activities, which is determined in accordance with GAAP.
l Net Debt (a non-GAAP financial measure) is defined as current and non-current recourse and non-recourse debt less cash and cash equivalents, restricted cash, short term
investments, debt service reserves and other deposits. AES believes that net debt is a useful measure for evaluating our financial condition because it is a standard industry
measure that provides an alternate view of a company’s indebtedness by considering the capacity of cash. It is also a required component of valuation techniques used by
management and the investment community.
l Parent Company Liquidity (a non-GAAP financial measure) is defined as cash at the Parent Company plus availability under corporate credit facilities plus cash at qualified
holding companies (“QHCs”). AES believes that unconsolidated Parent Company liquidity is important to the liquidity position of AES as a Parent Company because of the non-
recourse nature of most of AES’ indebtedness.
l Parent Free Cash Flow (a non-GAAP financial measure) should not be construed as an alternative to Net Cash Provided by Operating Activities which is determined in
accordance with GAAP. Parent Free Cash Flow is equal to Subsidiary Distributions less cash used for interest costs, development, general and administrative activities, and tax
payments by the Parent Company. Parent Free Cash Flow is used for dividends, share repurchases, growth investments, recourse debt repayments, and other uses by the
Parent Company.
Contains Forward-Looking Statements 43Definitions (Continued)
l Proportional Metrics – The Company is a holding company that derives its income and cash flows from the activities of its subsidiaries, some of which are not wholly-owned by
the Company. Accordingly, the Company has presented certain financial metrics which are defined as Proportional (a non-GAAP financial measure) to account for the Company’s
ownership interest.
Proportional metrics present the Company’s estimate of its share in the economics of the underlying metric. The Company believes that the Proportional metrics are useful to
investors because they exclude the economic share in the metric presented that is held by non-AES shareholders. For example, Operating Cash Flow is a GAAP metric which
presents the Company’s cash flow from operations on a consolidated basis, including operating cash flow allocable to noncontrolling interests. Proportional Operating Cash Flow
removes the share of operating cash flow allocable to noncontrolling interests and therefore may act as an aid in the valuation the Company.
Proportional metrics are reconciled to the nearest GAAP measure. Certain assumptions have been made to estimate our proportional financial measures. These assumptions
include: (i) the Company’s economic interest has been calculated based on a blended rate for each consolidated business when such business represents multiple legal entities;
(ii) the Company’s economic interest may differ from the percentage implied by the recorded net income or loss attributable to noncontrolling interests or dividends paid during a
given period; (iii) the Company’s economic interest for entities accounted for using the hypothetical liquidation at book value method is 100%; (iv) individual operating
performance of the Company’s equity method investments is not reflected and (v) inter-segment transactions are included as applicable for the metric presented.
The proportional adjustment factor, proportional maintenance capital expenditures (net of reinsurance proceeds), and proportional non-recoverable environmental capital
expenditures are calculated by multiplying the percentage owned by non-controlling interests for each entity by its corresponding consolidated cash flow metric and adding up the
resulting figures. For example, the Company owns approximately 70% of AES Gener, its subsidiary in Chile. Assuming a consolidated net cash flow from operating activities of
$100 from AES Gener, the proportional adjustment factor for AES Gener would equal approximately $30 (or $100 x 30%). The Company calculates the proportional adjustment
factor for each consolidated business in this manner and then adds these amounts together to determine the total proportional adjustment factor used in the reconciliation. The
proportional adjustment factor may differ from the proportion of income attributable to non-controlling interests as a result of (a) non-cash items which impact income but not cash
and (b) AES’ ownership interest in the subsidiary where such items occur.
l Subsidiary Liquidity (a non-GAAP financial measure) is defined as cash and cash equivalents and bank lines of credit at various subsidiaries.
l Subsidiary Distributions should not be construed as an alternative to Net Cash Provided by Operating Activities which is determined in accordance with GAAP. Subsidiary
Distributions are important to the Parent Company because the Parent Company is a holding company that does not derive any significant direct revenues from its own activities
but instead relies on its subsidiaries’ business activities and the resultant distributions to fund the debt service, investment and other cash needs of the holding company. The
reconciliation of the difference between the Subsidiary Distributions and Net Cash Provided by Operating Activities consists of cash generated from operating activities that is
retained at the subsidiaries for a variety of reasons which are both discretionary and non-discretionary in nature. These factors include, but are not limited to, retention of cash to
fund capital expenditures at the subsidiary, cash retention associated with non-recourse debt covenant restrictions and related debt service requirements at the subsidiaries,
retention of cash related to sufficiency of local GAAP statutory retained earnings at the subsidiaries, retention of cash for working capital needs at the subsidiaries, and other
similar timing differences between when the cash is generated at the subsidiaries and when it reaches the Parent Company and related holding companies.
Contains Forward-Looking Statements 44You can also read