Investor Presentation - Innova Italy
←
→
Page content transcription
If your browser does not render page correctly, please read the page content below
Investor Presentation
Disclaimer

             T
              his document has been prepared by Innova Italy 1 S.p.A. (“Innova” or the “Company”) and by Fine Foods
             & Pharmaceuticals N.T.M. S.p.A. (“FF”) for the sole purpose of the presentation of the engaged business
             combination between Innova and the target company. This document may not be copied, distributed or
             reproduced in whole or in part, nor passed to any third party.

             T
              he information contained herein does not purport to be comprehensive. The content of this document has
             a merely informative nature and is not to be construed as providing investment advice. Interested parties
             should conduct their own investigation and analysis of the business combination and the data set forth in
             this document.

             T
              he statements contained herein have not been independently verified. No representation or warranty,
             either express or implied, is made as to, and no reliance should be placed on, the fairness, accuracy,
             completeness, correctness or reliability of the information contained herein. Neither the Company nor FF
             nor any of their representatives shall accept any liability whatsoever (whether in negligence or otherwise)
             arising in any way in relation to such information or in relation to any loss arising from its use or otherwise
             arising in connection with this presentation.

             T
              he information contained in this document, unless otherwise specified is only current as of the date of
             this document. Unless otherwise stated in this document, the information contained herein is based on
             management information and estimates. This presentation includes certain forward looking statements,
             projections, objectives estimates and declaration of preeminence reflecting the current views of the
             management of the Company and FF. Due to such uncertainties and risks, readers are cautioned not to
             place undue reliance on such forward-looking statements as a prediction of actual results. All forward-
             looking statements included herein are based on information available to the Company and FF as of the
             date hereof. The Company nor FF undertakes no obligation to update publicly or revise any forward-looking
             statement, whether as a result of new information, future events or otherwise, except as may be required by
             applicable law. The information contained herein is subject to change without notice and past performance
             is not indicative of future results. The Company and FF may alter, modify or otherwise change in any manner
             the content of this document, without obligation to notify any person of such revision or changes.

2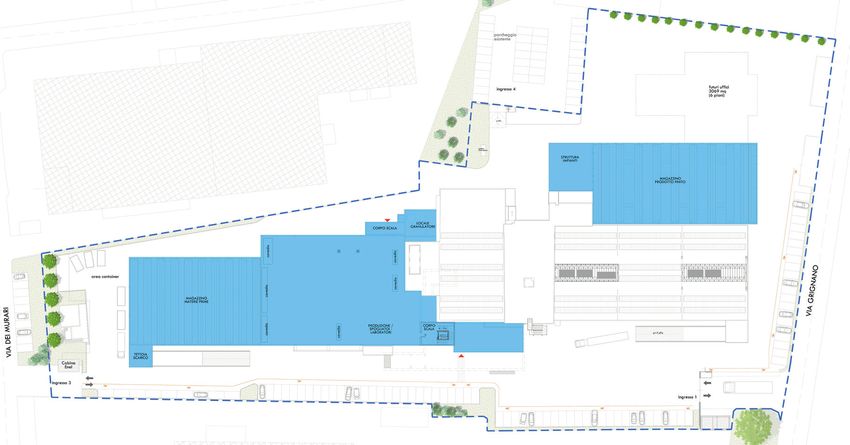
Today’s
Speakers

      Fulvio    Paolo       Marco        Marco    Giorgio     Pietro
      Conti    Ferrario   Costaguta   Eigenmann   Ferraris   Bassani
    CHAIRMAN     CEO      PROMOTER    CHAIRMAN      CEO        CFO
                                       AND CEO

3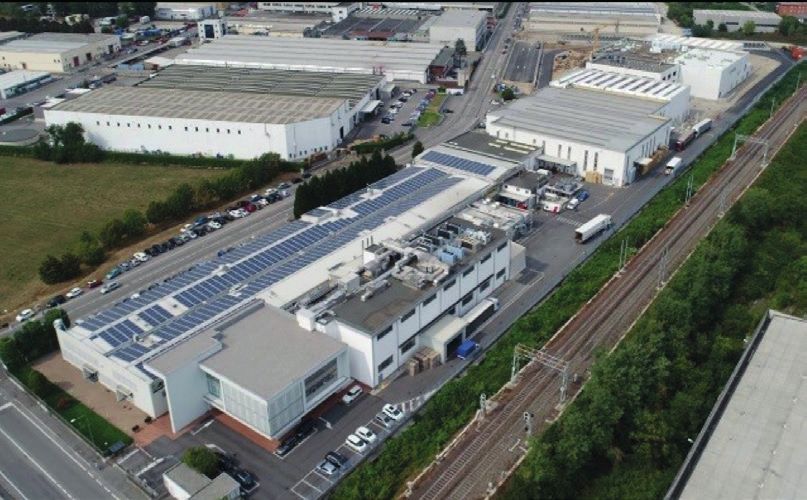
Agenda

         Introduction
         Investment highlights
         Key Financials
         Transaction overview
         Appendix

4
Innova Italy 1

                          Innova Italy 1 is a Special Purpose Acquisition Company
                            that raised €100 million from high-standing Italian
                         institutional investors and listed on AIM in October 2016

                            TEAM                                                 STRATEGIC PILLARS
    Fulvio Conti         Paolo Ferrario         Marco Costaguta
     CHAIRMAN                 CEO                 PROMOTER
                                                                             INDUSTRIAL            GROWTH
                                                                              APPROACH             CAPITAL

                                                                  STAKEHOLDERS                                  COMPANY
                                                                   ALIGNMENT                                    SUPPORT
    Francesco      Alessandro        Valerio        Stefano
      Gianni         Pansa(1)       Bellamoli      Proverbio       OF INTEREST                               (I.E. ACQUISITIONS)
    PROMOTER       PROMOTER       INDEPENDENT    INDEPENDENT
                                    DIRECTOR       DIRECTOR
                                                                                       FOCUS ON
                                                                                      INNOVATION

                                                                                                   (1) Passed away in November 2017

5                                                                                                                  /Introduction
Our Target of choice:
Fine Foods & Pharmaceuticals N.T.M. S.p.A.

      ine Foods & Pharmaceuticals N.T.M. S.p.A. (“Fine Foods”) is a CDMO (Contract Development &
     F
     Manufacturing Organization) of solid oral forms, for the Nutraceutical and Pharmaceutical industries

TABLETS                         CAPSULES                       EFFERVESCENT                    GRANULES                        EFFERVESCENT   POWDERS
                                                               TABLETS                                                         GRANULES


     Fine Foods deliberately holds no proprietary brands, in order to maintain healthy partnerships and an
     integer image with its clients

     Established
               in 1984 in Brembate (Bergamo), Fine Foods has grown steadily over time becoming a leader in
     its reference market

      history of continuous growth, innovation and fruitful client relationships: revenues have grown from
     A
     48€m in 2008 to 120€m in 2017, reaching a 2017 EBITDA Adjusted(1) equal to 16.7€m, mostly organically

(1) 1.2€m adjustment for extraordinary cost generated by the recent change of the IT system of the Company and plants’ expansion
Source: Company data

6                                                                                                                                              /Introduction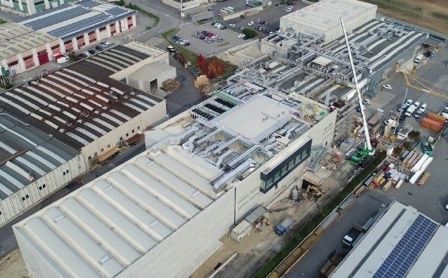
Why Fine Foods?
TTRACTIVE SECTOR, non-cyclical and resilient, supported by (i) outsourcing mega-trends
A
in the Pharmaceutical industry, and (ii) significant entry barriers
EADING ITALIAN PLAYER, delivering strong growth leveraging on the presence in both
L
the Nutraceutical and Pharmaceutical markets
TRONG CUSTOMER LOYALTY, at the base of sustainable organic growth, increasing
S
share of wallet and new customer generation
SUPERIOR QUALITY SYSTEM, combined with special attention to human capital
HIGH-QUALITY MANUFACTURING FOOTPRINT, with ongoing capacity expansion
I NORGANIC GROWTH OPPORTUNITIES, driven by consolidation trends in the CDMO industry
Source: Management elaboration
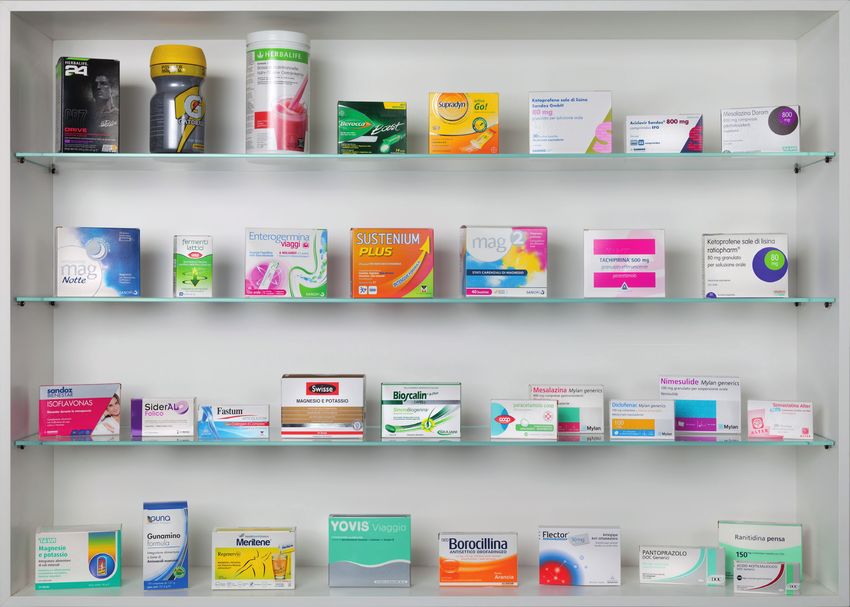
7 /Introduction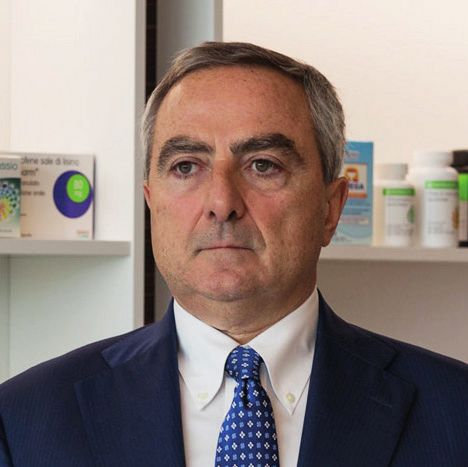
Examples of Products
Manufactured for Reference Clients

                                             PHARMACEUTICALS
NUTRACEUTICALS

Source:
Company data

8                                    /Introduction
Fine Foods Key Figures

                                                                                                                          More than 100
         Revenues CAGR of                                      Ca. 80% of products                                    customers, including
         11% over the last                                    sold in 2017 has been                                 leading Pharmaceutical
            10 years                                          delivered abroad(1)                                 and Nutraceutical players

      92 manufacturing lines                                                                                            Ca. 1.200 SKUs(2),
       in 2 Pharmaceutical                                     10% of employees                                    tailored to client needs
          plants and 1                                        dedicated to quality                                    and delivered with
      Nutraceutical plant                                   control and assurance                                  high-quality standards

(1) 49€m revenues invoiced in Italy, of which 24€m delivered abroad | (2) SKUs means “Stock-Keeping Units”, namely single product codes

9                                                                                                                                             /Introduction
A History of Continuous Growth

                     tarting from 2015, Fine Foods has undertaken significant investments, to increase capacity and
                    S
                    increase efficiency, both in Nutraceuticals and Pharmaceuticals

                       Establishment as an       Opening of        Expansion of R&D         Beginning of        EXPECTED COMPLETION
                         R&D laboratory         the Zingonia       and Quality Control     expansion of         OF PLANTS’ EXPANSION
  NUTRACEUTICALS

                                             Nutraceutical plant    (QC) laboratories    Nutraceutical plant           WORKS

                        1984        1991         1997           2004     2008        2015          2016         2017        2018
  PHARMACEUTICALS

                         Opening of the           First ISO         Acquisition of           Beginning of        New ERP system
                          Brembate              certification      Omicron Pharma            expansion of        implementation
                        Pharmaceutical                                  S.r.l.           Pharmaceutical plant
                            plant

                                                                                            ONGOING PLANTS EXPANSION

                         OVER 30 YEARS OF GROWTH, INNOVATION AND FRUITFUL CLIENT RELATIONSHIPS

Source: Company data

10                                                                                                                       /Introduction
Fine Foods at a Glance
2017 Revenues breakdown
Revenues by end-market Revenues by geography Italian revenues by delivery
Pharma. Nutra. Italy Export Del. in Italy Del. abroad
23% 41% 52%
119.6 €m 119.6 €m 49 €m
~
80% of products
48%
delivered to foreign
77% 59%
end-markets(1)
Revenues and EBITDA evolution (€m)
14.4%
14.0% R
evenues CAGR ‘12-
13.4%
13.4% 13.1% 13.1% ’17 of 9.0%
119.6
113.1
102.0 E
BITDA CAGR ‘12-’17
Revenues 93.8
77.6
87.5 of 9.9%
EBITDA
EBITDA 10.4 11.5 13.5 13.4 15.1 16.7(2) R
obust EBITDA
margin margin at an average
2012 2013 2014 2015 2016 2017 level of 13.6%
(1) 24€m have been invoiced as revenues in Italy, but delivered abroad
(2) 1.2€m adjustment for extraordinary cost generated by the recent change of the IT system of the Company and plants’ expansion
Source: Company data
11 /IntroductionAgenda
Introduction
Investment highlights
Key Financials
Transaction overview
Appendix
12Key Investment Highlights
1
ATTRACTIVE
6
SECTOR
LEADING
GROWTH
ITALIAN 2
OPPORTUNITIES
PLAYER
HIGH-QUALITY STRONG
5 MANUFACTURING CUSTOMER
FOOTPRINT LOYALTY
SUPERIOR
QUALITY 3
SYSTEM
4
13Reference End-markets
PERSONAL CARE PHARMACEUTICALS NUTRACEUTICALS FUNCTIONAL FOOD
& BEVERAGE
SIMILAR CUSTOMERS AND BRANDS ARE COMMON BETWEEN ADJACENT CDMO SEGMENTS
Source: Management elaboration
14 /Investment highlights_ Attractive sectorNutraceuticals Overview
by Segment & Application
The Nutraceuticals market is very diverse, with a lighter regulatory framework than Pharmaceuticals
Fine Foods virtually operates in all the application categories of solid oral forms, within the “Vitamins and
Dietary supplements” segment
PRODUCT SEGMENTS PRODUCT APPLICATIONS
Brain & Children’s
memory Health
• Examples of Cholesterol Weight
supplements: Control Control
Fine Foods vitamins, minerals,
Focus vitamins and minerals, Digestive Tract Women &
VITAMINS
omega fatty acids, Health Men’s Health
AND DIETARY
SUPPLEMENTS ginseng, ginkgo biloba,
echinacea, proteins,
probiotics, co-enzyme Eye Health Antioxidants
Q10, glucosamine,
NUTRACEUTICALS
herbal supplements
Immune
Fibers
Defence
• Functional Food &
FUNCTIONAL Beverages provide Joint Multivitamins
BEVERAGES
health benefits Health & Minerals
through added natural,
healthy ingredients, Oral
FUNCTIONAL in addition to their Probiotics
Rehydration
FOODS nutritional value Tonics Sport
& Energetics Formulations
Source: Management elaboration
15 /Investment highlights_ Attractive sectorFocus on European Nutraceuticals Market
EUROPEAN NUTRACEUTICALS MARKET VALUE EUROPEAN VITAMINS & DIETARY SUPPLEMENTS MARKET VALUE
(€bn) CAGR (€bn)
4.2% 4.9%
CAGR CAGR CAGR
60.3 ‘12-’17 ‘17-’22 4.8%
2.4%
Vitamins &
49.0 16.5 Dietary 4.8% 4.9%
43.5 Supplements
13.0
10.3 Functional
17.1 Beverages
4.1% 7.5%
16.5
11.9 13.0
9.7 10.3
Functional
23.5 24.1 26.7 Foods
0.5% 2.1%
2012 2017 2022
2012 2017 2022
he Vitamins & Dietary Supplements segment has shown
T
consistently strong growth in the last 5 years, expected to
he European Nutraceuticals market has shown high, steady
T continue in coming years. CDMO-driven development and
growth, and is expected to accelerate in coming years manufacturing, mostly outsourced
Source: Euromonitor
16 /Investment highlights_ Attractive sectorFocus on European
Pharmaceuticals Market and CDMO
EUROPEAN PHARMACEUTICALS MARKET VALUE EUROPEAN CDMOS (PHARMA) MARKET VALUE
CAGR
7.6
(€bn) (€bn) ‘10-’15
+4.8%
6.0 3.0 Other 4.6%
(39.5%)
CAGR
2.4
2.6% (40.0%)
2.7% 1.4 France 4.9%
(18.4%)
1.1
(18.3%) 1.5 Germany 4.6%
(19.7%)
322 367 1.1
282 (20.0%)
1.7
1.3 (22.4%)
Italy 5.5%
(21.7%)
2012 2017 2022 2010 2015
lenty of space for CDMOs to grow further along the
P
he European Pharmaceuticals market has been showing
T outsourcing trend
consistent non-cyclical growth Italy shows the highest growth among European markets
Source: Euromonitor, Farmindustria, Prometeia | Note: CDMO – Contract Development Manufacturing Organization
17 /Investment highlights_ Attractive sectorPharmaceuticals Outsourcing
Mega-trend
SMALL-MEDIUM PHARMACEUTICAL FIRMS
The Pharma-CDMO
partnership model is a
At each step of the value-chain, players are generally re-focusing on what can do best win-win, allowing the first
to remain nimble and the
last to focus on structured
Business models with limited or no infrastructure
INCREASING development and efficient
OUTSOURCING manufacturing
LARGE PHARMACEUTICAL FIRMS TREND
Pharmaceutical companies
use manufacturing
Reliance on CDMOs specialized in efficient development and manufacturing outsourcing to have a
greater focus on core
Outsource to few, long-term, reliable partners business
DRUG EARLY STAGE DOSSIER
PRODUCTION DISTRIBUTION
DISCOVERY DEVELOPMENT DEVELOPMENT
CDMOS
THE CDMO SECTOR HAS BEEN GROWING REMARKABLY THANKS TO STRUCTURAL, LONG-TERM TRENDS
Source: PharmSource Trend Report 2016, Frost & Sullivan, Farmindustria, Prometeia
18 /Investment highlights_ Attractive sectorA Fragmented Sector Full of Opportunities
TOP 280 WORLD PHARMACEUTICALS CDMOs BY 2016 REVENUE CLUSTERS
# of CDMOs
180
he CDMO market started to
T
160 show strong M&A activity
160
in recent years
140
It remains a highly
120 fragmented market, with
the majority of CDMOs
100 having revenues < 25$m
and the absence of an overall
80 market leader
60 56
lenty of consolidation
P
opportunities
40 31
17 tructured and nimble
S
20
8 8 CDMOs, willing to rapidly
invest in production capacity,
0
> 500$m 250- 100- 50- 25-Fine Foods Benchmarking Analysis
Fine Foods is the largest Italian CDMO
Fine Foods is one of the few players active in both Pharmaceuticals and Nutraceuticals
In general, the largest European CDMOs are focused almost exclusively on Pharmaceuticals
SELECTED FINE FOODS’ COMPETITORS AT ITALIAN LEVEL – 2016 REVENUES (€M)
120
100
80
60
40
20
0
Fine Foods
Doppel
Biofarma
SIIT
Mipharm
SPL
e Regge
Labomar
Biodue*
E-Pharma
Procemsa
Nutrilinea
Sochim
Valpharma
OFI
Truffini
Lachifarma
Pharma
Nutra
* Listed companies | Note: Nutrilinea, Mipharm and Doppel are respectively controlled by the Private Equity investors White Bridge, Mandarin Capital and Trilantic Europe
Source: Management elaboration on publicly retrievable selected information
20 /Investment highlights_ Leading Italian playerFine Foods Competitive Advantages Being
Both in Nutraceuticals and Pharmaceuticals
NUTRACEUTICALS FLEXIBILITY PHARMACEUTICALS
A growing market A large, solid and
for Pharmaceutical Commercial Synergies predictable market,
and Nutraceutical Presence in both segments with high barriers to
companies, adjacent to is a competitive advantage entry for new CDMOs
their core business
Ongoing mega-
Economically attractive Know-how and Technologies trend of Pharma
for all players in the Same Pharmaceutical forms companies to sub-
distribution chain contract and outsource
and technologies for the two manufacturing
areas generate production
cross-fertilization
QUALITY STANDARDS
Source: Management elaboration
21 /Investment highlights_ Leading Italian playerPerformance Relative
to Reference End-Markets
utraceuticals and Pharmaceuticals markets show high steady growth and resilience during recessions
N
F
ine Foods has substantially outgrown its reference end-markets in the last decade, with 2017 sales at
2.5x the 2008 level(1)
Revenues
120€m
300
250 Fine Foods
200 uropean Vitamins &
E
Dietary supplements
Revenues 48€m
150 uropean
E
Pharmaceuticals
100
2008 2009 2010 2011 2012 2013 2014 2015 2016 2017
Index 2008 =100
MARKET GROWTH + CDMO EXTRA - GROWTH + FINE FOODS GROWTH
11% FINE FOODS REVENUES CAGR
Sources: Euromonitor; Company data
(1) Methodology: the threae variables’ time series are divided by their respective 2008 value (the basis) and multiplied by a factor of 100; the considered variables are Fine Foods
revenues, European Nutraceuticals – Vitamins & Dietary Supplements segment size and European Pharmaceuticals market size
22 /Investment highlights_ Leading Italian playerAcquisition and Retention
of Key Loyal Customers
BEFORE 2002 2003 - 2010 AFTER 2010
RETAINED KEY CLIENTS ACQUIRED BEFORE 2002 AND ADDED SEVERAL NEW ONES AFTERWARDS
Source: Company data
23 /Investment highlights_ Customer LoyaltyRevenues Breakdown by Client Loyalty
Revenues growth generated by loyal(1) clients (€m)
New Customers
evenues growth from existing customers during the
R
Loyal Customers(1)
period > 46%
Equivalent to a 7.8% CAGR generated from loyal clients
113.0
77.6
2012 2017
Revenues/
0.8 1.1
client (€m)(2) Share of wallet almost doubled
SKUs/ during reference period
5.8 7.2
client (#)(2)
HISTORICALLY, FINE FOODS’ CUSTOMERS HAVE MAINTAINED A STRONG RELATIONSHIP, SUBSTANTIALLY
INCREASING THE PIPELINE WITH NEW PRODUCTS, NEW GEOGRAPHIES OR THE COMBINATION OF THE TWO
Source: Management elaboration | (1) Clients at least since 2012 | (2)Ordinary arithmetic mean, not weighed
24 /Investment highlights_ Customer LoyaltyCustomer Concentration
2017 CUSTOMERS IN % OF TOTAL REVENUES
14%
11%
75%
Top 5
Next 10
Other
Source: Management elaboration on Company data
25 /Investment highlights_ Customer LoyaltySuperior Technical Competence
STRONGEST TECHNICAL TEAM
QUALITY MANAGEMENT PARADIGM
AMONG ITALIAN CDMOS
8 people in Quality Assurance and Quality Control
4 387 Standard
17 people in R&D and industrialization 3,848 training hours Operating Procedures
in 2016 and Operating
Instructions
Recognized excellence in custom product Training Procedures
development as a key pillar of revenue growth:
• 1
28 Nutraceutical projects in 2017 Strong
- 29 new products in production Corporate
- 3-12 months from origination to production Culture
• 2
8 Pharmaceutical projects in 2017
- 18 new products in production Certifications Software
- 6-12 months from origination to production
Integrated and
Compliance with
traceable quality
the highest industry
management, at all
!
standards
No related expenditure has been capitalized decisional levels
65 employees dedicated to scientific activities, representing over 14% of total workforce
Source: Company Data
26 /Investment highlights_ Superior QualityFine Foods’ Certification Framework
C
ontinuously enhanced quality and sustainability management corroborates Fine Foods’ reputation with clients
In 2017 only, Fine Foods passed successfully 24 audits from customers and authorities
QUALITY SUSTAINABILITY
HEALTH AND
QUALITY FOOD SAFETY ENVIRONMENTAL
SAFETY
231
MEDICAL DEVICES ETHICAL
AIFA APPROVAL D.LGS. 231/2001
QUALITY STANDARDS
FINE FOODS GUARANTEES THE HIGHEST QUALITY AND RELIABILITY
ALONG ALL THE STEPS OF THE PROCESS
Source: Company Data
27 /Investment highlights_ Superior QualityFine Foods’
Special Attention to Human Resources
Time evolution of Fine Foods’ employees
500
+53 450
+31
+55 400
+21 +18
350
469
385 416
330 300
291 312
250
200
2012 2013 2014 2015 2016 2017
2017 employees’ 2017 employees’ 2017 women’s quota
satisfaction rate at retention rate at of white collars at
80% 97% 66%
Source: Company Data
28 /Investment highlights_ Superior QualityManufacturing Plants
Geographical Footprint
HQ PHARMACEUTICALS NUTRACEUTICALS
NEMBRO
BERGAMO
BREMBATE
ZINGONIA
MILAN
29 /Investment highlights_ Manufacturing FootprintNutraceutical
Plant Expansion - ZINGONIA
The operating complex covers a total area of 45,600 sqm
7.2€m in CAPEX over the 2016-2017 period
The planned expansion will increase the covered area by ca. 80%
Expected completion by 2018 year-end
Pre-existing covered area: 15,900 sqm Final covered area: 28,700 sqm
Source: Company Data | Note: all squared-meters data have been approximated to the nearest hundreds
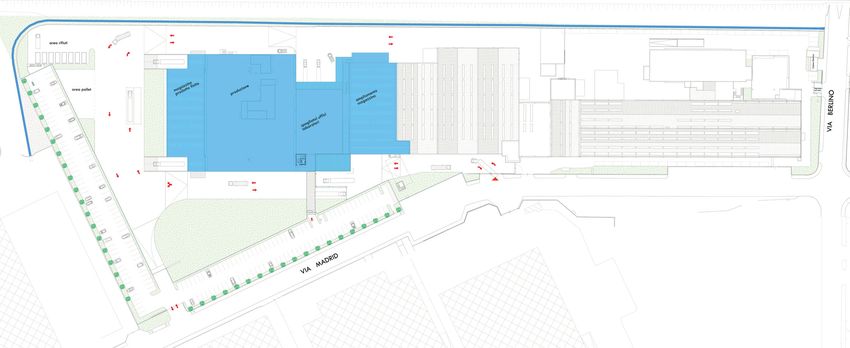
30 /Investment highlights_ Manufacturing FootprintPharmaceutical
Plant Expansion - BREMBATE
The operating complex covers a total area of 20,700 sqm
10.3€m in CAPEX over the 2016-2017 period
The planned expansion will increase the covered area by ca. 120%
Expected completion by 2018 year-end
Pre-existing covered area: 5,700 sqm Final covered area: 12,700 sqm
Source: Company Data | Note: all squared-meters data have been approximated to the nearest hundreds
31 /Investment highlights_ Manufacturing FootprintA Good Environment for a Bright Future
TTRACTIVE MARKET: the European Nutraceuticals and Pharmaceuticals markets are an
A
attractive long-term investment, thanks to their steady growth and resilience
TTRACTIVE POSITIONING: leading CDMOs focusing on specific technologies and customer
A
groups, with the intention to provide a “one-stop-shop” offering, are gaining market share
within the production value chain
PPORTUNITY TO BE A LEADER IN A CONSOLIDATING MARKET: current market
O
fragmentation will favor consolidators, with strong balance sheets and significant market shares
OPPORTUNITY
TO ENTER NEW ADJACENT MARKETS: significant cross-selling and production
cross-fertilization opportunities could be exploited
APITAL INJECTION: the totality of equity capital raised by Innova Italy 1 will support and
C
accelerate Fine Foods’ growth
Source: Management elaboration
32 /Investment highlights_GrowthStrong Potential Growth,
Organic and by M&A
ORGANIC GROWTH, LEVERAGING ON A LOYALTY-BASED
CLIENT PORTFOLIO, THAT WILL BENEFIT OF:
• NEW PRODUCTION CAPACITY
• CDMO INDUSTRY TRENDS
Along with the ongoing outsourcing
CDMOs’ clients want few, long-term,
trend in the Pharma industry,
reliable relations, with a preference for
CDMOs have been acquiring
nimble yet structured players
manufacturing assets
INORGANIC GROWTH IN ACQUISITION OF NEW
ADJACENT MARKETS. TECHNOLOGIES
MANY POTENTIAL TARGETS (I.E. SEMI-SOLIDS, LIQUIDS)
IN ITALY AND ABROAD IN EXISTING END-MARKETS
The CDMO industry is still very fragmented on the supply side;
Fine Foods will be in the right position to play the consolidator role
Source: Management elaboration
33 /Investment highlights_GrowthAgenda
Introduction
Investment highlights
Key Financials
Transaction overview
Appendix
34Attractive Revenues and
EBITDA Growth Profile...
+8.3%
CAGR ’15-’17:
REVENUES
ttractive revenues growth
A
119.6
102.0
113.1 driven by increasing volumes from
loyal clients and by a constant
inflow of new ones
2015 2016 2017
13.1% 13.4% 14.0% EBITDA margin
+11.6%
CAGR ’15-’17:
EBITDA
15.1
16.7(1) rofitability increase driven by
P
13.4
an improved product mix and
production costs optimization
2015 2016 2017 Adjusted
(1) €1.2m adjustment for extraordinary cost generated by the recent change of the IT system of the Company and plants’ expansion
Source: Company Data
35…Leading to Consistent Improvements
in Profitability
7.9% 8.2% 8.5% % on Revenues
+12.2%
CAGR ’15-’17:
EBIT
Consistent EBIT growth
10.2(1)
9.3
8.1
2015 2016 2017 Adjusted
5.2% 5.5% 5.9% % on Revenues
+15.7%
CAGR ’15-’17:
NET INCOME
6.2
7.1(1) Steady net income growth
5.3
2015 2016 2017 Adjusted
(1) 1.2€m adjustment for extraordinary cost generated by the recent change of the IT system of the Company and plants’ expansion; for Net Income, after-tax adjustment (0.9€m)
Source: Company Data
36Healthy Capital Allocation…
NET WORKING CAPITAL CAPEX
fficient working capital management, with
E I ncrease of Capex to support business
collection time structurally lower than payment expansion
time
WC% on 21.9
11.8% 11.4% 6.8%1 ORDINARY CAPEX IN TANGIBLES
Revenues
EXPANSIONARY CAPEX IN TANGIBLES
12.0 12.9 8.21 CAPEX IN INTANGIBLES
0,5
INVENTORY 13.61
13.9 10.0
11.7 14,1
TRADE 7.4
RECEIVABLES
15.0 17.0 0,3
TRADE 11.9
PAYABLES 0,3 3,4
1,5
(11.5)
(16.0)
(22.5) 6,3 7,3
5,7
2015 2016 2017 2015 2016 2017
(1) Adjusted adding back the effect of a stand-alone no-recourse (“pro soluto”) 2017 factoring transaction of 4.9€m
Note: the split between ordinary and expansionary capex is elaborated from Company management accounts
Source: Company Data
37…Coupled with a Strong Recurring
Free Operating Cash Flow
Free “Recurring” Operating Cash Flow
7.8
2017
15.31 Free Operating
7.5 14.1 Cash Flow
Operating Ordinary Recurring Free (6.6)
Cash Flow Capex Operating
Cash Flow Expansionary
Capex
6.6
2016
3.4
12.4 2.3
5.8
Operating Ordinary Recurring Free Expansionary Free Operating
Cash Flow Capex Operating Capex Cash Flow
Cash Flow
(1) Adjusted to do not include the effect of a stand-alone no-recourse (“pro soluto”) 2017 factoring transaction of 4.9€m
Note: the split between ordinary and expansionary capex is elaborated from Company management accounts
Source: Company Data
38Strong Balance Sheet
Net Financial Position
Strong net financial position(1) even after significant expansionary Capex
NFP / EBITDA Adj.
1.2x
1.3x
1.3x
19.3 20.4
17.8
2015 2016 2017
(1) Represented stand-alone; well under control even before the Business Combination
Source: Company Data
39Agenda
Introduction
Investment highlights
Key Financials
Transaction overview
Appendix
40Transaction Overview
THE BUSINESS COMBINATION WILL BE IN THE FORM OF A MERGER OF FINE FOODS INTO INNOVA ITALY 1
INNOVA ITALY 1 INVESTMENT WILL BE IN THE FORM OF 100% CAPITAL INCREASE (€100M)
Initial listing of Fine Foods on the AIM segment of the Italian Stock Exchange
Transition to IAS reporting targeted with 2018 financial statements
Admission to the MTA STAR segment targeted with 2018 financials in 2019
I nnova Italy 1 will support Fine Foods for future acquisitions, to enhance Fine Foods
growth through inorganic expansion in complementary business areas
Source: Management elaboration
41Preliminary Valuation
Valuation approach:
DCF and multiples
Equity Value: €120.0m
Net Financial Position (NFP)
2017: €20.4m
Valuation approach: Net Asset Value
Net Income adj. 2017: €7.1m
Innova Italy 1 NAV equal to €100
millions at Business Combination
Ebitda adj 2017: €16,7m
Implied Enterprise Value: €140.4m
Implied multiples on 2017 financials:
• EV/EBITDA adj. 2017: 8.4x
• P/E adj. 2017: 17.0x
Source: Management elaboration
42Current Shareholding Structures
FINE FOODS INNOVA ITALY 1
Cassa Forense 10.0%
Inarcassa 10.0%
Marco
Eigenmann Banque Pictet 5.8%
5%
Fondazione Carisbo 5.0%
Eigenfin Free Float
95% 69.2%
• # of ordinary shares: 10,000,000
• Total # of shares : 8,000,000 • # of special shares: 200,000
• o/w ordinary shares: 5,712,418
• o/w multiple volting shares (3x): 2,287,582 • Market Warrants: 5,000,000(1)
• Attribution: 2 Warrants assigned at Innova’s
• Main shareholder (through Eigenfin): IPO and additional 3 Warrants assigned at
• Marco Eigenmann: Chairman & CEO Business Combination
(1) Assuming 0% withdrawal
Source: Management elaboration
43Shareholding Structure Evolution
WITHDRAWAL EQUAL TO 0% WITHDRAWAL EQUAL TO 30%
% OF EQUITY CAPITAL AT €10 % OF EQUITY CAPITAL AT €10
SPAC Promoters 2.0% SPAC Promoters 2.3%
Ex-SPAC Ex-SPAC
Eigenfin Srl + M. Eigenfin Srl + M.
Shareholders Shareholders
Eigenmann 53.9% Eigenmann 62.2%
44.1% 35.6%
% OF VOTING RIGHTS AT €10 % OF VOTING RIGHTS AT €10
SPAC Promoters 1.0% SPAC Promoters 1.1%
Ex-SPAC Ex-SPAC
Eigenfin Srl + M. Eigenfin Srl + M.
Shareholders Shareholders
Eigenmann 65.1% Eigenmann 72.5%
33.9% 26.4%
Note: shareholding structure post Business Combination has been calculated taking into consideration the conversion of the first tranche of promoters’ Special Shares
Source: Management elaboration
44Corporate Governance
The Board of Directors of Fine Foods will be composed by 7 directors: 4 nominated by Fine Foods and 3 nominated
by Innova Italy 1
Innova Italy 1 will be represented in the board by: Fulvio Conti, Marco Costaguta and Paolo Ferrario
The current shareholders of Fine Foods will not sell any shares and will remain fully committed to the
management of the Company:
• Marco Eigenmann will be Chairman and CEO
• Giorgio Ferraris will be the CEO
BOARD OF DIRECTORS OF FINE FOODS AT BUSINESS COMBINATION
Marco Giorgio Adriano Federico
Eigenmann Ferraris Pala Oriani
CHAIRMAN CEO DIRECTOR DIRECTOR
and CEO
Fulvio Paolo Marco
Conti Ferrario Costaguta
DIRECTOR DIRECTOR DIRECTOR
Source: Management elaboration
45Transaction Timeline
Innova Italy 1 and Fine Foods Board of Directors to
07/06/2018
approve the transaction
Today’s
Investors
Presentation
Innova Italy 1 ordinary and extraordinary shareholders’
10/07/2018
meeting, in second call, to approve the transaction
End of the period for the exercise of the withdrawal
By
01/09/2018 rights and option rights by Innova Italy 1’s withdrawing
and remaining shareholders
Exp. Signing of the Merger Deed by Fine Foods
15/09/2018 and Innova Italy 1
Exp. MERGER OF FINE FOODS INTO INNOVA ITALY 1
01/10/2018 TO BECOME EFFECTIVE
Source: Management elaboration
46Agenda
Introduction
Investment highlights
Key Financials
Transaction overview
Appendix
47Fine Foods Positioning
in the Nutraceuticals Value Chain
CONCEPT REGULATORY
FORMULATION PRODUCTION DISTRIBUTION
DEVELOPMENT COMPLIANCE
PHARMA COMPANIES
NUTRACEUTICALS
IN-HOUSE
FOOD SUPPLEMENT COMPANIES
OUTSOURCED
CONTRACT DEVELOPMENT AND
MANUFACTURING ORGANIZATIONS (CDMOS)
Source: Management elaboration
48Fine Foods Positioning
in the Pharmaceuticals Value Chain
DRUG EARLY STAGE DOSSIER
PRODUCTION DISTRIBUTION
DISCOVERY DEVELOPMENT DEVELOPMENT
PHARMA COMPANIES (EXCLUDING GENERIC COMPANIES)
IN-HOUSE
PHARMACEUTICALS
GENERIC PHARMA COMPANIES
SPECIALIZED DRUG
DISCOVERY COMPANIES
OUTSOURCED
CONTRACT RESEARCH
ORGANIZATION (CROS)
CONTRACT DEVELOPMENT &
MANUFACTURING ORGANIZATIONS (CDMOS)
DISTRIBUTION
CONTRACT SALES ORG.
(CSOs)
Source: Management elaboration
49European CDMO Pharmaceutical Landscape
Fine Foods’ goal is to achieve a top European positioning, leveraging on (i) its business mix and solid business model,
and (ii) a strong financial position enabling inorganic growth
SELECTED FINE FOODS’ COMPETITORS AT EUROPEAN LEVEL – 2016 REVENUES (€M)
800
700
600
500
400
300
200
100
0
Hermes
Pharma
Fine
Foods
Synerlab*
SAS
Laboratories
Gilbert*
Cenexi
Aminolabs
NextPharma
Aesica
Corden
Pharma
Famar*
Vetter
Pharma
Recipharm**
Aenova
Unither
Pharma
Nutra
*Last available data (2015) ** Listed companies
Note: Corden Pharma’s and Cenexi SAS’s revenues have been estimated by reconstructing the Group’s CDMO entities
Source: Management elaboration on publicly retrievable selected information
50 /Investment highlights_ Attractive sectorOrganization Chart
469 FTE employees at 2017 year-end
PRESIDENT & CEO
CEO
Information
Technology Quality Unit
Director Director
Quality Unit
Human Director
Resources Assistant
Director
Quality Assurance Quality Assurance Quality Assurance Quality Control
Zingonia Plant Nembro Plant Brembate Plant Supervisor
Controller
Quality Control Quality Control
Zingonia Nembro
Administration, Research & Pharmaceuticals
Pharmaceutical Commercial Medical Devices Supply Chain Technical Services
Food Plant Director Finance & Personnel Development Activities
Plants Director Director Director Director Director
Director Director Director
Health Safety Pharmaceutical
Environment Development
Food Plant Scientific & Regulatory
Director Technology and
Assistance Engineering
Assistant Industrialization
Production Production Production Planning Pharma. Planning Food Qualified Person Qualified Person
Warehousing Purchasing
Brembate Plant Nembro Plant Verdellino Plant Production Production Nembro Plant Brembate Plant
FINE FOODS LEVERAGES ON A SOLID ORGANIZATIONAL STRUCTURE EMPOWERING KEY MANAGERS
Source: Company data
51Fine Foods’ Skilled
and Strong Management Team (1/2) Source: Company data
Marco • Aged 58, Mr. Eigenmann joined the Company in 1992
Eigenman • He started his career at Eigenmann & Veronelli, the family business involved
in trading of raw materials for food, Pharma and cosmetic industries
CHAIRMAN
and CEO
Giorgio • Aged 60, Mr. Ferraris joined Fine Foods in 2013
Ferraris • In 2013 he was appointed Board of Directors Member of Mondoconvenienza,
left in 2014 to focus on Fine Foods
CEO
• Previously, Mr. Ferraris worked for CTI INVEST as M&A General Manager of
the Italian packaging division, and for Mondadori Printing
• Between 1995 and 2003 he worked in New Jersey as Executive VP in the
specialty chemical sector
• Mr. Ferraris graduated in Pharmacy and attended executive programs at
Harvard Business School
Pietro • Aged 54, Mr. Bassani was appointed CFO of Fine Foods in 1998
Bassani • From 1993 to 1998, he worked as Administration and Finance Director for La
Metallurgica S.r.l. and Vamp Technologies S.r.l.
CFO
• He is a qualified accountant (“Dottore Commercialista”)
• He graduated in Business Administration
52Fine Foods’ Skilled
and Strong Management Team (2/2) Source: Company data
Cesare Dognini • Mr. Dognini joined the company in 1997
Quality Unit Director • Previously worked as quality control manager at Mitim (currently Recipharm)
• Graduated in Pharmaceutical Chemistry and Technology
Alghisio Orizio • Mr. Orizio joined the company in 2017
Pharma Plants Director • Previously worked as plant director at Mitim (currently Recipharm)
Daniele Sala • Mr. Sala joined the company in 2001
Food Plant Director • Previously worked at Nestlé in the quality assurance department
• Graduated in Food Science and Technology
Mario Barbini • Mr. Barbini joined the company in 2009
Pharma Activities Director • Previously worked as technical operations manager at Fedegari Autoclavi
• Graduated in Pharmaceutical Chemistry and Technology
Marina Pasquino • Ms. Pasquino joined the company in 2004
R&D Director • Previously worked at SIIT and Dompé
• Graduated in Pharmaceutical Chemistry and Technology
Lorenzo Cremonesi • Mr. Cremonesi joined the company in 2014
Supply Chain Director • Previously worked at Mipharm and Olon as procurement manager
Mario Ruscitto • Mr. Ruscitto joined the company in 2002 in the IT department, acquiring
IT Director growing responsibilities up to current
53Fine Foods’ Key Valuation Metrics
2017 ADJUSTMENTS (€k)
VALUATION
DCF AND MULTIPLES EBITDA 2017 15,522
APPROACH
One-time costs due to the recent
837
change of the IT system
One-time costs due to plants’
374
expansion
• Equity value of the Target: EBITDA Adj. 2017 16,733
€120.0m EBIT 2017 8,963
One-time costs due to the recent
• Bridge to Enterprise Value: €20.4 837
change of the IT system
•N et debt at December 2017
€20.4m One-time costs due to plants’
374
expansion
TRANSACTION
DETAILS • Implied Enterprise Value: EBIT Adj. 2017 10,174
€140.4m
Net Income 2017 6,187
• Implied multiples on 2017 One-time costs due to the recent
837
financials: change of the IT system
•E
V/EBITDA adj. 2017: 8.4x One-time costs due to plants’
374
•P
/E adj. 2017:17.0x expansion
IRES+IRAP marginal impact (338)
Net Income Adj. 2017 7,060
Source: Management elaboration
54Key Terms Proposed
for the Business Combination
Source: Management elaboration
Target Company: Fine Foods & Pharmaceuticals N.T.M. S.p.A. (“FF&P”, or the “Target”)
Equity Value: €120m
€100m cash injected entirely in capital increase
# of Warrant for FF&P shareholder: 4,000,000, o/w 100% exercisable at stock price equal to €13.0, for 15 days out of 30 trading days, in three years
starting from the Business Combination; if this condition is not met, 25% of the Warrants becomes exercisable if stock price reach €14.0, for 15 out of 30
days during the fourth or the fifth year from Business Combination, and the remaining 75% becomes exercisable during the sixth year, any time subject
to a strike price of €9.5 and a cap of €13. Warrants underlying shares’ underwriting pricing is initially set at €0.1 per share, which can be subsequently
raised up to €7.0 through a resolution of the BoD, provided that certain conditions set forth in the “Documento Informativo” are met
Triple vote shares to reach 65.1% voting rights (share swap conditional on any M&A transaction), assuming 0% withdrawal corresponding to n.
3,500,000 triple vote shares
Stock grant plan for FF&P management team (excluding the Chairman): 440,000 shares underlying an incentivizing stock grant plan, based on
EBITDA growth and share price evolution. To be defined by the new Board of Directors, after business combination
Board Members post BC: Conti, Costaguta, Ferrario, Eigenmann, Ferraris, Pala, Oriani
Lock-up for current shareholders of the Target: 20 months
Trans listing on MTA expected with 2018 financials in H1 2019s
“Documento Informativo”, ex-Art. 14 of the Innova Italy 1 by-laws, includes financial data as follows (ITA GAAP):
• SPAC financial data as of 31.12.2017
• Target’s financials as of 31.12.2017 compared to 2016
• Target’s financials as of 31.12.2016 compared to 2015
• Pro-forma financials as of 31.12.2017
55Transaction Working Team
Nomad Business DD
inancial
F
ccounting
A
Advisor
and Tax DD
Fine Foods
egal Counsel
L egal Counsel
L
Fine Foods Innova
uditor
A
Auditor Innova
Fine Foods
56You can also read