INVESTOR PRESENTATION - NYSE: BERY August 2019 - Berry Global

Page created by Ruben Benson
 
CONTINUE READING
INVESTOR PRESENTATION - NYSE: BERY August 2019 - Berry Global
Always Advancing To Protect What’s Important

           INVESTOR PRESENTATION
                                       August 2019
                                        NYSE: BERY
INVESTOR PRESENTATION - NYSE: BERY August 2019 - Berry Global
Safe Harbor Statements
Forward-Looking Statements
Statements in this presentation that are not historical, including statements relating to the expected future performance of the Company, are considered “forward looking” and are presented pursuant to the safe harbor
provisions of the Private Securities Litigation Reform Act of 1995. You can identify forward-looking statements because they contain words such as “believes,” “expects,” “may,” “will,” “should,” “would,” “could,” “seeks,”
“approximately,” “intends,” “plans,” “estimates,” “anticipates,” “outlook,” or “looking forward,” or similar expressions that relate to our strategy, plans or intentions. All statements we make relating to our estimated and
projected earnings, margins, costs, expenditures, cash flows, growth rates and financial results or to our expectations regarding future industry trends are forward-looking statements. In addition, we, through our senior
management team, from time to time make forward-looking public statements concerning our expected future operations and performance and other developments. These forward-looking statements are subject to risks
and uncertainties that may change at any time, and, therefore, our actual results may differ materially from those that we expected.
Important factors that could cause actual results to differ materially from our expectations, which we refer to as cautionary statements, are disclosed under “Risk Factors” and elsewhere in our Annual Report on Form 10-K
and subsequent filings with the Securities and Exchange Commission, including, without limitation, in conjunction with the forward-looking statements included in this release. All forward-looking information and subsequent
written and oral forward-looking statements attributable to us, or to persons acting on our behalf, are expressly qualified in their entirety by the cautionary statements. Some of the factors that we believe could affect our
results include: (1) risks associated with our substantial indebtedness and debt service; (2) changes in prices and availability of resin and other raw materials and our ability to pass on changes in raw material prices on a timely
basis; (3) performance of our business and future operating results; (4) risks related to acquisitions, integration of acquired businesses and their operations (including the acquisition of RP Group Plc (“RPC”), and realization of
anticipated cost savings and synergies; (5) reliance on unpatented proprietary know-how and trade secrets; (6) increases in the cost of compliance with laws and regulations, including environmental, safety, and production
and product laws and regulations; (7) risks related to disruptions in the overall economy and the financial markets that may adversely impact our business; (8) risk of catastrophic loss of one of our key manufacturing facilities,
natural disasters, and other unplanned business interruptions; (9) risks related to market acceptance of our developing technologies and products; (10) general business and economic conditions, particularly an economic
downturn; (11) risks that our restructuring programs may entail greater implementation costs or result in lower cost savings than anticipated; (12) ability of our insurance to fully cover potential exposures; (13) risks of
competition, including foreign competition, in our existing and future markets; (14) uncertainty regarding the United Kingdom’s withdrawal from the European Union and the outcome of future arrangements between the
United Kingdom and the European Union; (15) risks related to the phase-out of the London Interbank Offered Rate (LIBOR), or the replacement of LIBOR with a different reference rate or modification of the method used to
calculate LIBOR;] (16) new legislation or new regulations and the Company’s corresponding interpretations of either may affect our business and consolidated financial condition and results of operations;(17) potential failure
to integrate recent acquisitions successfully and to realize the intended benefits, including, without limitation, the inability to realize the anticipated cost synergies in the anticipated amounts or within the contemplated
timeframes or cost expectations, the inability to realize the anticipated revenues, expenses, earnings and other financial results and operational benefits, and the anticipated tax treatment; (18) risks related to international
business, including as a result of the RPC transaction, including foreign currency exchange rate risk and the risks of compliance with applicable export controls, sanctions, anti-corruption laws and regulations; and (19) the
other factors discussed under the heading “Risk Factors” in our Annual Report on Form 10-K and subsequent filings with the Securities and Exchange Commission. We caution you that the foregoing list of important factors
may not contain all of the material factors that are important to you. Accordingly, readers should not place undue reliance on those statements. All forward-looking statements are based upon information available to us on
the date of this release. We undertake no obligation to publicly update or revise any forward-looking statement as a result of new information, future events or otherwise, except as otherwise required by law.
This presentation should be read together with “Management’s Discussion and Analysis of Financial Condition and Results of Operations” and the consolidated financial statements and the related notes thereto included in
our public filings.
Non-GAAP Financial Measures
This presentation includes certain non-GAAP financial measures such as operating EBITDA, adjusted EBITDA, adjusted net income, and free cash flow intended to supplement, not substitute for, comparable measures under
generally accepted accounting principles (GAAP). Investors are urged to consider carefully the comparable GAAP measures and the reconciliations to those measures provided in our earnings release, presentations, and SEC
filings. For further information about our non-GAAP measures, please see our earnings release, SEC filings and supplemental data at the end of this presentation.
Website Information
We often post important information for investors on our website, www.berryglobal.com, in the “Investor Relations” section. We use this website as a means of disclosing material, non-public information and for complying
with our disclosure obligations under Regulation FD. Accordingly, investors should monitor the Investor Relations section of our website, in addition to following our press releases, SEC filings, public conference calls,
presentations, and webcasts. The information contained on, or that may be accessed through our website, is not incorporated by reference into, and is not a part of this document.
No profit forecast
Nothing contained herein shall be deemed to be a forecast, projection or estimate of the future financial performance of Berry or the combination of the recent RPC acquisition, unless otherwise stated.
Presentation of Combined Information
The combined financial information set forth herein has not been prepared in accordance with Article 11 of Regulation S-X but rather represents a simple combination of Berry’s results with the results of RPC. RPC’s results
have been prepared and reported in accordance with IFRS and converted into US dollars based on an exchange rate of $1.00 USD to 1.3451 GBP, the average daily closing rate for the LTM period as of September 30,
2018. Combined financial information pursuant to Article 11 could differ materially from the combined inform.
LTM Information
LTM information presented herein is the Last Twelve Months of reported information as of the date represented.
Certain information included in this presentation has been sourced from third parties. Berry does not make any representations regarding accuracy, completeness or timeliness of such third party information. Permission to
cite such information has neither been sought nor obtained.

   2
INVESTOR PRESENTATION - NYSE: BERY August 2019 - Berry Global
BERRY OVERVIEW

3
INVESTOR PRESENTATION - NYSE: BERY August 2019 - Berry Global
Who is Berry?

    A Leading Global Supplier Of Value-Added Protective Solutions

     ~$13 B Annual                             +290 Facilities            13,000+              100,000+
       Revenues*                                Worldwide*               Customers               Items

          Low cost
      manufacturer of                                     Strong, growing, and         Proven long-term
       products used                                      predictable free cash       acquisition strategy
     everyday in stable                                            flow              with a robust pipeline
        end markets

                                               Blue Chip Customers Include

4     * Pro forma data includes the Laddawn and RPC acquisitions.
INVESTOR PRESENTATION - NYSE: BERY August 2019 - Berry Global
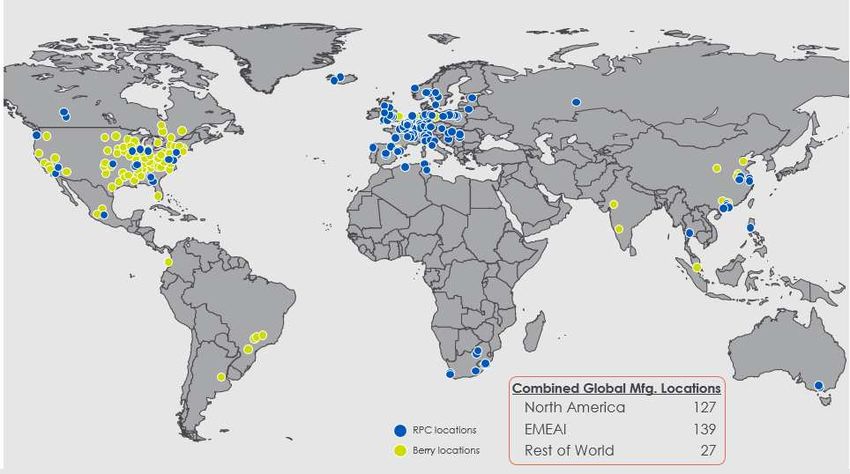
Four Complementary Segments
                                                            Berry Revenue: ~$13B                                    (1)

     Consumer                                  Consumer
    Packaging -                               Packaging -                                      Health, Hygiene                                   Engineered
    International                            North America                                      & Specialties                                     Materials

    37% of Revenue(1)                            20% of Revenue                                     22% of Revenue                              21% of Revenue(1)

      Revenue(1)                                      Revenue                                            Revenue                                  Revenue(1)
         $4.9B                                           $2.6B                                              $2.8B                                     $2.7B
• Containers                                •    Closures                                      •    Diapers                                   • Consumer and
• Closures                                  •    Drink cups                                    •    Adult incont.                               industrial flexible
• Bottles                                   •    Bottles                                       •    Feminine care                               packaging
• Consumer and                              •    Prescription vials                            •    Medical garments                          • Industrial &
  industrial flexible
                                            •    Containers                                    •    Disinfectant wipes                          specialty tapes
  packaging
                                            •    Tubes                                         •    Dryer sheets                              • Can liners
• Medical devices
                                                                                               •    Filtration
• Recycling & waste
  mngt. solutions

          (1)   Pro forma revenue includes the RPC acquisition as of 09/30/18 LTM in the Consumer Packaging –International division and the
                Laddawn acquisition in the Engineered Materials division
          -Revenue is for the twelve months ended June 2019 for CP –North America, HH&S and Engineered Materials
5         -Berry produces components of some of the products in the HH&S segment
INVESTOR PRESENTATION - NYSE: BERY August 2019 - Berry Global
Why Berry Global?

       Leadership Position With Scale

           Consistent Free Cash Flow

            History of Revenue and EBITDA Growth

            Unique Long-Term M&A Strategy With Proven Track Record

           Margin Stability Across Input Cost Cycles

       Serves Stable End Markets With Favorable Long-Term Dynamics

     ..…We Are Continuing The Same Strategy We Have Always Done
6
INVESTOR PRESENTATION - NYSE: BERY August 2019 - Berry Global
Significant Scale Advantages
                            Largest resin buyer with ~7 billion lbs procured annually
                            Leadership position across the majority of our portfolio
                            The most expansive product offering and global footprint
                            Low cost manufacturer – sustainable competitive advantage
Leadership Position With Scale

     Consistent Free Cash Flow
                                                                                                                   Revenue
                                                                               ~$13.0              ~ $13.0
       History of Revenue and EBITDA
       Growth
                                                                   $12.0
       Unique M&A Strategy With
       Proven Track Record

                                                                   $10.0
     Margin Stability Across Input Cost
     Cycles

Serves Stable End Markets With
                                                                     $8.0
Favorable Long-Term Dynamics
                                                                                                                       $5.4
                                                                                                                                       $4.7   $4.5
                                                                     $6.0

                                                                     $4.0                                                                            $2.8

                                                                     $2.0

                                                                      $-
                                                                                   BERY              AMC               SON             SEE    SLGN   ATR

               Berry revenue represents pro forma for most recent acquisitions. Competitor group represents plastic producing peers.
               Competitor group revenue based on recent public LTM revenue
7
INVESTOR PRESENTATION - NYSE: BERY August 2019 - Berry Global
Consistent Free Cash Flow
                                               5-year free cash flow CAGR of 21%
                                               Exceeded free cash flow guidance every year since IPO
                                                                                                     Free cash flow yield (1)                  ~12%            ~14%       ~16%

                                                                                                                                                                          $900+
Leadership Position With Scale                                                                                                                                  $800

     Consistent Free Cash Flow
                                                                                                                                                $665
                                                                                                                               $634
       History of Revenue and EBITDA
       Growth
                                                                                                               $601

       Unique M&A Strategy With                                                                $517
       Proven Track Record

                                                                                $436
     Margin Stability Across Input Cost
     Cycles

Serves Stable End Markets With
Favorable Long-Term Dynamics                                  $302

                                                         FY 2014         FY 2015         FY 2016          FY 2017         FY 2018          LTM    FY 2020 E Normalized
                                                                                                                                          Jun-'19

                                                                                                Guidance                Actual

       Berry’s LTM FCF yield is ~12% – still well above the peer group average of
INVESTOR PRESENTATION - NYSE: BERY August 2019 - Berry Global
Strong Financial Performance Track Record
                                                                           Revenue                                             Operating EBITDA
                                                                                                       $7,869                                     $1,380
                                                                                                                      $1,400
                                                $8,000
                                                $7,000                                                                $1,200
                                                $6,000                                                                $1,000
Leadership Position With Scale
                                                $5,000                                                                 $800
                                                $4,000
                                                                                                                       $600
     Consistent Free Cash Flow
                                                $3,000
                                                                                                                       $400
                                                $2,000
       History of Revenue and EBITDA            $1,000        $196                                                     $200    $35
       Growth
                                                    $0                                                                   $0
       Unique M&A Strategy With                                1997       2001       2006      2011    2018                    1997 2001 2006 2011 2018
       Proven Track Record

     Margin Stability Across Input Cost
     Cycles
                                                Adjusted Earnings Per Diluted Share                                            Shareholder Returns
Serves Stable End Markets With
Favorable Long-Term Dynamics
                                                 $3.50                                                 $3.37
                                                                                               $3.09
                                                 $3.00
                                                                                       $2.48
                                                 $2.50

                                                 $2.00                         $1.70
                                                                      $1.56
                                                 $1.50      $1.32                                               $16
                                                 $1.00
                                                                                                                IPO                                       Current
                                                             2013 2014 2015 2016 2017 2018

              Proven Track Record of Net Sales, Earnings, and Shareholder Return Growth
               Dollars in millions, except per share data
9              Represents fiscal revenue and operating EBITDA for respective years
INVESTOR PRESENTATION - NYSE: BERY August 2019 - Berry Global
Robust Acquisition Pipeline + Fragmented Markets
                                                      Completed 46 acquisitions to date
                                                      Average ~5% cost synergies of acquired targets revenue

                                                             Rigid Plastics                               Flexible Plastics                       Nonwovens
Leadership Position With Scale

     Consistent Free Cash Flow

                                            N.A.
                                                                                  27%                                             24%                    29%
       History of Revenue and EBITDA        only
       Growth                                                                                                                                    40%
                                                              49%                                               49%                                            Global
       Unique M&A Strategy With
       Proven Track Record
                                                                                                                                  27%
                                                                               24%                                                                     30%
     Margin Stability Across Input Cost
     Cycles

Serves Stable End Markets With
Favorable Long-Term Dynamics

                                                                                     Top 3                        #4 -10                    #11 -100

                                                                      We Believe There Will Be Decades Of
                                                                    Consolidation Opportunities In A Growing
                                                                                   Substrate
               Source: Plastics News (N.A. only) and Nonwoven Industry Magazines
               Note: Rigid Plastics includes thermoforming, blow molding and injection molding. Flexible Plastics includes film and sheet
10
Resin Is a Pass-Through
                                                               Over the past 8 quarters resin volatility was >40%;
                                                                     BERY margins remain in a tight range
                                                          90

Leadership Position With Scale                            80

     Consistent Free Cash Flow
                                                          70
                                           Cents per LB

       History of Revenue and EBITDA
       Growth
                                                                                                                                              PE Price
       Unique M&A Strategy With                           60
       Proven Track Record                                                                                                                    PP Price
                                                                                                                                              LTM EBITDA
     Margin Stability Across Input Cost
     Cycles                                                    18.7%   18.7%                                                                  Margin
                                                          50                     18.5%        18.2%   18.0%   17.5%   17.4%   17.5%   17.4%
Serves Stable End Markets With
Favorable Long-Term Dynamics

                                                          40

                                                                                  Resin – Primary Raw Material
                                                          • Resin comprises approximately 50% of COGS
                                                          • ~70% of resin pounds sold are on contractual pass through
                                                          • ~7 billion pounds of resin purchased annually
                                                          • Approximately 55% of our buy is polyethylene and 40% is polypropylene
11                Assumes two month timing lag on PE and PP costs. Inclusive of RPC acquisition
Growing Substrate
                                                   2000                                               2015                         2025 E
                                          Global Packaging Market                            Global Packaging Market      Global Packaging Market

Leadership Position With Scale
Scale-Based Global Plastic
     And Recycled Packaging Franchise

13
Compelling Acquisition Rationale
                  Transformational complementary combination creates a global leader in plastic packaging
                   with enhanced growth opportunities

 Strong           Unmatched value creation opportunity for Berry shareholders, underpinned by strong
Strategic          industrial logic and powerful synergies
  Merit
                  Ability to leverage combined know-how in material science, product development and
                   manufacturing technologies across resin-based consumer, industrial and healthcare
                   applications

                  Balanced franchise across geographies, markets and substrates
Long-term
 Benefits         Well-positioned for sustainable plastics and recycling paradigm
 to Berry
                  Differentiated global M&A platform providing further long-term growth/consolidation
                   opportunities

                  Sales and EBITDA increase by ~60% respectively, inclusive of $150 million of expected
                   annual cost synergies
Attractive
Financial         Combined revenue and Adjusted EBITDA of approximately $13 billion and >$2 billion,
  Profile          respectively

                  Accretive to earnings and free cash flow

                Establishes One Of The World’s Largest, Value-Added Providers
                         Of Plastic Packaging And Recycled Solutions
             Note: Combined revenue and Adjusted EBITDA assumes LTM 03/30/19 for Berry and LTM as of 9/30/18 for RPC including an expected $150 million of
14           annual cost synergies.
Global Presence and Scale in Key Regions

15      Source: Company filings, company websites
Enhanced Ability to Serve Customers
Large Multi-National Blue-Chip Customer Base Supported By Thousands Of Smaller, Local Customers

        Common Approaches
 Global reach, quality and service
 Long-term relationships
 Disciplined cost management
 Differentiated standardization
     and customization capabilities

 Premium, low-cost and
     sustainable solutions

 Local, in-market presence
 Deep product breadth and selection

                              Significant Capabilities And Solutions Serving An
                                      Attractive Global Customer Base

16           Note: Customer logos may be registered trademarks of their respective owners
Compelling Synergy Opportunity
                             Expected Synergies                                                                  Synergy Overview
                                                          $ 30              $ 150
                                                                                                Categories                       Description
                                                                                          1
                                $ 45
                                                                                               Sourcing
                                                                                                Sourcing//
                                                                                                                         •   Resin, chemical,
                                                                                                                             corrugated, MRO and
                                                                                              Procurement
                                                                                              Procurement                    Freight

                                                                                          2                              •   Professional services,
         $ 75                                                                                       SG&A                     corporate redundancies,
                                                                                                    SG&A
                                                                                              (subject to any required       overlapping sales
                                                                                                    consultation)            functions & regional
                                                                                                                             structure redundancies

                                                                                          3                              •   Footprint
                                                                                                                             maximization/rationalizati
                                                                                                                             on, formulation sharing,
                                                                                              Operational
                                                                                              Operational                    capacity shifting & best
                                                                                                                             practices & network
                                                                                                                             capacity
1    Sourcing /          2 SG&A                 3 Operational           Total Synergies
    Procurement

                Synergy Target Supported By Track-Record of Achieving Initial
                                    Synergy Estimates

                  Note: Dollar amounts in millions. Company estimates
    17
Free Cash Flows
      Strong and Consistent Free Cash Flow                                                                                    Free Cash Flow
                                                                                                                                                               FY 2020
                                                                          $900+                                                                               Guidance
                                                                  $800
                                                                                                    Operating EBI TDA                                         $    2,150

                                                                                                     Capital expenditures                                          (600)
                                                      $665
                                          $634
                              $601                                                                   Cash interest expense                                         (500)

                                                                                                     Taxes                                                         (160)
                   $517
                                                                                                     Working capital, restructuring & other                          (90)
          $436
                                                                                                    Free cash flow                                            $     800

  $302
                                                                                                     Less: Restructuring & integration costs                          75

                                                                                                     Add: Additional synergies                                        75
FY 2014 FY 2015 FY 2016 FY 2017 FY 2018            LTM FY 2020 E Normalized
                                                  Jun-'19                                            Tax impact on normalization adj's                               (40)
                    Guidance         Actual                                                         Normalized free cash flow                                 $     910

                           $900+ million of Normalized Free Cash Flow

                 Note: Dollar amounts in millions.
                 Normalized free cash flow is expected free cash flow assuming the achievement of expected cost synergies and the exclusion of restructuring and
 18              integration costs associated with achieving synergies, on a tax adjusted basis.
Targeted Leverage and Historical De-levering Path
                   Ability to Rapidly De-lever Post Acquisition While Still Investing In the Business

Share Price - $15.20                                                 $33.36          $31.29                                         $48.39

  FCF -                ~$250M                                         $436M                                                         $634M                        $900M+*

                 6.0

                          5.2x                                                          5.1x
                 5.0                     4.8x                                                                                                        ~4.9x
                                                                                                                                                     ~4.8X
                                                         4.6x                                           4.5x
                                                                         4.2x
Appendix: Current Topics

20
Fiscal Year 2020 Guidance
                    Fiscal Year 2020
                                                                    Capital Allocation Strategy
               Free Cash Flow Guidance

     Free cash flow                                $800         •   Debt paydown – targeting leverage
     Capital expenditures                           600             below 4x
     Cash interest expense                          500
                                                                •   Organic growth investments
     Taxes                                          160
     Working capital & other costs                    90

     Cash flow from operations                    $1,400
     Less: capital expenditures                     (600)
     Free cash flow                                $800

                                    Key Objective - Maximize Shareholder Value

        Note: Dollars in millions
21
Lightweight Products
     Plastic packaging has a lower overall environmental impact than alternatives

     If plastic packaging was replaced with alternatives, like paper, metal, and glass:

      Plastic                                                                                   Alternative Packaging Materials

                             Alternatives would require 2x
                              as much energy as plastics

                             Alternatives would require 6x
                              as much water as plastics

                              Alternatives would generate
                               5x as much solid waste as
                                         plastics
                    Alternatives would generate 4x as much
                      greenhouse gas emissions as plastics

                           o Alliance To End Plastic Waste (AEPW)
                           o “Impact 2025”
                           o Signs Ellen MacArthur Foundation Global Commitment

22          Source: LIFE CYCLE IMPACTS OF PLASTIC PACKAGING COMPARED TO SUBSTITUTES IN THE UNITED STATES AND CANADA: Theoretical
            Substitution Analysis. Prepared for the Plastics Division of the American Chemistry Council (ACC) by Franklin Associates,
Segment Opportunities & Trends
      Consumer              Consumer             Health,
     Packaging -           Packaging –         Hygiene &           Engineered
     International        North America        Specialties          Materials

 One-stop shop          One-stop shop     Emerging           E-commerce
                                             markets (higher
                                              growth GDP)
 Product design         Design                                Material
  & innovation            flexibility       Rising middle       science
                                             class
 Sustainability         Clarity and       Infection          Improved load
  across supply           sustainability     prevention          management
  chain                                     Adult Incont.
                                             growth             Film strength
                         Convenience
 Convenience
 A global consumer packaging platform

                     Advantaged Products In Targeted Markets
23
Appendix: Our Business

24
Our Leadership

                 Tom Salmon                                    Mark Miles
               Chairman & CEO                                CFO & Treasurer
      Passionate leader focused on improving        Disciplined and financially driven leader
     Berry’s financial performance, creating an   highly focused on creating long-term value
        entrepreneurial-like workplace while                        for Berry
           helping our customers succeed

     •   Named CEO February 2017                  •   Named CFO January 2014
     •   Prior 11 years with Berry: various       •   Previous 10 years with Berry as EVP,
         leadership roles, including President        Controller and Treasurer
         and COO; led both Engineered             •   Started with Berry in 1997 as
         Materials and Consumer Packaging             Corporate Controller
         divisions                                •   Integral part of management for 36 of
     •   Prior experience includes leadership         Berry’s 45 acquisitions
         roles at Tyco Adhesives, Honeywell
         and General Electric

25
Total Company – End Markets and Regions
             Revenue by End Markets:                                       Revenue by Regions:
      Non-Woven Spec.                                                                     South
      Materials & Tech.                                                                  America
                                                                              Asia Pac
        Components                                                                            3%
                          13%                  Health Care &                             4%
                                                 Hygiene
     Non-food                           27%
                 8%

Engineered   14%                                                              39%
                                                                                                    54%
 Materials
                                                                      EMEAI
                 1%                     22%                                                           North
                                               Food                                                  America
        Retail           15%
                 Beverage

                                • ~65% of sales in stable, consumer-oriented end markets
                                • Leadership market position across the majority of our portfolio

26           Berry estimates
Segment Breakdown – End Markets and Regions
                           Consumer                       Consumer
                          Packaging -                    Packaging-                Health, Hygiene &                                 Engineered
                          International                 North America                 Specialties                                     Materials

                 Beverage                             Beverage                   Healthcare/                                   Ag & Other
                                               Food                                                   Personal care/
                                                                        Food     Medical                                                              Distribution
                                                                                                      Hygiene                           6%
                                                                                                                           Retail
                             17%
                                           28%           27%                               16%                                       12%
Revenue by
                                                                       40%                                                                          33%
End Markets:           15%
                                                                                                        52%                    17%
          Personal
          & Health                                                                      32%                            Industrial/
          Care              13%         27%
                                                                                                                       B&C
                                                            33%                Industrial/ Tech.                                         32%
                                               Non-                            Specialties
                   Technical
                                               Food                                                                                                Food &
                   Components                            Personal &
                                                                                                                                                   Beverage
                                                         Health Care

                                 7%                                                                                                          1%
                         3%
                                                                                               9%
                                                                                                                                        4%
                                      12%
Revenue by                                                                             14%
Regions:
                                                                                                           52%

                                                                                        25%
                                  78%                                                                                                        95%

                      North America     EMEA                                        North America   EMEA                     North America    EMEA    Asia Pac
                      ROW               Asia Pac                                    South America   Asia Pac

   27          Berry estimates
Consumer Packaging – North America
                           Containers                   Closures    Drink Cups   Bottles

 Product
 Examples

                              Airlite                    Aptar         Dart       Alpha
                                IPL                    Reynolds      LidWorks     Amcor
Competitors
                          Polytainer                   Mold-Rite     Reynolds    Reynolds
                                                        Silgan                    Silgan

                               Tubes                     Rx Vials    Overcaps      Jars

 Product
 Examples

                              Albea                    Apothecary      Aptar      Alpha
                                                        Products                 Mold-Rite
                               CCL                                    Cobra
                                                         Centor
Competitors                   Essel                                  Dubuque     Intrapack
                            Propack                     Tri State                Omega
                                                                    Underwood
                               Viva

 28     Not inclusive of all products or competitors
Engineered Materials
                          Stretch Films                Can Liners    Tapes        Converter Films

 Product
 Examples

                            Inteplast                     Aluf        3M              Amcor
                            Malpack                    Inteplast      IPG          Charter NEX
Competitors
                            Paragon                    Novolex       Scapa          Next Gen
                              Sigma                     Sigma       Shurtape        Sealed Air

                           Shrink Films                Food Films   Retail Bags      PVC Films

 Product
 Examples

                        All American                    Amcor         Clorox          Anchor
                             Amcor                     Printpack    Polyamerica      Fine Pkg
Competitors             Colormasters                   Sealed Air    Reynolds        Polyvinyl
                             Hillside                   WinPak                       Reynolds

 29     Not inclusive of all products or competitors
Health, Hygiene & Specialties
                                                                                       Surgical Products &   Pharmaceutical
                             Diapers                   Feminine Care   Adult Incont.
                                                                                       Medical Packaging     & Rigid Medical

 Product
 Examples

                             Avgol                        Avgol           Avgol            Ahlstrom-
                                                                                                              Gerresheimer
                              Fitesa                                      Fitesa           Munksjö
                                                          Fitesa
Competitors                                                                                  Amcor               Nypro
                            Gulsan                        Pegas           Gulsan
                                                                                                                  West
                              Toray                                       Pegas              Fitesa           Pharmaceutical
                                                           RKW
                                                                                             SAAF

                               Wipes                     Filtration    Geosynthetics       Ag & Other        Building Wraps

 Product
 Examples

                                                                        Low & Bonar           Fitesa
                        Jacob Holm                      Freudenberg                                            Barricade
                                                                           Naue               Mogul
                             Sandler                      John                                                  DuPont
Competitors                                              Mansville        TenCate            Owens
                           Spuntech                                                                            Kingspan
                                                                                             Corning
                                                           Mogul           Thrace
                          Suominen
                                                                                             TenCate

 30     Not inclusive of all products or competitors
Appendix: Sustainability

31
Alliance To End Plastic Waste (AEPW)
     •   Nearly 30 global companies from the plastics and consumer goods value chain
     •   Goal to deploy $1.5 billion to solutions over the next five years
     •   The Alliance will develop and bring to scale solutions that will minimize and manage plastic waste
         and promote solutions for used plastics by helping to enable a circular economy

           •   Infrastructure development – to collect and manage waste and increase recycling
           •   Innovation – to advance and scale new technologies that minimize waste, make recycling
               and recovering plastics easier, and create value from all post-use plastics
           •   Education and engagement – of governments at all levels, businesses, and communities to
               mobilize action; and,
           •   Clean up – of concentrated areas of plastic waste already in the environment, particularly
               major rivers that carry vast amounts of land-based waste to the ocean

     •   Berry already has a history of reducing the amount of resin annually in our products, as well as, using
         post-consumer recycled materials in our product offerings

32                                          https://endplasticwaste.org/
Sustainability Goal – “Impact 2025”
     •   Multifaceted initiative where we focus on making a positive impact through our products,
         performance, and partners

           •   Products: minimize product impacts
                 Optimize design
                       Lightweight products
                       Design 100% of packaging to be reusable, recyclable, or compostable
           •   Performance: minimize operational impacts
                 Climate change
                          Reduce greenhouse gas emissions 25% by 2025 versus 2016 baseline
                 Continuous improvement
                        Reduce landfill waste 5% per year
                        Reduce energy and water consumption 1% per year
                 Operation Clean Sweep (OCS)
                       Prevent resin loss through OCS
                       Implement OCS at acquisition sites within the first year
           •   Partners: maximize positive impacts by engaging partners on key issues
                 End plastic waste
                        Expand and modernize waste infrastructure to increase recovery and prevent loss of
                           plastic to the environment
                        Engage the plastics industry on OCS
                 Limit global warming
                         Increase renewable energy
                         Expand the use of plastic in place of alternative materials
                         Promote science-based targets
33
Benefits of Plastic

           On an annualized basis, plastics save the greenhouse gas
                               equivalent of:

     186 million                                                   834 million             2 billion

     cars off the road                                                   acres of forest   barrels of oil

     Based on data from S&P Trucost and the U.S. EPA GHG Equivalencies Calculator

34
Corporate Sustainability Report

• Report in accordance with Global Reporting Initiative
  (GRI) Standards

• Provides examples of the work Berry has done to:
     •   Reduce waste to landfill
     •   Source renewable energy
     •   Test and evaluate new, more efficient equipment
     •   Institute standardized management plans to reduce
         environmental impacts
     •   Conduct product life cycle assessments and explore
         sustainable materials                                         To view our Sustainability Report documents
                                                                       go to www.berryglobal.com/about-
     •   Promote social initiatives in the communities where we live   us/sustainability
         and work

35
Appendix: Supplemental Data

     (1) Adjusted EBITDA, free cash flow, and adjusted net income should not be considered in isolation or construed as an alternative to our

     net income (loss) or other measures as determined in accordance with GAAP. In addition, other companies in our industry or across
     different industries may calculate adjusted EBITDA, free cash flow, and adjusted net income and the related definitions differently than
     we do, limiting the usefulness of our calculation of adjusted EBITDA, free cash flow, and adjusted net income as comparative measures.
     EBIT, operating EBITDA, adjusted EBITDA, free cash flow, and adjusted net income are among the indicators used by the Company’s
     management to measure the performance of the Company’s operations and thus the Company’s management believes such
     information may be useful to investors. Such measures are also among the criteria upon which performance-based compensation may
     be based

36
Non-GAAP Financial Measures
                                                               Actual                                 Guidance
                                      FY 2013   FY 2014   FY 2015       FY 2016   FY 2017   FY 2018    FY 2020

Cash flow from operations              $464      $530      $637          $857      $975     $1,004     $1,400
Capital expenditures, net              (221)     (196)     (162)         (283)     (263)     (333)      (600)
Payment of tax receivable agreement     (5)      (32)      (39)          (57)      (111)     (37)         -
Free cash flow                         $238      $302      $436          $517      $601      $634       $800

          Note: Dollars in millions
37
Non-GAAP Financial Measures

 Fiscal Year                                                            1997             2001   2006        2011           2018

 U.S. GAAP Operating income                                             $18              $52    $69          $42          $761
     Add: restructuring and impairment                                     -              5      2           221           36
                                                             (1)
     Add: business optimization and other costs                           2               2      3           49            45
     Add: depreciation & amortization                                    15               49    106          344           538
 Operating EBITDA                                                       $35              $108   $180        $656         $1,380

                                                    Fiscal Year                                            2013         2014          2015         2016       2017       2018
                                                    Net income per diluted share                       $    0.47    $    0.51     $    0.70    $  1.87    $  2.54    $  3.67
                                                    Other expense (income)                                   0.34         0.20          0.52     (0.18)       0.03       0.18
                                                    Non-cash amortization                                    0.28         0.25          0.17       0.24       0.24       0.21
                                                    Restructuring and impairment                             0.09         0.17          0.07       0.26       0.18       0.27
                                                    Other non-cash charges                                      -            -             -       0.38       0.22       0.04
                                                    Business optimization                                    0.14         0.43          0.24       0.20       0.13       0.13
                                                    Tax reform adjustments, net                                 -            -             -          -          -     (0.92)
                                                    Income tax impact on items above                            -            -             -     (0.29)     (0.25)     (0.21)
                                                    Adjusted net income per diluted share              $    1.32    $    1.56     $    1.70    $ 2.48     $ 3.09     $ 3.37

              Note: Dollars in millions, except per share data
38            (1) Includes integration expenses and other business optimization costs.
Non-GAAP Financial Measures
                                Operating Depreciation &              Business Op. Operating                                                            LTM Operating
     Quarterly Period            Income    Amortization Restructuring and Other (1) EBITDA                                           Net Sales          EBITDA Margins
     Sept '16                         151            135            3           12       301                                              1,618
     Dec '16                          146            120            4            7       277                                              1,502                        19.0%
     Mar '17                          175            131            6           24       336                                              1,806                        18.7%
     Jun '17                          212            132            8           12       364                                              1,906                        18.7%
     Sept '17                         199            138            6            7       350                                              1,881                        18.7%
     Dec '17                          163            129           11            7       310                                              1,776                        18.5%
     Mar '18                          188            132           15           15       350                                              1,967                        18.2%
     Jun '18                          216            136            7           15       374                                              2,072                        18.0%
     Sept '18                         194            141            3            8       346                                              2,054                        17.5%
     Dec '18                          176            138           11            6       331                                              1,972                        17.4%
     Mar '19                          185            132            5           32       354                                              1,950                        17.5%
     Jun '19                          215            127            2            4       348                                              1,937                        17.4%

       Note: Dollars in millions
       LTM operating EBITDA margins calculated by dividing the sum of the previous four quarters operating EBITDA by the sum of the previous four quarters net sales
       (1) Includes integration expenses and other business optimization costs.
39
Non-GAAP Reconciliation
                                                                                                  Quarterly Period Ended

                                                                                               June 29, 2019   June 30, 2018

                                     Net income                                                    $13             $110
                                                                                   (6)
                                         Add: other expense (income), net                          136              3
                                         Add: interest expense, net                                 71              67
                                         Add: income tax expense (benefit)                          (5)             36
                                     Operating income                                              $215            $216

                                         Add: non-cash amortization from 2006 private sale          7               7
                                         Add: restructuring and impairment                          2               7
                                         Add: other non-cash charges (1)                            6               7
                                                                                   (2)
                                         Add: business optimization costs                           (2)             8
                                                                          (7)
                                     Adjusted operating income                                     $228            $245

                                         Add: depreciation                                          89              96
                                                                                 (3)                31              33
                                         Add: amortization of intangibles
                                     Operating EBITDA (7)                                          $348            $374

                                       Net income per diluted share                               $0.10            $0.81
                                                                           (6)
                                       Other expense (income), net                                 1.01            0.02
                                       Non-cash amortization from 2006 private sale                0.05            0.05
                                       Restructuring and impairment                                0.01            0.05
                                                                    (4)
                                       Other non-cash charges                                        -             0.01
                                                                           (2)
                                       Business optimization costs                                (0.01)           0.06
                                       Income tax impact on items above (5)                       (0.26)          (0.04)
                                                                                         (7)
                                     Adjusted net income per diluted share                        $0.90            $0.96

      Note: Dollars in millions, except per share data. Unaudited
40    * See next page for footnote disclosures
Non-GAAP Reconciliation (continued)
 (1) Other non-cash charges for the June 2019 quarter includes $4 million of stock compensation expense and other non-cash charges. Other non-cash charges for the
      June 2018 quarter includes $6 million of stock compensation expense and other non-cash charges.
 (2) The current quarter primarily includes a legal settlement credit offset by legal and accounting fees associated with the RPC Group Plc acquisition (in the Consumer
      Packaging segment) along with integration expenses and other business optimization costs related to previous acquisitions.
 (3) Amortization excludes non-cash amortization from the 2006 private sale of $7 million for the June 2019 and June 2018 quarters, respectively.
 (4) No adjustments were made for other non-cash charges to net income per diluted share for this June 2019 quarter and on a go forward basis. Other non-cash
      charges excludes $6 million stock compensation expense for the quarter June 2018.
 (5) Income tax effects on adjusted net income is calculated using 25 percent for both the June 2019 and June 2018 quarters, respectively. The rates used represents
      the Company’s expected effective tax rate for each respective period.
 (6) Other expense in the quarter is primarily related to $138 million of cross currency swaps and foreign exchange forward contracts entered into as part of the RPC
      transaction.
 (7) Supplemental financial measures that are not required by, or presented in accordance with, accounting principles generally accepted in the United States (“GAAP”).
      These non-GAAP financial measures should not be considered as alternatives to operating or net income or cash flows from operating activities, in each case
      determined in accordance with GAAP. These non-GAAP financial measures may be calculated differently by other companies, including other companies in our
      industry, limiting their usefulness as comparative measures.

     We define “free cash flow” as cash flow from operating activities less additions to property, plant, and equipment and payments under the tax receivable
     agreement. We believe free cash flow is useful to an investor in evaluating our liquidity because free cash flow and similar measures are widely used by investors,
     securities analysts, and other interested parties in our industry to measure a company’s liquidity. We also believe free cash flow is useful to an investor in evaluating our
     liquidity as it can assist in assessing a company’s ability to fund its growth through its generation of cash.

     Adjusted EBITDA is used by our lenders for debt covenant compliance purposes. We also use Adjusted EBITDA and Operating EBITDA among other measures to
     evaluate management performance and in determining performance-based compensation. Adjusted EBITDA and Operating EBITDA and similar measures are widely
     used by investors, securities analysts, and other interested parties in our industry to measure a company’s performance. We also believe EBITDA and adjusted net
     income are useful to an investor in evaluating our performance without regard to revenue and expense recognition, which can vary depending upon accounting
     methods.

41
Dustin M. Stilwell
     Director, Head of Investor Relations

     Berry Global Group, Inc.
     101 Oakley Street, 3rd floor
     P. O. Box 959
     Evansville, IN 47706
     Tel: +1.812.306.2964
     ir@berryglobal.com
     www.berryglobal.com

42
You can also read