ACCELERATING PLASTIC RECOVERY IN THE UNITED STATES - MCKINSEY
←
→
Page content transcription
If your browser does not render page correctly, please read the page content below
Chemicals Practice
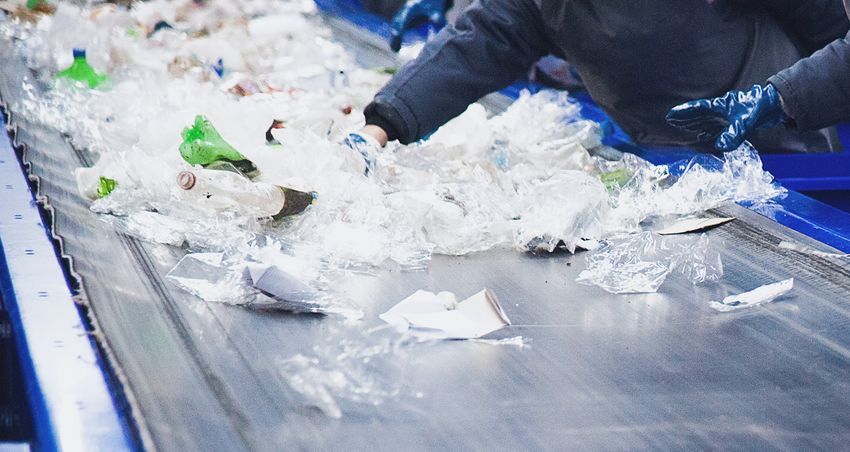
Accelerating
plastic recovery in
the United States
Plastic waste is a critical issue of our time. Effecting change will
require an integrated approach.
by Thomas Hundertmark, Manuel Prieto, Andrew Ryba, Theo Jan Simons, and Jeremy Wallach
© Grigorenko/Getty Images
December 2019Plastic has become ubiquitous in modern life. It keeps our food from spoiling, helps us transport goods
with less energy and less breakage than other materials, makes our vehicles lighter and more energy
efficient, and is inexpensive, durable, and easily formed. However, its attractive performance and low cost
have enabled broad adoption, creating a fundamental challenge with the growth in plastic waste—including
in packaging and single-use food-service waste. Over the past two years, societal pressure around plastic
waste has grown considerably, mainly driven by the highly visible impact on marine environments and a
broader awareness of sustainable lifestyles. Studies show that plastic pollution in the world’s oceans is
largely the result of unmanaged waste in developing economies in Asia.¹ In the United States, waste is
generally managed² and leakage to marine environments is low—but recovery rates for packaging and
food-service plastic are about 28 percent (split between mechanical recycling and waste-to-energy),
compared with 90 percent in other leading industrialized countries, such as Germany and Japan.³
Recycling is the major lever for addressing the plastic waste challenge. While “reducing” and “reusing”
can have some impact, in most realistic scenarios there are large volumes of plastic waste that only
increased recycling can handle. Further, there is a meaningful business opportunity associated with
recycling—recovery of US plastic packaging and food-service plastic alone could represent a pool of
earnings before interest, tax, depreciation, and amortization (EBITDA) of $2 billion to $4 billion per year.
However, increasing recycling in the United States will not be easy. Our research shows that a robust
system for plastic-waste recycling in the United States requires solving challenges related to consumer
behavior, access to recycling, collection and sortation methods, recovery capabilities (including mechanical
and advanced recycling⁴), and economics and end markets (see sidebar “About the research”). Further
complicating matters, the root causes of (and solutions to) these challenges are interdependent—as supply
solutions bring more plastics into the recycling system, it will be crucial to increase demand for recycled
materials. Critically, we see a need for collaboration and commitment across the value chain before solutions
can be implemented at scale.
1
Jenna R. Jambeck et al., “Plastic waste inputs from land into the ocean,” Science, Volume 347, Issue 6223, February 13, 2015.
2
Managed waste includes landfill and waste-to-energy (such as incineration with heat recovery).
3
Germany and Japan have nearly eliminated the landfilling of plastics, opting to incinerate large volumes of the material and recover its heat
value. However, this approach has associated challenges with emissions.
4
Advanced recycling includes conversion (pyrolysis and gasification), decomposition, and solvolysis.
About the research
Our research quantifies the impact of organizations, and verified through conver- here we look at it from the perspective of
different challenges that inhibit recycling sations with players across the plastic value US packaging and food-service plastic. We
rates so that solutions can be prioritized. chain. Within the sustainability framework do not address unmanaged plastic (ocean
The findings in this article were assembled of “reduce, reuse, recycle,” we focus here plastic), as that issue is primarily linked to
from publicly available data, such as the on recycling—for example, turning plastic developing economies.
US Environmental Protection Agency and back into plastic or other usable materials.
reports from recycling nongovernmental Plastic waste is a global challenge, and
2 Accelerating plastic recovery in the United StatesDemand for plastics is large and growing—and so is plastic waste
In the United States, approximately 37 million tons of plastic are used every year. Of this, packaging and
food-service plastics represent about 16 million tons, and these are typically “single use.” On average,
Americans consume 100 pounds per person, per year, of packaging and food-service plastics.
The main resin types⁵ found in these packaging and food-service applications are PET (polyethylene
terephthalate, used in soft-drink bottles), HDPE (high-density polyethylene, used in milk jugs), LDPE (low-
density polyethylene, used in films and wraps), and PP (polypropylene, used in yogurt containers and bottle
caps). Together, these polymer types make up approximately 85 percent of single-use volume (Exhibit 1).
The remaining two major resin types, PVC (polyvinyl chloride, used in blister packs) and PS (polystyrene,
used in food service, such as cups), each represent less than 10 percent of the volume.
Only approximately 12 percent of this material is recycled (see sidebar “Primer on plastics recycling”).
Another 16 percent is combusted with municipal trash, from which the heat value is recovered, but the
majority—more than 70 percent, or 11 million tons—is sent to landfill. Texas and California account for
approximately 25 percent of unrecovered volumes, reflecting about 20 percent of the US population,
below-average use of waste-to-energy and (for Texas) a lower recycling rate.
As plastic consumption grows, the volume of unrecovered plastic will continue to grow as well. Recycling
volumes in the United States were essentially flat from 2010 to 2017, despite growing consumption.
Conducting business as usual could mean that demand for plastic in packaging and food service could
reach 20 million to 22 million tons by 2040 (35 percent above current levels). Maintaining even currently low
recycling rates will require meaningful investment, and some recent developments (such as limitations on
waste exports) may have even reduced US recycling rates. Improving recovery, however, will require more
than incremental change—it demands a major rethinking of the current way of working.
McKinsey on Chemicals
Recycling Dynamics
Exhibit 1 of 6 5
The following resin codes are used to distinguish materials: 1: PET; 2: HDPE; 3: PVC; 4: LDPE; 5: PP; 6: PS; and 7: other.
Exhibit 1
Four polymers make up 85 percent of plastic packaging and food-service plastic.
Polymers and applications Percent of total, %
PET • Drink bottles (eg, for carbonated drinks, water) 25
• Food trays
HDPE • Milk jugs
25
• Grocery bags
LDPE/ • Films (eg, for bread bags) 25
LLDPE • Container lids
PP • Yogurt containers 10
• Bottle caps
PS • Foam containers (eg, for cups), clamshellsPrimer on plastics recycling
The plastic value chain begins with “virgin” to recycling depots. In the United States, that are used to create carpeting. Use in
resin, which is typically produced from most recyclables are collected via alternative applications is the more
hydrocarbon feedstocks—such as oil and “single stream” operations that collect all common approach—for example, the
natural gas liquids—that is processed recyclable materials together. largest use of recycled PET is fiber, and
and formed into pellets. Converters the largest use of recycled HDPE is pipe—
transform these pellets into packages Recyclables are then sorted at material because of performance requirements,
(such as bottles, jugs, film, bags, and tubs), recovery facilities (MRFs). MRFs separate color, or the need for special additives.
and brand owners fill these packages with plastic from paper, metal, glass, and bulky
products that are then sold to consumers (durable) items.¹ They also produce bales of Advanced recycling is a separate and less
through retailers. sorted plastic, which are sold to reclaimers. mature process in which waste plastics
The reclaimers further clean the material (sorted or unsorted) are transformed into
After products are consumed, collection and transform it back into pellets for reuse fuels, plastic feed-stocks, monomers, or
infrastructure is required to transport by converters. purified polymers. The output can be
packaging waste from bins to sorting used for traditional polymer manufacturing
facilities in residential settings. This In general, plastic can be recycled either with performance equivalent to that of
includes haulers that provide curbside “like to like,” such as bottles that are virgin material.
service and, in areas without curbside converted back to bottles, or transformed
service, consumers transporting waste into other applications, such as bottles
1
Postindustrial and commercial packaging are often cleaner streams that do not require sortation.
Challenges to address
We see six challenges that will need to be addressed to improve plastic recycling in the United States
(Exhibit 2). These include two challenges for the supply of plastic waste (consumer behavior and access to
recycling), three for the demand (collection and sortation, recovery technologies, and economics and end
markets), and value-chain coordination.
Supply challenges
Consumer behavior. Even when consumers have convenient access to recycling, such as curbside service,
they often fail to put plastic into the recycling bin. In fact, consumers with access to curbside recycling
only place about 40 percent of recyclables into the recycling bin. The remaining 60 percent of material goes
directly to landfill or is incinerated—and is therefore no longer able to be recycled.
Consumers cite confusion and apathy as primary reasons for poor recycling behavior. Confusion arises from
a lack of consistency in recycling programs and the wide range of materials that consumers handle. It might
be unclear what should be placed in each bin—for example, bottles can be recycled but pouches cannot;
tubs can be recycled but bags and tubes cannot. Guidelines vary from municipality to municipality, and
recyclability is typically not indicated on packaging. Numeric resin codes that identify polymer types, such
as the number one on the bottom of PET bottles, do little to communicate what should be done with the
4 Accelerating plastic recovery in the United StatesMcKinsey on Chemicals
Recycling Dynamics
Exhibit 2 of 6
Exhibit 2
Low US recycling rates are the result of consumer behavior, access to recycling, system
capability, and economics.
US plastic packaging material flow in 2020, million tons
x Million tons of plastic Recycled/recovered Landfill
Mechanically Advanced
Waste to energy
recycled recycling
Durables¹ 14
Not addressed in
Virgin this document ~2 ~3 ~0
resin Nondurables² 7
~35
Packaging
and food 16
service³
~4 ~3 ~2 ~1 ~1
Collection/
Consumer Access to sortation Recovery
Economics
behavior recycling capability capability
Supply challenges Demand challenges
~7 million tons ~4 million tons (expected to
grow to ~8 million tons as
supply challenges are resolved)
¹ Such as appliances.
² Such as diapers, trash bags, and footwear.
³ Such as bottles, jars, jugs, cutlery, cups, and plates.
Source: US Environmental Protection Agency, More Recycling, Recycling Partnership, IHS Markit, Vanderbilt University
material once it becomes waste. Moreover, consumers see little impact from their behavior: whether plastic
waste goes into the recycling bin or the trash bin might not make any economic difference to them.
However, consumer behavior can be influenced through education, labeling, incentives, and enforcement.
Top-performing cities, such as Austin, Phoenix, and Seattle, achieve recycling rates 10 to 20 times higher
than lagging cities, such as Charlotte, Chicago, and Houston. One reason for the higher recycling rates in
top-performing cities could be that they employ pay-as-you-throw incentive programs, in which citizens
are charged fees for landfill waste streams, such as trash, but are not charged for recycling streams. High-
performing cities also invest in education on recycling for residents—including efforts to drive messaging in
schools, such as in Portland, Oregon. There is also a need for clear labeling and associated consistency and
harmonization in recycling rules across programs.
Changing consumer behavior is possible. Successful examples in the United States include energy-
efficiency programs—energy intensity (defined as BTU per dollar GDP) fell from 12,000 in 1980 to 6,000 in
2014⁶—and seat-belt usage, for which rates increased from 14 percent in 1983 to 90 percent in 2017.⁷
6
teven Nadel, “35 years of energy efficiency progress, 35 more years of energy efficiency opportunity,” American Council for an Energy-
S
Efficient Economy, June 30, 2015, aceee.org.
⁷ “Seat belt use in 2017—use rates in the states and territories,” US Department of Transportation, June 2018, crashstats.nhtsa.dot.gov; and
How states achieve high seat belt use rates, US Department of Transportation, August 2008, crashstats.nhtsa.dot.gov.
Accelerating plastic recovery in the United States 5Access to recycling. The underlying drivers of recycling access are economic and regulatory. Approximately
30 million rural US households and 15 million suburban US households lack curbside recycling—reflecting
the distance between homes, the cost of using trucks to pick up recyclables, and the willingness of
municipalities to invest in recycling programs.
Closing the access gap will require significant infrastructure build-out alongside appropriate considerations
of how to make recycling cost effective for residents. Many multifamily residences in the United States—
approximately eight million of which lack curbside recycling—fall under commercial rules, meaning recycling
services are not provided by the municipality and landlords are responsible for providing and paying for
services. Therefore, closing the gap may require consideration of incentives and the regulatory environment.
Demand challenges
Collection and sortation. Current sorting technology is not effective at handling approximately 30 percent
of plastic packaging. For example, problems occur with flat items, such as film, bags, lids, and pouches, as
well as small items, such as toiletry tubes. Material recovery facilities (MRFs) use ballistic sorters to separate
flat materials, and these flat plastic forms often end up in paper bales or tangled in the sorters. Small items—
typically less than two inches in width—fall through screens and end up with the MRF residual waste, which
is sent to landfill. As a result, these materials are typically not accepted in recycling programs (see sidebar
“Recyclability and product redesign”).
There are programs underway to collect and sort flat items, including enhanced sortation (upgrading of
MRFs), secondary bag programs that collect specific plastics, front-of-store collection, and multi-stream
collection. These approaches offer various trade-offs on efficacy, cost, and consumer participation
McKinsey on Chemicals
requirements (Exhibit 3). As packaging shifts from traditional rigid forms to flexible material (for example, from
Recycling Dynamics
Exhibit 3 of 6 laundry detergent bottles to flex pouches), more plastic will face these collection and sortation challenges.
Exhibit 3
Four alternative collection and sortation methods could help direct flat and small items to
material reprocessing facilities.
Description Considerations
Enhanced sortation • Install new equipment at MRFs to sort flat items (optical sorting) • Low hurdle for participation (same bin)
• MRFF trial underway at one MRF¹ • High capital cost and does not address small forms
Secondary bag • Separate bag for items that are difficult to sort or recycle • Uses existing collection infrastructure
• Pilot programs send recovered plastic to conversion, waste to • Early trials show low participation rates (~10%)
energy, or alternative outlets (eg, railroad ties)
Front of store • Collect separately at retail outlets • Uses existing infrastructure (reverse logistics network)
• WRAP program collects film at grocery stores and other retailers • Lower participation rate (~5–10%)
Multi-stream • Multiple bins for different materials (for curbside pickup) • Cleaner material
• Currently ~15–20% of households served in this way (typically • Recapitalize collection and lower participation rate
separate paper bin) (versus single stream)
1
Materials Recovery for the Future pilot, which is working to sort flat/flexible items, in Berks County, Pennsylvania.
6 Accelerating plastic recovery in the United StatesRecyclability and product redesign
The US Federal Trade Commission requires Product design may provide a solution will need to be developed to deal with
that 60 percent of consumers have access for some of the remaining challenges lower-quality material (such as gray
McK Chemicals
to recycling 2019
of a material for that material to surrounding recyclability. Packaging pro- recycled LDPE). Redesign is also being
Recycling dynamics
be labeled “recyclable” without qualifica- ducers are working to develop flexible used to address other challenges for
Exhibit 6 of
tion (exhibit). 6 most plastic packaging
Today, packaging solutions from single types of recycling, such as difficult-to-separate
is recyclable, but some materials, such as polymers. These could one day be me- labels—for example, PVC labels on
multilayer flexible packaging, are not. chanically recycled, though new markets PET bottles.
Exhibit
Sixty-five percent of plastic material meets today’s threshold to be labeled recyclable.
Access to recycling in US by plastic type (packaging only),1 % of population with access to recycling (for plastic type)
HDPE PET² LDPE/LLDPE PP PVC PS
Close
Meets threshold today (65% of material) (10%) Not recyclable today (25%)
100
Bottles and jugs Bags Tubs/containers/buckets
90
Bottles and jugs Clamshells/trays
80 Containers
Drop-off (within Films
Lids/clamshells
70 ten miles)
FTC threshold for “recyclable”
60
50
Blisters
40
30
20 Tubes
10 Other flexible materials
Curbside (multilayer, pouch, or wrapper)
0
0 1 2 3 4 5 6 7 8 9 10 11 12 13 14 15
Million tons of plastic packaging³
Many common plastic packaging types are well above the FTC threshold of 60%
• HDPE jugs and PET bottles meet the threshold with large acceptance in curbside programs (more than 90% access)
• PE bags and films have high access levels, driven by front-of-store access (more than 90% access)
The 25% of material that does not meet the FTC threshold includes difficult to sort (small or flat) and difficult to reclaim (multilayer) materials
1
Data set includes rigid plastics used for packaging and films and bags.
² No data available on split between curbside and drop-off access for PET packaging.
³ Tonnage data reflect the US Environmental Protection Agency’s estimate for each polymer type used in packaging, combined with estimates for each polymer
application split.
Source: Moore Recycling 2015–16 Centralized Study on Availability of Plastic Recycling and 2012 National Reach Study: 2012 Update; 2013 FPA Flexible Packaging
Industry Segment Profile Analysis; US Environmental Protection Agency; IHS Markit
Accelerating plastic recovery in the United States 7Recovery technologies. Mechanical reclaiming—conversion of waste polymer back into usable polymer
through heating and extrusion—is effective for waste that is currently sorted by MRFs but will face
limitations as the collection rate increases. Mechanical recycling affects the consistency, color, and
properties of plastic, and becomes a greater challenge when the material is recycled multiple times.
Estimates vary for the upper limit on mechanical recycling system-wide—Germany and Japan have
demonstrated mechanical recycling rates of up to 20 to 40 percent. Achieving recovery rates above this
level may require further recovery methods.
Waste-to-energy, a process in which trash and recyclables are combusted with heat recovery, has been
widely adopted in other countries (for example, Germany and Japan) but faces challenges in the United
States due to low landfill costs (due to relatively high land availability), low energy prices (due to low
natural gas prices), and public opinion. There are also concerns about emissions associated with
this process. Countries that have achieved near-total diversion of plastic from landfill send significant
quantities of plastic waste to be combusted with heat recovery.
Advanced recycling may be an attractive alternative. There are three types of advanced recycling.
— Conversion—plastic is converted to liquid hydrocarbons to be used for fuels or as feedstock
for “new” plastic.
— Decomposition—polymers are transformed back into monomers (for example, polystyrene
becomes styrene).
— Purification—polymers are dissolved in solvents, and the desired polymer is then separated from
the other components.
Each of these advanced recycling routes supports production of plastic with performance equal to “virgin”
plastic (Exhibit 4). One type of conversion, pyrolysis, is attracting attention. There are several pyrolysis
pilot plants in place and several hundred thousand tons of capacity announced or under construction.
Decomposition may have financial advantages because of higher prices for monomer outputs, but it is
applicable to a narrower range of polymers, and fewer pilots are in operation. Finally, purification capacity
has been announced but remains nascent.
Our modeling suggests return on invested capital (ROIC) for advanced recycling may be in the mid-single
digits, but estimates are difficult due to the limited operating capacity in the United States. Economics
should improve over time through learning curves and scaling. Outcomes from initial investments will help
guide the most scalable approach and determine whether returns will meet investment thresholds.
As supply solutions bring more
plastics into the recycling system,
it will be crucial to increase demand
for recycled materials.
8 Accelerating plastic recovery in the United StatesRecycling dynamics
Exhibit 4 of 6
Exhibit 4
Advanced recycling may be central to high recycling and recovery rates, but limited scaled
progress and some skepticism must be addressed.
Advanced recycling route Technology Input Output
Conversion (polymer to fuel or feedstock) Pyrolysis Mixed or sorted plastics • Syncrude
• Naphtha (plastic feedstock)
• Fuels
• Wax
Gasification Municipal waste (unsorted) • Syngas: fuels/feedstocks,
methanol, ethanol
Decomposition (polymer to monomer) Pyrolysis/microwave PS • Monomer
• Oligomer
Solvolysis PET • Monomer
• Polyester polyols
Purification Dissolution PE, PP, PET, and PS • Purified polymers
Source: Closed Loop Partners
Economics and end markets. Once material is collected, sorting and mechanical recycling is currently cash
positive for approximately 75 to 80 percent of plastic, and in most instances generates sufficient margin to
provide an acceptable return on capital. MRFs receive recyclables at low or zero cost, and their economics
are more closely linked to paper prices—the largest component of the recyclable input stream. MRFs
sell bales of scrap plastic for $300 to $500 per ton for PET and HDPE (Exhibit 5), which justifies sorting
these streams. Reclaimers purchase bales of scrap plastic and sell pellets at prices within 10 to 20 percent
of virgin resin prices, capturing a margin that appears to cover the cost of capital. Converters purchase
recycled polymer and create a wide range of products, including fiber (PET), bottles (PET and HDPE), and
durables (HDPE and PP).
The remaining 20 to 25 percent of rigid-plastic volume, MRF residuals often termed a “3 through 7 bale,”
is not cost-effective to separate. Bales of this type of scrap material are valueless, and the majority go to
landfill. Advances in MRF sortation technology may reduce MRF residual plastic volumes over time.
One potential solution is secondary sorting, which entails sorting MRF-residual bales to separate the
valuable materials. Despite the name “3 through 7 bale,” these bales typically contain significant quantities
of PET, HDPE, aluminum, and PP—as well as some PVC and PS. Secondary sorting could redirect the
material to the recycling value chain. However, this process faces high sorting costs and could require
structural support to ensure the bales are recycled.
New end markets may also have to be developed for selected materials as collection and sortation increase.
Most significant may be a market for mixed-stream bags and film (primarily LDPE) reclaimed from the
recycling stream.⁸ Establishing markets for sort bales of PVC and PS might also be necessary. Today, PVC
and PS make up only a small fraction of plastic-waste volume, and MRFs often do not sort or accept them.
As a result, there are limited markets today for scrap PVC, PS, or dirty (mixed-stream) LDPE.
8
Markets exist for material collected via front-of-store, but they may be cleaner than material collected through the recycling stream.
Accelerating plastic recovery in the United States 9Recycling dynamics
Exhibit 5 of 6
Exhibit 5
Plastic bale prices offer an indication of the economics of mechanical recycling.
Typical MRF plastic stream composition, percentage weight of total
1 2 2 5 1–7
+ Other 100 MRF residual bales (commonly
referred to as “3 through 7 bales”)
20 represent ~20% of MRF plastic
volume but have no value today
5 (often not recycled)
15 • Sent to landfill in inland
regions with a disposal cost
15 • Previously exported to China
45
(pre–National Sword) in
coastal regions¹
PET bottles HDPE natural HDPE color PP rigid MRF residual Total
bale
2018 US bale
~300 450+ ~300 ~200 0
price, $/ton
1
In 2018, China implemented the National Sword policy, which largely halted imports of scrap plastic. Previously, material had been exported from the United States,
aided by inexpensive shipping costs using empty containers returning to China and the low labor cost for sorting and processing in China.
Source: Association of Plastic Recyclers; expert interviews
Value-chain coordination
Recycling is fragmented across geographies and the value chain, making it challenging to scale and
coordinate efforts. There may be an estimated 10,000 to 15,000 municipal recycling programs in the
United States, with approximately 500 MRFs and varying rules for which plastic materials are accepted.
This creates challenges for labeling packaging to indicate how plastics should be recycled. Countries
with better plastic-waste management frequently employ nationwide frameworks and programs. Some,
including Germany and Japan, implement enhanced producer responsibility requirements that shift
portions of the recycling burden to manufacturers.
The path forward: An integrated road map
Plastic is an essential component of our modern lives, and we must become better stewards of this valuable
resource by building a robust system to manage the supply of (and demand for) plastic waste. Recovery of
plastic waste is also a meaningful market opportunity—recycling and recovery of US packaging and food-
service plastic alone could represent an EBITDA value pool of up to $2 billion to $4 billion per year.
10 Accelerating plastic recovery in the United StatesShifting the United States from its current low recycling rates to world-class levels will require concerted
efforts along three dimensions.
— Improving the supply of plastic waste into recovery streams via changes in consumer behavior
and access. Consumer behavior can be changed with education programs, labeling, incentives, and
enforcement. Education and incentives are relatively low-cost initiatives but could take time to gain
traction. The harmonization of recycling rules with the associated product labeling will help reduce
consumer confusion. Improving access to recycling with trucks and recycling carts will be costly but is
also necessary—otherwise access will become a ceiling for recovery rates.
— Improving the demand and pull-through of plastic waste via improved sortation, recovery, and
economic support and end markets. The existing infrastructure of MRFs and mechanical reclaiming will
need to be expanded as more plastic waste enters the value chain. Alternative collection systems, such
as secondary bag programs and enhanced sortation with upgraded MRFs, will need to be built to handle
challenging forms. Advanced recycling technologies will need to mature and scale to process mixed
materials and enable recovery rates above the limits of mechanical recycling.
— Improving coordination across the value chain. Today’s highly fragmented system leads to confusion
and inconsistent outcomes. An industry road map with support across the value chain—resin
producers, converters, brand owners, retailers, haulers, and reclaimers—could coordinate investments,
establish minimum standards, and share what they learn. A national framework for recycling, potentially
driven by regulatory bodies, could further set guidelines for which plastics are accepted by recycling
programs, develop requirements for labeling, and finance and administer economic support in areas
where markets break down.
While system-wide performance change may take time, large cities are well positioned to deliver impact
in the near term. Waste management and recycling are local issues by nature, and cities represent dense
regions of plastic-waste generation where real impact can be achieved relatively quickly. Unless and until
there is a national framework, cities will be critical in designing education and incentive programs that create
a culture of recycling, establishing regulatory frameworks that expand and require access to recycling,
launching pilots that collect and sort challenging forms, and implementing policies to make recycling
economically effective. Integrated programs could be used to demonstrate the full potential of plastic-waste
management. The lessons learned from early adopters could be used to design playbooks that would allow
best practices to be easily shared and replicated.
Waste management may be a defining issue for the plastics industry over the next decade. As a result, the
plastics industry is at a crossroads—and now is the time to act.
Thomas Hundertmark is a senior partner in McKinsey’s Houston office, where Manuel Prieto is a partner; Andrew Ryba is
a consultant in the Denver office; Theo Jan Simons is a partner in the Cologne office; and Jeremy Wallach is a partner in the
Boston office.
The authors wish to thank more than 40 participants across the value chain for their contributions to this article.
Copyright © 2019 McKinsey & Company. All rights reserved.
Accelerating plastic recovery in the United States 11You can also read