Stifel 2020 Virtual Cross Sector Insight Conference - NYSE: CVA JUNE 2020 - Covanta Investors
←
→
Page content transcription
If your browser does not render page correctly, please read the page content below

Stifel 2020 Virtual Cross Sector
Insight Conference
NYSE: CVA   JUNE 2020

Cautionary Statements
  All information included in this earnings presentation is based on continuing operations, unless otherwise noted.

  Forward-Looking Statements

  Certain statements in this press release may constitute “forward-looking” statements as defined in Section 27A of the Securities Act of 1933, as amended (the “Securities Act”), Section 21E of the Securities Exchange Act of 1934 (the
  “Exchange Act”), the Private Securities Litigation Reform Act of 1995 (the “PSLRA”) or in releases made by the Securities and Exchange Commission (“SEC”), all as may be amended from time to time. Such forward-looking
  statements involve known and unknown risks, uncertainties and other important factors that could cause the actual results, performance or achievements of Covanta Holding Corporation and its subsidiaries (“Covanta”) or industry
  results, to differ materially from any future results, performance or achievements expressed or implied by such forward-looking statements. Statements that are not historical fact are forward-looking statements. Forward-looking
  statements can be identified by, among other things, the use of forward-looking language, such as the words “plan,” “believe,” “expect,” “anticipate,” “intend,” “estimate,” “project,” “may,” “will,” “would,” “could,” “should,”
  “seeks,” or “scheduled to,” or other similar words, or the negative of these terms or other variations of these terms or comparable language, or by discussion of strategy or intentions. These cautionary statements are being made
  pursuant to the Securities Act, the Exchange Act and the PSLRA with the intention of obtaining the benefits of the “safe harbor” provisions of such laws. Covanta cautions investors that any forward-looking statements made by
  Covanta are not guarantees or indicative of future performance. Important assumptions and other important factors, risks and uncertainties that could cause actual results to differ materially from those forward-looking
  statements with respect to Covanta include, but are not limited to: the risks and uncertainties affecting Covanta's business described in periodic securities filings by Covanta with the SEC. Important factors, risks, and uncertainties
  that could cause actual results of Covanta and the JV to differ materially from those forward-looking statements include, but are not limited to: seasonal or long-term fluctuations in the prices of energy, waste disposal, scrap metal
  and commodities, and Covanta's ability to renew or replace expiring contracts at comparable prices and with other acceptable terms; adoption of new laws and regulations in the United States and abroad, including energy laws, tax
  laws, environmental laws, labor laws and healthcare laws; advances in technology; difficulties in the operation of our facilities, including fuel supply and energy delivery interruptions, failure to obtain regulatory approvals,
  equipment failures, labor disputes and work stoppages, and weather interference and catastrophic events; failure to maintain historical performance levels at Covanta's facilities and Covanta's ability to retain the rights to operate
  facilities Covanta does not own; Covanta's and the joint ventures ability to avoid adverse publicity or reputational damage relating to its business; difficulties in the financing, development and construction of new projects and
  expansions, including increased construction costs and delays; Covanta's ability to realize the benefits of long-term business development and bear the costs of business development over time; Covanta's ability to utilize net
  operating loss carryforwards; limits of insurance coverage; Covanta's ability to avoid defaults under its long-term contracts; performance of third parties under its contracts and such third parties' observance of laws and regulations;
  concentration of suppliers and customers; geographic concentration of facilities; increased competitiveness in the energy and waste industries; changes in foreign currency exchange rates; limitations imposed by Covanta's existing
  indebtedness and its ability to perform its financial obligations and guarantees and to refinance its existing indebtedness; exposure to counterparty credit risk and instability of financial institutions in connection with financing
  transactions; the scalability of its business; restrictions in its certificate of incorporation and debt documents regarding strategic alternatives; failures of disclosure controls and procedures and internal controls over financial
  reporting; Covanta's and the joint ventures ability to attract and retain talented people; general economic conditions in the United States and abroad, including the availability of credit and debt financing; and other risks and
  uncertainties affecting Covanta's businesses described in periodic securities filings by Covanta with the SEC.
  In addition, the current COVID-19 pandemic is significantly impacting the national and global economy and commodity and financial markets. The full extent and impact of the pandemic is unknown and to date has included extreme
  volatility in financial and commodity markets, a significant slowdown in economic activity, and has raised the prospect of a global recession. The public and private sector response has led to significant restrictions on travel,
  temporary business closures, quarantines, global stock market volatility and a general reduction in consumer and construction activity globally. Matters outside our control have affected our business and operations and may or may
  continue to: limit travel of Company representatives to our business units domestically and internationally; adversely affect the health and welfare of our personnel; reduce the volume of waste materials into our facilities and/or
  the price at which we are able to attract such materials; or prevent important vendors and contractors from performing normal and contracted activities. If significant portions of our workforce are unable to work effectively,
  including because of illness, quarantines, government actions, travel restrictions, facility closures, social distancing requirements or other restrictions in connection with the pandemic, our operations could be materially impacted. It
  is possible that the continued spread of COVID-19 could also further cause disruption in our supply chains, adversely affect our business partners, delay our construction activities or cause other unpredictable events.
  Although Covanta believes that its plans, cost estimates, returns on investments, intentions and expectations reflected in or suggested by such forward-looking statements are reasonable, actual results could differ materially from a
  projection or assumption in any forward-looking statements. Covanta's and the joint ventures future financial condition and results of operations, as well as any forward-looking statements, are subject to change and to inherent
  risks and uncertainties. The forward-looking statements contained in this press release are made only as of the date hereof and Covanta does not have, or undertake, any obligation to update or revise any forward-looking
  statements whether as a result of new information, subsequent events or otherwise, unless otherwise required by law.

  Note: All estimates with respect to 2021 and future periods are as of May 7, 2020. Covanta does not have or undertake any obligation to update or revise any forward-looking statements whether as a result of new information,
  subsequent events or otherwise, unless otherwise required by law.

  Discussion of Non-GAAP Financial Measures

  We use a number of different financial measures, both United States generally accepted accounting principles (“GAAP”) and non-GAAP, in assessing the overall performance of our business. To supplement our assessment of results
  prepared in accordance with GAAP, we use the measures of Adjusted EBITDA and Free Cash Flow which are non-GAAP measures as defined by the Securities and Exchange Commission. The non-GAAP financial measures of Adjusted
  EBITDA and Free Cash Flow as described below, and used in this release, are not intended as a substitute or as an alternative to net income or cash flow provided by operating activities as indicators of our performance or liquidity
  or any other measures of performance or liquidity derived in accordance with GAAP. In addition, our non-GAAP financial measures may be different from non-GAAP measures used by other companies, limiting their usefulness for
  comparison purposes. The presentations of Adjusted EBITDA and Free Cash Flow are intended to enhance the usefulness of our financial information by providing measures which management internally use to assess and evaluate
  the overall performance of its business and those of possible acquisition or divestiture candidates, and highlight trends in the overall business.

                                                                                                                                                                                                                                                 2
Note: Throughout this presentation, certain amounts may not total due to rounding.
Covanta – World Leader in Waste-to-Energy

Waste:                                                                      NYSE: CVA
                                                                            2019 Results:
Operate 41 Waste-to-Energy (WtE) facilities
                                                                            •   Adjusted EBITDA:
~21 million tons processed annually → 1:1 tons of CO2 equivalent offset         $428 million
20 material processing                                                      •   Free Cash Flow:
facilities                                                                      $140 million
                                                                   Waste
                                                                    74%

                                                      % of 2019
                                                                            $0.32 Dividend
                                              Other   Revenue
                                               3%

Energy:                                          Energy
                                                  18%
                                                          Metals
                                                                           Metals:
~10 million MWh                                            5%              ~500,000 gross tons of
generated annually                                                         ferrous and non-
                                                                           ferrous recovered
1,700+ MW base load capacity                                               annually

                                                                                                    3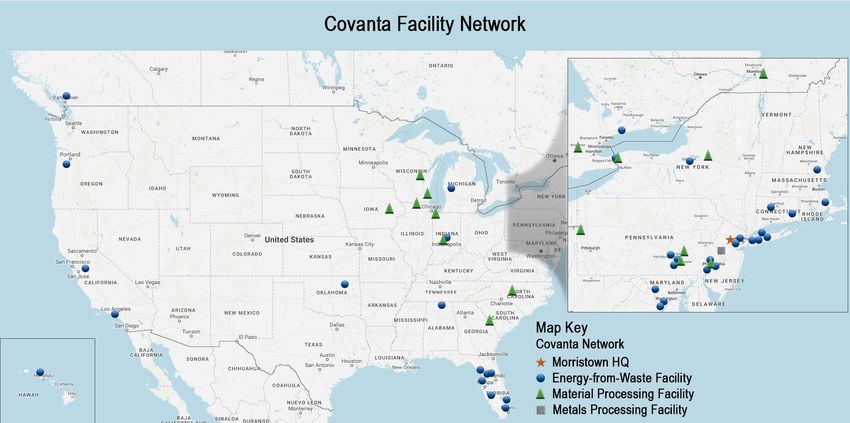
Market Leader in the U.S.

         ~400 Million Tons of
           Waste Annually

     64%
     Landfill

                                                                    Covanta
                                             7%
                                          Waste-to-
                                           Energy
                                                                   ~75%
                                                                 of this market

                        29%                            Benefits of WtE
                Recycling / Composting
                                         • Environmentally sustainable waste management
                                         • Renewable energy source
                                         • Combats climate change
                                                                                          4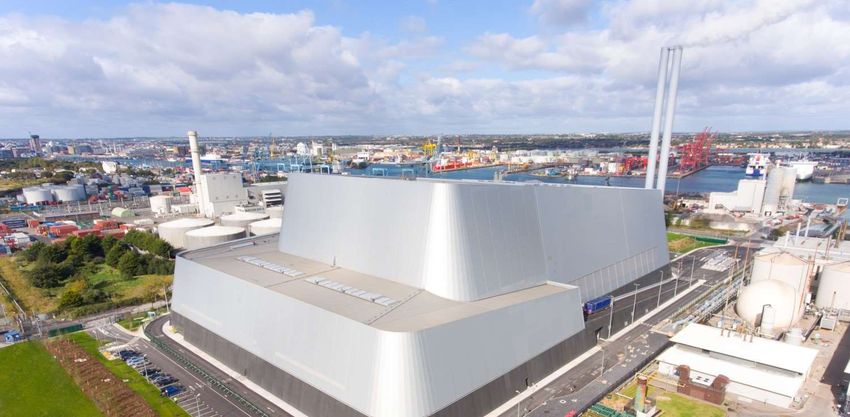
Irreplaceable Infrastructure

                                      Advantages
            •   Concentrated in attractive, densely-populated markets
            •   Continued decline in available proximate landfill capacity
            •   Cost advantage vs. long haul transfer to landfills
            •   Electricity sold at high demand points                       5
COVID-19: Limited Overall Impact to Waste Revenue

                                2019 Waste and Service Revenue: $1.39 billion

Majority of waste and services revenue is related to residential waste and has been largely unaffected

                                                                                                     6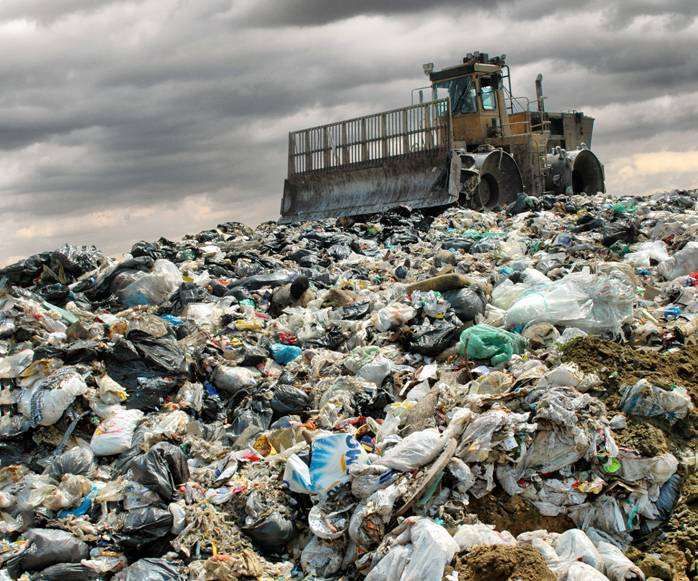
COVID-19: Potential Financial Impacts

Category                                                                     Drivers
                           •   Certain commercial MSW and profiled waste volumes replaced at lower prices
                                    −   Currently impacting monthly tip fee revenue by ~$5 million ($4 to $6 per ton)
Waste
                           •   Lower environmental services volumes relating to commercial and industrial activity
                                    −   Revenue currently down ~15-20%, with corresponding reduction in variable costs

                           •   Higher plant operating costs (e.g., supplies, overtime)
Operations                 •   Inefficiencies in challenging operating environment
                           •   Maintenance outage timing and potential for increased unplanned downtime

                           •   Discretionary cost reductions
                           •   Corporate hiring freeze and temporary salary reductions / furloughs
Cost Reduction Program
                           •   Incentive compensation (bonus) tied to Adjusted EBITDA
                           •   Targeting $15 - $30 million in 2020 savings

  COVID-19 is currently affecting financial results in several areas, with the ultimate impact for
          2020 to be determined by the course of the pandemic and macroeconomy

                                                                                                                         7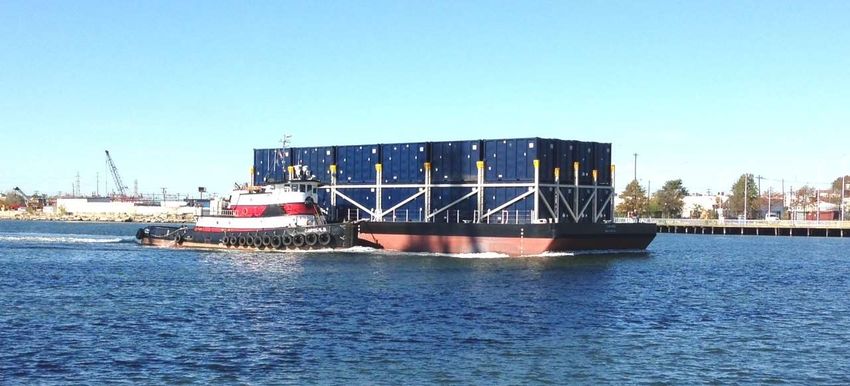
Growth Strategy

                   Organic Growth                                            UK/Ireland Expansion
• Leverage critical infrastructure assets and favorable     • Strong market fundamentals for WtE development
  waste market dynamics                                       - Declining landfill capacity
• Grow Environmental Solutions business to expand             - Supportive policy
  revenue opportunities and attract higher price waste        - Higher energy prices than US
  at WtE plants
                                                            • Capital-efficient investment model via JV with Green
• Metals recovery and ash processing to grow material         Investment Group
  sales and reduce cost
                                                            • Robust Pipeline
• Continuous Improvement / Lean Six Sigma driving             - 3 projects in construction and 1 in advanced
  record facility production                                    development
                                                              - Multiple earlier stage opportunities

   Target 3% to 5% organic growth rate in Adjusted EBITDA   ~$40 million Free Cash Flow contribution from initial 4 projects

                                                                                                                               8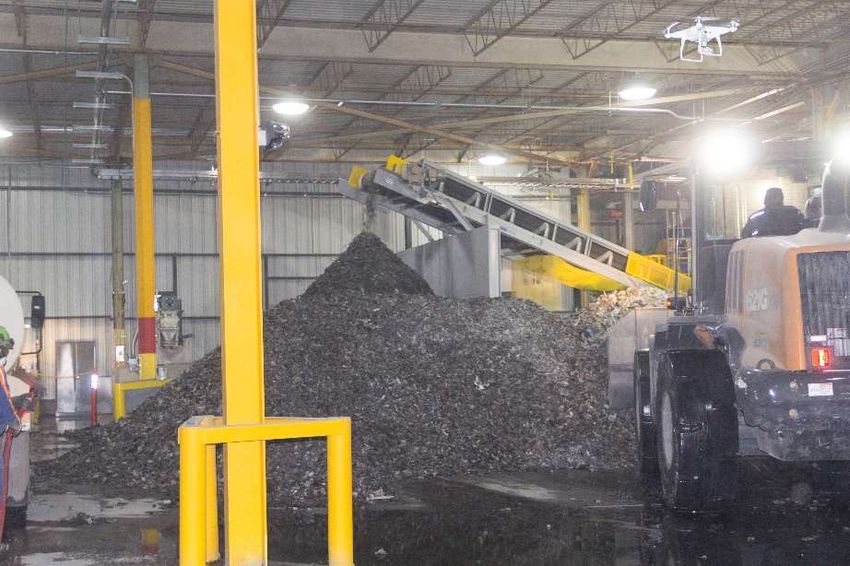
Growth Drivers: Environmental Solutions

 WtE Profiled Waste                          Environmental Services
 • Unmatched WtE footprint                   • Network of material processing
                                              facilities integrated with WtE
 • Assured destruction / zero landfill
                                              plants to drive internalization
  disposal for non-hazardous waste
                                             • Wide range of solid and liquid
 • Compliant solution for regulated
  medical waste and                      +    waste processing, recycling and
                                              field services capabilities
  pharmaceutical disposal
                                             • US industrial economy and
 • Drives higher average waste
                                              corporate sustainability initiatives
  revenue per ton                             supporting strong growth rate

    ~$110 million 2019 Revenue                 ~$140 million in 2019 Revenue

   Comprehensive sustainable solutions for government, commercial,
          industrial and medical / pharmaceutical sectors

                                                                                     9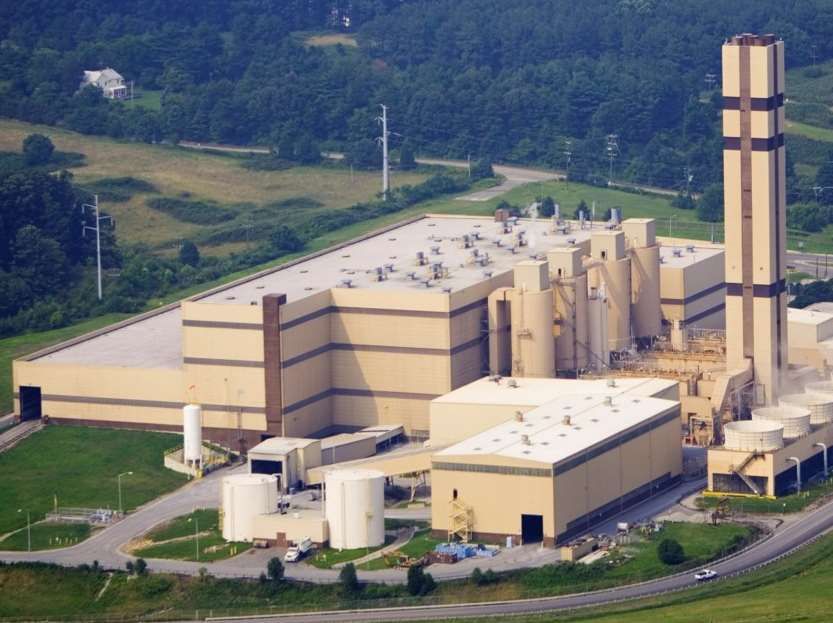
Growth Drivers: Metal Recovery and Ash Management

                                        2. Metals
       1. WtE Plant
                                      Processing for               3. Enhanced Metal Recovery and Ash Reuse
     Recovery Systems
                                    Enhanced Product

• Significant cumulative     • Centralized processing of    • First Total Ash Processing System or “TAPS” in startup and
  growth in recovery: +40%     ferrous and non-ferrous        commissioning phase
  ferrous and +220% non-     • Increases product value      • Returns driven by incremental metal recovery, sale of
  ferrous since 2012
                               and marketability              aggregates and 65% reduction in disposal volume
• Continued focus on         • Non-ferrous processing       • Target additional site developments once technology
  optimizing recovery
                               separates higher value         commercially proven – both centralized facilities and
                               metals and materially          facility-adjacent
                               increases realized pricing

                                                                                                                           10
Growth Drivers: UK/Ireland Expansion
100%
50% 50%
AssetCo
New JV
O&M Dublin Earls Gate Rookery Protos Newhurst
Projects
Powerful Growth Platform
• Strategic partnership and investment vehicle to capitalize on UK growth opportunities
• Combined resources to develop projects jointly
• Joint (50:50) Investment / ownership upon closing of project financing
• Original developer receives premium at project finance close
• Targeted project equity returns in the low to mid teens
• Covanta to provide contractual O&M services
11Growth Drivers: UK/Ireland Expansion
Earls Gate
• Location: Grangemouth, Scotland Protos
• 215k tonnes / 21 MW • Location: Cheshire, England
• Total Investment: £210 million • 350k tonnes / 45 MW
• Partners: CVA + GIG (50%) / Brockwell Energy (50%) • Non-JV Partner: Biffa
• Status: In Construction • Status: In Development
GIG brings portfolio of UK WtE Glasgow Edinburgh
Newhurst
development projects (1) • Location: Leicestershire, England
Committed to invest £3 in green Belfast • 350k tonnes / 40 MW
infrastructure over the next three • Total Investment: £340 million
years Liverpool Manchester
• Partners: CVA + GIG (50%) / Biffa (50%)
Dublin • Status: In Construction
Birmingham
Dublin Rookery
• Location: Dublin, Ireland • Location: Bedfordshire, England
London
• 600k tonnes / 60 MW • 545k tonnes / 60 MW
• Total Investment: €550 million • Total Investment: £460 million
• Partners: CVA (50%) / GIG (50%) • Partners: CVA + GIG (80%) / Veolia (20%)
• Status: Operational • Status: In Construction
Combined pipeline of advanced and early stage UK projects targeting major metro areas and
totaling ~2 million tonnes of annual processing capacity
1) Name and location of early stage GIG projects withheld due to confidentiality and commercial limitations.
12Advancing the Circular Economy
What we do every day helps our communities, clients, and customers find practical solutions to significant
societal challenges: waste and materials management, clean energy, and global climate change.
Our mission is to ensure that no waste is ever wasted.
Covanta 2016-2018 Emissions Reduction since 2007
Environmental Highlights
• More than 20 million tons of waste diverted from landfills
• Recycled nearly one million tons of waste, a 64% increase in
four years, 500 thousand of which is metal
• All Covanta Waste-to-Energy facilities are self-sustaining,
powering their operations from their combusted waste
• Collectively, Covanta facilities recover enough clean energy to
power more than one million homes for a full year
• Emissions are highly regulated, operating up to approximately
90% better than permitted standards
• Issued Inaugural Green Bond in 2019
• A new commitment to set a science-based target and
implementation plan by 2022 to achieve net zero
GHG emissions from our operations by 2050 Since Covanta launched its sustainability program in 2007,
emissions of pollutants at Covanta-operated facilities,
as measured over the three-year period from
2016-2018, have decreased by up to 69%.
*Data represents FY 2018 performance, unless otherwise noted 13Investing in our People and Communities
2018 Workforce Gender Diversity
Social Highlights
11%
• A 24% reduction in injury rate vs 2017, a record low, with 2/3 of facilities
injury-free
• Diverse workforce of which 15% are also veterans
89%
• Community Outreach Plan at 100% of facilities, where 98% have had 8 or
more community interactions
• More than 20,000 community members educated about sustainable waste Women Men
management through tours
• Globally, $1.8 million sum donated to local community groups and projects
• CEO Steve Jones joined the CEO Action for Diversity & Inclusion Pledge
2018 Workforce Ethnic Diversity
• Launched Early Career Development Program and Employee Resource
Groups to foster employee growth, leadership and mentorship opportunities
• Won several awards for being an active and responsible community member 28%
72%
Ethnic Minority Non-Minority
*Data represents FY 2018 performance, unless otherwise noted 14Cultivating Leadership and Governance
Governance Highlights
• The Nominating and Governance Committee oversees sustainability strategy and program
• Audit Committee and Nominating and Governance Committee oversee ethics, policy & compliance risk, and cybersecurity risk
• Supply Chain and Construction Committee oversees employee safety & health and environmental performance & compliance
• Strong history of Pay for Performance with significant at risk compensation for NEOs
• A culture of high standards in risk management, personal integrity and professional judgment from all employees
• Annual compliance training required
• 33% board diversity
For more information on Covanta’s sustainability policies, programs, goals and performance,
including our 2019 Sustainability Report, please visit: covanta-csr.com
*Data represents FY 2018 performance, unless otherwise noted 15Key Investment Highlights
Leader in • WtE is a unique renewable energy business
Waste-to-Energy • Compelling environmental benefits
Critical • Essential service to host communities
Infrastructure
Assets • Concentrated in attractive markets in Northeast U.S. with high barriers to entry
Attractive • Highly contracted revenue (~75%) with diversified customer base
Business Model • Generates substantial and predictable cash flow
Strong • 3-5% long-term organic Adjusted EBITDA growth rate driven by several initiatives
Growth Outlook • Strategic partnership with GIG to execute robust project development pipeline
Attractive current dividend and sustainable long-term growth
16Appendix
Waste Update

                                                                                                                                         (Unaudited)
 • Q1 2020 revenue drivers vs. Q1 2019:                                           (in millions, except price)   Q1 2020   Q1 2019     2020E
        ▪ Same store WtE tip fee revenue:                                         Waste & Service Revenue:

               ◦ Price up $7 million (5%)                                             WtE tip fees               $161      $149

               ◦ Volume up $6 million due to improved plant                           WtE service fees           118       117      465 - 475
                 availability and maintenance timing                                  Environmental services      34        32
               ◦ WtE profiled waste revenue grew by 18% (excluding                    Municipal services          55        48
                 divestitures)
                                                                                      Other                       7         7
        ▪ Manhattan MTS ramp driving municipal services
                                                                                      Intercompany               (28)      (26)

                                                                                      Total                      $346      $327
 • Trends and outlook:
                                                                                  WtE Tons: (1)
        ▪ WtE service fee, residential tip fee and municipal services
                                                                                      Tip fee contracted          2.1       2.0
          revenue performing as expected during pandemic                                                                            10.6 - 10.8
                                                                                      Tip fee uncontracted        0.6       0.5
        ▪ Certain commercial MSW and profiled waste volumes
          replaced with lower priced spot tons                                        Service fee                 2.7       2.6

        ▪ Environmental services revenue lower; variable cost                         Total                       5.3       5.2
          structure mitigates impact
                                                                                  WtE Tip Fee Revenue/Ton:

                                                                                      Contracted                $54.04    $52.64

                                                                                      Uncontracted              $82.87    $76.57

                                                                                      Average Tip Fee           $60.36    $57.66

1) Excludes liquid waste.
                                                                                                                                              18
                                      *Assumes no material operational disruptions due to COVID-19
Major Waste Contracts
2020 Tip Fee Volume by Contract Length Service Fee Facilities by Contract Length
Weighted
Weightedaverage
averagecontract
contractlength:
length:66years
years Weighted average contract length: 9 years
Years:
(Volumes in millions)
Volumes stated in millions.
Note: Tip fee volume data as of year-end 2019.
19Energy Update
(Unaudited)
• Q1 2020 revenue drivers vs. Q1 2019: (in millions, except price) Q1 2020 Q1 2019 2020E
▪ Same store WtE energy revenue: Energy Revenue:
◦ Price down $6 million Energy sales $77 $81 $255 - $270
Capacity 10 13 40
◦ Volume up $4 million
Other (1) 6 - 45
• Trends and outlook: Total $93 $94 $340 - $355
▪ Energy prices remain muted MWh Sold:
▪ Hedge activity: Contracted 0.5 0.5 2.1
◦ ~0.2 million MWh exposed for balance of 2020 Hedged (2) 0.8 0.8 3.9
◦ 2.5 million MWh already hedged for 2021 at prices Market 0.3 0.3 0.4 - 0.6
similar to 2020 hedges Total 1.6 1.6 6.4 - 6.6
▪ No meaningful power contract transitions at tip fee plants Revenue per MWh: (3)
until after 2024
Contracted $66.32 $67.33 $65
Hedged (2) $45.68 $49.67 $30
Market $19.15 $32.44 $15 - $21
Average $47.27 $51.74 $40 - $41
1) Primarily components of wholesale energy load serving revenue not included in Energy sales line, such as transmission and ancillaries and for 2020, RECs sold bundled with energy.
2) Hedged MWhs and revenue includes hedge from wholesale energy load serving.
3) Excludes capacity and other energy revenue.
20
*Assumes no material operational disruptions due to COVID-19Long-term Outlook: Energy Detail
(Unaudited, in millions, except price) 2018A 2019A 2020E 2021E 2022E 2023E 2024E
MWh Sold – CVA Share:
Contracted 2.1 2.1 2.1 2.1 2.1 2.0 2.0
Hedged (1) 3.1 3.0 3.9 2.5 0.7 0.2 -
Market 1.3 1.3 0.6 2.0 3.8 4.3 4.5
Total MWh Sold 6.5 6.4 6.6 6.6 6.6 6.5 6.5
Market Sales (MWh) by Geography:
PJM East 0.6 0.6 0.1 1.0 2.1 2.5 2.7
NEPOOL 0.2 0.3 0.1 0.3 1.1 1.2 1.2
NYISO 0.1 0.1 0.1 0.2 0.3 0.3 0.3
Other 0.3 0.3 0.3 0.4 0.3 0.4 0.4
Total Market Sales 1.3 1.3 0.6 2.0 3.8 4.3 4.5
Revenue per MWh: (2)
Contracted $66.59 $65.80 $65
Hedged (1) $32.88 $34.29 $30
Market $37.12 $26.31 ~$18
Average Revenue per MWh $44.68 $42.81 ~$40
Capacity Revenue (3) $52 $44 $40 $40
Note: hedged generation as presented above reflects only existing hedges.
1) Hedged MWhs and revenue per MWh includes hedge from wholesale energy load serving.
2) Excludes capacity and other energy revenue.
3) Capacity revenue is approximate, includes bilateral agreements and only represents full year periods in which auctions have already settled.
21
*Assumes no material operational disruptions due to COVID-19Recycled Metals Update
(Unaudited)
($ in millions, except price; tons in
• Q1 2020 revenue drivers vs. Q1 2019: thousands) Q1 2020 Q1 2019 2020E
▪ Ferrous: Metals Revenue:
◦ Realized pricing down $2 million on lower HMS Ferrous $10 $11 $35 - $45
◦ Volume up $2 million Non-ferrous 7 9 40 - 50
▪ Non-ferrous: Total $17 $21 $75 - $95
◦ Realized pricing down $2 million on timing of Tons Recovered:
deliveries of high value metals
Ferrous 110 96 430 - 440
Non-ferrous 12 13 50 - 55
• Trends and outlook:
▪ HMS index at $224 per ton in April, while May is Tons Sold:
expected to price closer to $200 per ton Ferrous 97 84 380 - 390
▪ Old Cast index at $0.41 per pound in April, while prices
Non-ferrous 8 8 35 - 40
are expected to trend lower in May
Revenue per Ton Sold:
▪ TAPS currently in testing and commissioning phase;
expected to ramp up gradually over the course of 2020 Ferrous $107 $137 $85 - $115
Non-ferrous $849 $1,123 $1,100 - $1,200
Average HMS index price (1) $236 $306 $200 - $225
Average Old Cast Aluminum (2) $0.39 $0.45 ~$0.36
1) 2020 and 2019 average #1 Heavy Melt Steel composite index ($ / gross ton) as published by American Metal Market.
2) 2020 and 2019 average Old Cast Aluminum Scrap ($ / pound) calculated using the high price as published by American Metal Market.
22
*Assumes no material operational disruptions due to COVID-19Maintenance and Operating Expenses
(Unaudited)
• Q1 2020 drivers vs. Q1 2019: (in millions) Q1 2020 Q1 2019 2020E
▪ 2020 first quarter saw modest expense benefit from timing Plant Maintenance Expense:
and scope of planned outages WtE $90 $93 $290 - $300
▪ Higher other plant operating expense related to NYC MTS Other 2 2
and wholesale energy load serving Total $91 $95
• Trends and outlook: Maintenance Capex:
WtE $34 $29 $140 - $150
▪ Estimate range for 2020 WtE maintenance spend unchanged
Other 6 2 10
◦ Includes ~$20 million for SEMASS baghouse
Total $40 $31 $150 - $160
◦ Weighted to 2H (vs. prior years) given outage deferrals
related to COVID-19
Total WtE Maintenance Spend $124 $122 $430 - $450
◦ Total spend for 2020 subject to revision pending ability
to complete outage plan in calendar year
Other Plant Operating Expense:
▪ Long-term WtE maintenance spend expected to remain in
the $430 - $450 million range WtE $186 $185
Other 83 79
▪ Other plant operating expense to reflect:
Total $269 $264
◦ Higher costs related to COVID-19 response, TAPS start-
up and wholesale energy load serving
Other Operating Expense $12 $17
◦ Reductions due to lower discretionary expenses and
lower variable costs for environmental services
23
*Assumes no material operational disruptions due to COVID-19Growth Investment Outlook
FY 2020
(Unaudited, in millions) Q1 2020 FY 2019 Estimate
Organic growth investments (1) $- $13 $-
New York City MTS contract - 19 -
Total Ash Processing System 8 9 15
Acquisitions - (2) -
International developments (2) 2 17 2
Total growth investments $10 $56 $17
Proceeds from asset sales (3) $3 $28 $3
Note: 2020 outlook for acquisitions, UK investments and proceeds from asset sales to be updated as transactions are completed.
1) Organic growth programs are focused primarily on growing waste, energy, and metal revenue generated by our existing assets.
2) Includes early site work on UK projects and investments in Earls Gate, Newhurst and Zhao County, net of third-party project equity collateralized loan for Zhao County.
3) Includes gross cash received for sales and premiums/development fees received for development projects. 24Illustrative JV Accounting
JV Financials Impact on CVA Statements JV Financials Impact on CVA Statements
Income Statement Cash Flow Statement
Revenue $110 O&M Revenue $30 Net Income $20 Net Income $15
Operating Expenses (50) O&M Expense (25) + D&A 20 - Equity in Income (10)
Adjusted EBITDA $60 O&M Margin $5 Operating Cash Flow $40 + Dividends 8 (50% JV Div)
D&A (20) - Maintenance Capex (5) Free Cash Flow $13
Interest (20) Free Cash Flow $35
Tax 0 Equity in Income 10 (50% JV NI) - Debt Principal (20)
Net Income $20 Net Income $15 Dividends $15
Covanta nets $5 million from its O&M contract, as well as a 50% Subtracting the Equity in Income, which is non-cash, and adding
share in the facility’s net income, totaling $15 million in net the 50% dividend share results in a $12.5 million benefit to Free
income to CVA Cash Flow
Adjusted EBITDA Balance Sheet
Net Income $20 Net Income $15 Assets $550 Equity in Unconsolidated $50
+ Interest 20 + Proportional Interest 10 Debt 450
+ D&A 20 + Proportional D&A 10 Equity 100
+ Taxes 0 + Proportional Taxes 0
Adjusted EBITDA $60 Adjusted EBITDA $35
Adding back 50% of JV D&A and Interest results in $35 million Half of the $100 million in equity on the facility’s balance sheet is
of Adjusted EBITDA to CVA recognized on Covanta’s balance sheet
25Capitalization Summary
• Average debt maturity of ~9 years
(Face value; unaudited, in millions) 3/31/2020 12/31/2019 12/31/2018
Cash and cash equivalents $42 $37 $58
Corporate debt:
Secured $701 $659 $671
Unsecured 1,744 1,744 1,694
Total corporate debt $2,445 $2,403 $2,365
Project debt 129 131 150
Total debt $2,574 $2,534 $2,515
Net debt (1) $2,524 $2,483 $2,438
Stockholders’ equity $303 $376 $487
Credit Ratios:
Consolidated leverage ratio (1) 6.0x 6.1x 5.6x
Senior Credit Facility Leverage Ratio (2) 2.2x 2.2x 2.2x
1) Consolidated Leverage Ratio is equal to net debt, calculated as total principal amount of debt outstanding less cash and cash equivalents, debt service principal-related restricted funds ($3 million at
March 31, 2020) and escrowed construction financing proceeds ($5 million at March 31, 2020) divided by Adjusted EBITDA, excluding Dublin project proportional Adjusted EBITDA but including
dividends from the Dublin project. 26
2) Leverage ratio as calculated for senior credit facility covenant. Effectively represents leverage at Covanta Energy, LLC and subsidiaries and ratio is pro forma for acquisitions.Non-GAAP Reconciliation: Adjusted EBITDA
Q1
(Unaudited, in millions) 2020 2019
Net (loss) Income $(32) $5
Depreciation and amortization expense 58 55
Interest expense 34 36
Income tax expense (5) 2
Impairment charges 19 -
Accretion expense 1 1
Severance and reorganization costs - 7
Stock-based compensation expense 8 8
Loss on asset sales - 1
Capital type expenditures at client owned facilities (1) 14 13
Net gain on sale of business and investments (9) (50)
Loss on extinguishment of debt - -
Business development and transaction costs - -
Property insurance recoveries, net - -
Adjustments to reflect Adjusted EBITDA from unconsolidated investments (2) 6 6
Other 3 -
Adjusted EBITDA $97 $84
1) Adjustment for impact of adoption of FASB ASC 853 – Service Concession Arrangements.
2) Adjustment beginning in 2018 to equity in income from unconsolidated investments to adjust for the proportional impact of depreciation & amortization, interest expense, 27
and taxes at the unconsolidated subsidiary (Proportional Adjusted EBITDA).Non-GAAP Reconciliation: Adjusted EBITDA and
Free Cash Flow
Q1
(Unaudited, in millions) 2020 2019
Adjusted EBITDA $97 $84
Cash paid for interest, net of capitalized interest (39) (47)
Cash paid for taxes, net (1) (1)
Capital type expenditures at client owned facilities (1) (14) (13)
Equity in net income from unconsolidated investments (1) -
Adjustments to reflect Adjusted EBITDA from unconsolidated investments (2) (6) (6)
Dividends from unconsolidated investments - -
Adjustment for working capital and other 25 20
Net cash provided by operating activities $61 $37
Changes in restricted funds - operating (3) (2) -
Maintenance capital expenditures (40) (31)
Free Cash Flow $19 $6
1) Adjustment for impact of adoption of FASB ASC 853 – Service Concession Arrangements.
2) Adjustment beginning in 2018 to reconcile equity in income from unconsolidated investments to proportional Adjusted EBITDA.
3) Adjustment for the impact of the adoption of ASU 2016-18 effective January 1, 2018. As a result of adoption, the statement of cash flows explains the change during the period in
the total of cash, cash equivalents, and amounts generally described as restricted cash or restricted cash equivalents. Therefore, changes in restricted funds are eliminated in 28
arriving at net cash, cash equivalents, and restricted funds provided by operating activities.Non-GAAP Financial Measures
Free Cash Flow
Free Cash Flow is defined as cash flow provided by operating activities, plus changes in restricted funds - operating, less maintenance capital expenditures, which are capital expenditures
primarily to maintain our existing facilities. We use the non-GAAP measure of Free Cash Flow as a criteria of liquidity and for performance-based components of employee compensation.
We use Free Cash Flow as a measure of liquidity to determine amounts we can reinvest in our core businesses, such as amounts available to make acquisitions, invest in construction of
new projects, make principal payments on debt, or amounts we can return to our stockholders through dividends and/or stock repurchases.
In order to provide a meaningful basis for comparison, we are providing information with respect to our Free Cash Flow for the three and three months ended March 31, 2020 and 2019
reconciled for each such period to cash flow provided by operating activities, which we believe to be the most directly comparable measure under GAAP.
Adjusted EBITDA
We use Adjusted EBITDA to provide additional ways of viewing aspects of operations that, when viewed with the GAAP results provide a more complete understanding of our core
business. As we define it, Adjusted EBITDA represents earnings before interest, taxes, depreciation and amortization, as adjusted for additional items subtracted from or added to net
income including the effects of impairment losses, gains or losses on sales, dispositions or retirements of assets, adjustments to reflect the Adjusted EBITDA from our unconsolidated
investments, adjustments to exclude significant unusual or non-recurring items that are not directly related to our operating performance plus adjustments to capital type expenses for our
service fee facilities in line with our credit agreements. We adjust for these items in our Adjusted EBITDA as our management believes that these items would distort their ability to
efficiently view and assess our core operating trends. As larger parts of our business are conducted through unconsolidated investments, we adjust EBITDA for our proportionate share of
the entity's depreciation and amortization, interest expense, tax expense and other adjustments to exclude significant unusual or non-recurring items that are not directly related to the
entity's operating performance. in order to improve comparability to the Adjusted EBITDA of our wholly owned entities. We do not have control, nor have any legal claim to the portion of
our unconsolidated investees' revenues and expenses allocable to our joint venture partners. As we do not control, but do exercise significant influence, we account for these
unconsolidated investments in accordance with the equity method of accounting. Net income (losses) from these investments are reflected within our consolidated statements of
operations in Equity in net income from unconsolidated investments. In order to provide a meaningful basis for comparison, we are providing information with respect to our Adjusted
EBITDA for the three and three months ended March 31, 2020 and 2019, reconciled for each such period to net income and cash flow provided by operating activities, which are believed
to be the most directly comparable measures under GAAP.
Our projections of the proportional contribution of our interests in the Joint Venture to our Adjusted EBITDA and Free Cash Flow are not based on GAAP net income/loss or Cash flow
provided by operating activities, respectively, and are anticipated to be adjusted to exclude the effects of events or circumstances in 2020 that are not representative or indicative of our
results of operations and that are not currently determinable. Due to the uncertainty of the likelihood, amount and timing of any such adjusting items, we do not have information
available to provide a quantitative reconciliation of projected net income/loss to an Adjusted EBITDA projection.
29You can also read