PIZZA CORPORATE PRESENTATION - MAY 2020 SHAKEY'S PIZZA ASIA VENTURES, INC - AWS
←
→
Page content transcription
If your browser does not render page correctly, please read the page content below
SHAKEY’S PIZZA ASIA VENTURES, INC.

PIZZA
CORPORATE PRESENTATION
MAY 2020
Company Overview
     SNAPSHOT                                                                                                              FULL-YEAR FINANCIALS
 •   Shakey’s Pizza Asia Ventures, Inc. is one of the leading operators of fast casual restaurants in
     the Philippines, focused on family casual dining.                                                            Revenues (In USD Mill)
 •   The Shakey’s brand is the Philippines’ #1 full-service pizza chain with over 65% market share in                            152             165        176
     that category. It is also the single-largest brand of full-service casual dining chain restaurants in        120    140
     the Philippines.* It is a strong and well-established brand thanks to a differentiated menu,
     iconic and well-loved products, a distinct store environment, and highly guest-centric service.
 •   The Peri brand is an emerging fast casual and full-service restaurant chain in the Philippines. Its
     mainstay is charcoal-grilled chicken, marinated for 24 hours, served with an assortment of                   2016*     2017       2018      2019*      2020F**
     unique sauces to choose from.
 •    Vision: To be the preferred and dominant family casual dining restaurant in the Philippines,                Net Income (In USD Mill)
      and successful in our chosen overseas markets, serving pizza as our core product.
                                                                                                                          15       17      18                 19
                                                                                                                   13
 •    Store Network: 270+ Shakey’s and Peri stores across the Philippines – a mix of company-
      owned and franchised. Different store formats including those located in malls and those that
      are free-standing.
 •    Key Management: Vicente L. Gregorio - President & CEO, Manuel T. del Barrio - Vice                          2016*         2017   2018       2019*      2020F**
      President & CFO, Jorge Q. Concepcion - Shakey’s General Manager, Marielle C. Santos – Peri
      General Manager, Alois Brielbeck - In-House Commissary General Manager                                                              *Based on recurring figures
                                                                                                                                        **Consensus of active brokers
                                                                                   *Source: Euromonitor, 2019

     2019 SYSTEM-WIDE SALES & STORE NETWORK BREAKDOWN                                                                     OWNERSHIP STRUCTURE
                                                                                     Mindanao
                                                                                                                           Public
                                                              Company-        Visayas 4%                                    28%
                                                               Owned            10%
Delivery &                         Franchised                   53%
                                      47%                                                                Metro                                       Century
 Others
                                                                                                         Manila                                      Pacific
  45%                                                                                                                  GIC
                                Dine-In                                   Luzon                           46%                                        Group
                                                                                                                      Private
                                 55%                                     (ex-MM)                                                                      54%
                                                                                                                      Equity
                                                                           40%                                         18%
                                                                               2
Shakey’s has 45 years of
 strong brand legacy and
 counting
                                 1999                        2003
                            Acquired Shakey’s        Positioned as an American   2014
                                                          fast casual dining     Acquired Shakey’s
                             trademark for the
                                                       restaurant for families   trademark for Middle East,
                         Philippines in perpetuity
                                                                                 Asia (ex Japan, Malaysia)
                                                                                 including China, Australia,
                   1987                                                          and New Zealand in
The Prieto family became                                                         perpetuity
  the master franchisor in
           the Philippines                                                              2016
                                                                                        Century Pacific
                                                                                        Group (CPGI) and
             1975                                                                       Arran (GIC) acquired
    First store in the
                                                                                        control and took the
          Philippines
                                                                                        Company public

           1954                                                                          2019
First Shakey’s Pizza                                                                     Acquired Peri-Peri
   Parlor opened in                                                                      Charcoal Chicken
       Sacramento,                                                                       and Sauce Bar, 276
          California                                                                     stores by end 2019
                                                        3
INVESTMENT
  HIGLIGHTS

Investment Highlights
                             • Dominates the full-service pizza chain market with 67%* market share
                 Market
                             • 23%* market share in the full-service (pizza and non-pizza) category - #1 in that
              Leadership       space as well

                             • Well-loved brand with more than 40 years of history in the Philippines
       Brand Strength
                             • Iconic products served in a distinct store environment
         & Ownership         • No royalty payments, plus additional revenues from franchisings

                             • Multiple sales channels and store formats; simple operations
             Scalable
                             • Low upfront cost and strong cash generation lead to shorter store-level payback
       Business Model          periods compared to the industry

                             • Extensive track records in food and restaurant operations
           Experienced
                             • Entry of Century Pacific Group as strong and committed shareholders provides
          Management           synergies with other food businesses

                             • Superior profitability and margins versus peers
    Industry-Leading         • Gearing levels improve as debt remains stable while EBITDA and equity grow
           Financials        • Operating cash flows sufficient for CapEx and other investments

*Source: Euromonitor, 2019                             5
1
             #1 Full-Service Restaurant
             in the Philippines
             The full-service pizza chain market is dominated by Shakey’s.

FULL-SERVICE CHAIN                                                           FULL-SERVICE PIZZA CHAIN
                                                                                     Others
                                                                          Papa John's 4.2%
                                                                             1.4%
                                            23.4%

       Others
                                                              Pizza Hut
       35.4%
                                                               27.1%
                                                                                                      67.3%
                                             Max's
                                             18.0%
   Classic Savory
       3.3%
       Pancake House              Pizza Hut
           4.4%      Kenny Rogers   9.4%
                        6.1%

         Latest Euromonitor report states that                        2019 data shows that Shakey’s
      Shakey’s leads the Philippine chained full-                       dominates the full-service
        service restaurant industry with 23.4%                         pizza chain market by sales
               market share as of 2019.                                 since 2011 until present.

Source: Euromonitor                                      6
2
                 Strong and
                 Well-Established Brand
                 Shakey’s offers a differentiated menu with iconic and well-loved products.

    DIFFERENTIATED MENU WITH ICONIC PRODUCTS AND OFFERINGS FOR ALL

                             Pizza                                                        Soup
                             World-famous thin crust and hand-tossed                      Home-style soups loaded
                             pizzas with many different choices                           with flavor and goodness

                             Chicken and Mojos                                            Salad
                             Signature dish - fried chicken paired                        Extensive choice of salad for
                             with Shakey’s famous mojos*                                  health-conscious customers

                             Pasta                                                        Desserts
                             Hearty pasta with a wide range of sauces                     Wide range of after-meal
                             and toppings paired with garlic bread                        desserts

                             Starters
                             Ranging from fries, mojos,
                             squid rings, chips, and chicken

    BUNDLED OFFERINGS CATERING
    TO FAMILIES AND GROUPS
    BRING UP AVERAGE CHECKS

*Thinly-sliced potatoes coated with Shakey’s breading
and fried to a golden brown perfection                               7
2
         Strong and
         Well-Established Brand
         Shakey’s offers a beautiful and distinct store environment to every customer
         and has full control and ownership of its brand.

         Though originally from the U.S.,          With its over 40 year history in the Philippines,
          PIZZA has owned the Shakey’s               Shakey’s is one of the most recognizable
       brand for the Philippines since 1999.         brands in the local food service industry.

BRAND OWNERSHIP                                2018 PHILIPPINE TOP 100 RESTAURANT BRANDS
•   No royalty payments, leading to                      1                               2                                       3
    shorter payback period and sustainably
    higher margins versus peers
•   Revenue from licensing fees and
    royalties from franchisees
•   Freedom to execute and react faster to
    market changes
•   Opportunity for expansion into
    international markets
                                                     8          Source: Asia’s Top 1000 Brands Survey by Campaign Asia, in partnership with Nielsen
3
    Proven and Scalable
    Business Model
    Multiple sales channels and store formats provide convenience and accessibility
    to Shakey’s customers and allow for market and expansion flexibility.

         Dine-In                                                 Functions
         • Most popular sales channel due to                     • Free-standing stores have function
           unique family and friends experience                    rooms for events such as parties and
         • Aim to “WOW” the guest                                  company gatherings

         Delivery                                                Online Sales
         • Delivery available nationwide                         • Active online and mobile presence
                                                                   with own website and mobile app
         • Single delivery hotline number
           (#77-777) can be used                                 • http://www.shakeyspizza.ph

         Carryout                                                SuperCard+
                                                                 •  A very popular paid loyalty card
         • Convenient and fast method of sales
                                                                 •  PHP499 annual fee

    55%                                     41%                                          4%
 Mall Stores                       Free-Standing Stores                                  Others
120 – 250 sqm                         300 – 400 sqm                                   120 – 180 sqm

                                                  9
3
       Proven and Scalable
       Business Model
       Shakey’s is a well-established brand, while operating on an asset-light model.

      1
  Brand
                                  2
                              Vertical
                                                               3
                                                         Asset-Light
                                                                                           4
                                                                                  Short Payback
Positioning                 Integration                  Approach                    Period
Firmly positioned           Own commissary                Long-term leases          Business model and
in the fast casual            for proprietary            for store locations       strong discipline leads
 segment (A, B,                raw materials                 at attractive            to typical payback
   and upper C                  protects key                    rentals              period of 3-4 years
                            supply chain and
   market) that
                                 maintains                   Presence of           Low upfront cost and
   delivers high             consistency and
 margins, good                                           standalone stores        strong cash generation
                                control over             (i.e. those outside             per store
  volumes, and                    quality                malls) lead to low
       scale                                             rent-to-sales ratio
                              Economies of
 Benefitting from               scale and
   key consumer                purchasing
                                 synergy
  trends – eating
   out more and
 upgrading from
fast food to casual
       dining

                                                   10
4 Experienced Management Team
VISION: to be the PREFERRED and DOMINANT family casual dining restaurant
Highly experienced
• Over 30 years of successful experience in the food
business; proven management and leadership track
VICENTE record in foodservice retail set-up, expansion, and
professionals in their GREGORIO turnaround management
Started career in the first ever Shakey’s branch in the
respective areas of President & CEO •
Philippines; key driver of Shakey’s brand strategy,
organization culture, core values, and mission since 2003
expertise; governance
mantra of recruiting the MANUEL
• Previously Assistant Vice President for Finance of Century
Pacific Food, Inc. (CNPF) and The Pacific Meat Company,
best home-grown or DEL BARRIO
•
Inc.
Worked in accounting positions at several leading
VP & CFO
external talent companies
JORGE • Over 30 years of experience in consumer-related
BOARD COMPOSITION CONCEPCION
business
• Significant experience in the U.S. foodservice industry for
GM – Shakey’s about 10 years in numerous managerial positions
9
Members
MARIELLE
SANTOS
GM - Peri
•
•
Over 20 years of experience in the food service industry
Previously held several leadership roles at Shakey’s with a
proven track record, handling human resources, guest
engagement, and the delivery business
DIRECTORS INDEPENDENT
DIRECTORS
• Over 30 years of experience in the foodservice business
4
• Audit Committee ALOIS • Moved to Asia in 1986, taking up positions in pastry
kitchens in Hong Kong and Tokyo
• Board Risk Oversight Committee BRIELBECK
GM – In-House • Moved to the Philippines in 2000 as Chief Operating
• Corporate Governance Committee Officer for Culinary Systems Specialists Incorporated
Commissary
Committees* • Related Party Transactions Committee • Appointed as Commissary General Manager in 2005
*All chaired by an Independent Director
115 Industry-Leading Profitability
Shakey’s generates superior margins versus peers.
MARGINS RETURN ON EQUITY
20.0% 16.8% 20.8% 16.8% 19.7% 16.0% 18.8%
14.6%
EBITDA Margin
2016* 2017 2018 2019**
19.7% 19.8% 20.5%
14.3% 20.1% 13.3% 13.9% 15.1% PIZZA Industry Average***
2016* 2017 2018 2019** FREE CASH FLOW TO SALES
PIZZA Industry Average***
15.6%
8.6% 6.4% 4.2% 7.2%
5.2% 2.9% 1.7%
2016* 2017 2018 2019**
Net Margin
PIZZA Industry Average***
11.1% 7.1% 10.9% 11.1% 11.2%
6.9% 6.8% 6.6%
OPERATING CASH FLOW TO SALES
2016* 2017 2018 2019**
PIZZA Industry Average*** 20.7%
15.5%
11.8% 13.9% 9.8% 12.2% 9.8% 13.3%
*Based on recurring figures
**Based on recurring figures and available peer information as of 14 May 2020
2016* 2017 2018 2019**
***Composed of publicly listed Philippine foodservice restaurant companies
12 PIZZA Industry Average***LATEST RECURRING
FINANCIAL
PERFORMANCE
& OUTLOOKFinancial Results Highlights
EBITDA NET INCOME
GROWTH GROWTH
13% +12% +10% +8%
FY 4Q FY 4Q
SAME-STORE SALES SYSTEM-WIDE SALES TOTAL REVENUE
GROWTH GROWTH GROWTH
1% 3% +11% +17% +9% +12%
FY 4Q FY 4Q FY 4Q
*Unless indicated, all figures presented are pre-IFRS 16. 14FY 2019 Summarized P&L
In PHP Mill FY 2018 FY 2019 Change YoY
System-wide Sales 9,361 10,384 11%
Total Revenue 7,579 8,239 9%
Cost of Sales (5,399) (5,843) 8% • Double-digit sales growth driven
Gross Profit 2,179 2,396 10% by STORE NETWORK
Operating Expenses (973) (1,056) 8%
EXPANSION AND PERI
ACQUISITION
EBITDA 1,497 1,690 13%
EBIT 1,206 1,341 11%
Income before Tax 1,082 1,191 10% • IMPROVEMENT IN GROSS
Net Income 841 924 10% MARGIN due to subdued raw
Earnings per Share 0.55 0.60 10% material prices and favorable FX
Margins • IN-STORE AND CORPORATE
Gross Profit 28.8% 29.1% +0.3 pps
EFFICIENCY PROGRAMS
continue to drive operating
EBITDA 19.8% 20.5% +0.7 pps
margins higher
EBIT 15.9% 16.3% +0.4 pps
Net Income 11.1% 11.2% +0.1 pps
• Recurring earnings hit DOUBLE-
Post-IFRS 16 DIGIT GROWTH TARGET
Net Income 841 865 3%
Earnings per Share 0.55 0.57 3%
*Unless indicated, all figures presented are pre-IFRS 16. 15Top Line Growth Driven by Shakey’s Store
Expansion and Peri Acquisition; SSSG
Flattish on the Back of No Price Increase
System-wide Sales SSSG & Total Store Count Revenues
In PHP Bill In PHP Bill
4% 1%
11% 9%
YoY Growth 279 YoY Growth
in FY19 230 30 in FY19
2 3
9.4 10.4 8.2
7.6
246
228
FY18 FY19 FY18 FY19 FY18 FY19
Peri Stores Shakey's Int'l Stores
Shakey's PH Stores SSSG
• 49 NET STORE ADDITION for the full year is primary driver of sales and revenue
• FLATTISH SSSG due to no price increase amidst favorable costs and competitive
delivery environment
*Unless indicated, all figures presented are pre-IFRS 16. 16SSSG Recovers in Q4; Further Accelerates
in January-February 2020
System-wide Sales by Channel SSSG
In PHP Bill
Others
2% Delivery & 7%
4%
2%
3%
Carry-Out -1% -1%
37%
9.4
Dine-In 2.3 2.6 2.5 3.0
61%
FY18 1Q19 2Q19 3Q19 4Q19 Jan-Feb
2020
System-wide Sales SSSG
• PICK-UP IN SALES BEGINNING Q4 driven by improved consumer sentiment, success
of value-for-money initiatives, and an enhanced delivery presence
*Unless indicated, all figures presented are pre-IFRS 16. 17Store Network Expansion Strategy
as Key Driver of Sustained Double-
Digit Sales Growth
Domestic Store Network Breakdown by Region
Total PH Store Network
As of end 2019
40% +18
Luzon Ex-MM
+1 MM, +17 Ex-MM
246 +7
228
46%
Metro Manila (MM)
23 30
10% As of Dec 2018 As of Dec 2019 As of Jun 2019 As of Dec 2019
Visayas
• Pursuing UNDERPENETRATED SECOND-
4% TIER CITIES via Shakey’s franchisee-led
expansion
Mindanao
• Accelerated Peri store expansion beginning
with UNSERVED METRO MANILA DEMAND
*Map colors show % population of the country by region.
The darker the color, the higher the % population. 18
Source: Philippine Statistics Authority 2015Higher Margins Driven by Subdued
Input Costs and Efficiency Programs
FY19 Net Income Margin Bridge Operating Expense Interest Expense
In PHP Mill In PHP Mill
12.8% 12.8%
0.3pps 0.2pps
11.1% 11.2%
Gross Interest, 1,056
Margin Taxes & Others 973
2.5% 2.5%
209
+0.1 pps 189
+8% +11%
FY 2019
FYFY 2018Net Gross Margin
2018 Tax Growth FY 2019 FY18 FY19 FY18 FY19
Net Income Net Income
Margin Growth Revenues
Margin Margin OpEx as % of Sales Interest Expense as % of Sales
• SUBDUED INPUT COSTS AND “FIT-FOR-GROWTH” EFFICIENCY INITIATIVES drive
operating margins higher
• Upside PARTIALLY OFFSET BY HIGHER INTEREST COST to finance Peri acquisition
*Unless indicated, all figures presented are pre-IFRS 16. 19Industry-Leading Profitability an
Advantage in Current Environment
Gross Margin Operating Margin EBITDA Margin Net Margin
28.8% 29.1%
19.8% 20.5%
15.9% 16.3%
11.1% 11.2%
+30 bps +40 bps +70 bps +10 bps
FY18 FY19 FY18 FY19 FY18 FY19 FY18 FY19
• EFFICIENCY-DRIVEN IMPROVEMENT IN OPERATING MARGINS alongside
subdued costs
• HIGHER INTEREST EXPENSE on the back of Peri acquisition keep net margins stable
*Unless indicated, all figures presented are pre-IFRS 16. 20Robust Sales and High Margins Led
to Healthy Cash Flow Generation
Free Cash Flow Bridge Interest-Bearing Debt
No maturities
In PHP Mill In PHP Mill in 2020
2,000
554 23 19 1,704 417
13%
YoY Growth
1,500
1,287 in FY19
1,108 4,387
3,885
1,000
500
0
Profit before Depreciation & Working Income Tax & Operating CapEx Free Cash Flow
FY18 FY19
Tax Amortization Capital Others Cash Flow
• Operating cash flows MORE THAN ENOUGH TO COVER CAPITAL EXPENDITURES,
DIVIDENDS, AND INTEREST
• Incremental borrowing used to partially fund PERI ACQUISITION
*Unless indicated, all figures presented are pre-IFRS 16. 21Impact of PFRS 16
Variance vs. Growth vs.
FY 2018 FY 2019 FY 2019
In PHP Mill FY 2019 FY 2018
Pre-PFRS 16 Pre-PFRS 16 Post-PFRS 16
Pre-PFRS 16 Pre-PFRS 16
Total Revenue 7,579 8,239 8,239 0% 9%
Cost of Sales (5,399) (5,843) (5,827) 0% 8%
Gross Profit 2,179 2,396 2,412 1% 11%
Operating Expenses (973) (1,056) (1,052) 0% 8%
EBITDA 1,497 1,690 1,971 17% 31%
EBIT 1,206 1,341 1,360 1% 13%
Finance Cost (189) (209) (311) 49% 65%
Income before Tax 1,082 1,191 1,108 -7% 2%
Net Income 841 924 865 -6% 3%
Margins
EBITDA 19.8% 20.5% 23.9% +3.4 pps +4.1 pps
Net Income 11.1% 11.2% 10.5% -0.7 pps -0.6 pps
• Audited full-year results impacted by PFRS 16, ACCOUNTING STANDARD FOR
LEASES; Negative PHP59 million impact for FY19
*Unless indicated, all figures presented are pre-IFRS 16. 22COVID-19 UPDATE
Dramatically Reduced Operations During
Government-Imposed Quarantine
COVID-19 Update
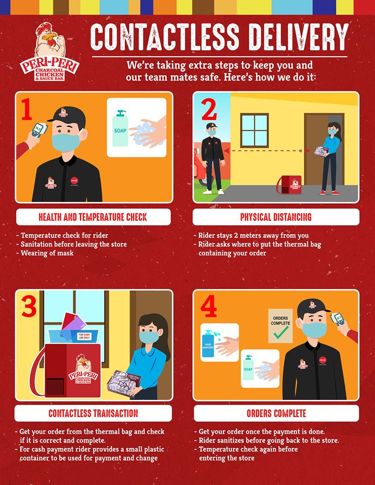
Majority of our stores remain Strict safety protocols in open
closed, following the government’s stores have been implemented.
enhanced community quarantine.
Main challenge is staffing
stores and maintaining a
minimum level of guest
experience Protective gear and Temperature checks
sanitizing equipment before entering the
Gradually opening stores for staff store
for delivery and carry-out
using volunteer staff
Health and safety of
personnel remain
paramount Shortened hours to Social distancing
provide additional measures
time for daily cleaning
24Opened Stores’ ADS at Pre-COVID-19
Levels Following Heightened
Demand for Delivery & Carry-Out
COVID-19 Update
25Multiple Sales Channel Approach,
Including a Tried-And-Tested Delivery
Platform, Bode Well During This Period
COVID-19 Update
DELIVERY HOTLINE MOBILE PARTNERSHIPS WITH FOOD AGGREGATORS
APPLICATION
IN-HOUSE RIDERS
ONLINE ORDERING
#77777 TOLL-FREE
FOR GLOBE AND TM SUBSCRIBERS
MOST RECENT ADDITION:
CURB-SIDE PICK-UP
26Priority is to Maintain a Strong Cash and
Liquidity Position, as well as Reduce Costs
COVID-19 Update
Costs, Capital Spend
Cash & Liquidity
& Working Capital
Buffers from strong end-2019 Cut capex in half and pushed back 2020
and early 2020 performance new store openings from c.40 pre-COVID-
19 to c.20 today
c.PHP1 billion in cash and c.PHP4.5 Suspending all national advertising
billion in unused credit lines and promotions; Focusing instead on
store openings and delivery availability
No upcoming loan maturities
in the next 12 months Negotiated rent waivers and extended
payment terms from suppliers
Flexible debt covenants Cuts in non-essential corporate expenses,
on existing loans establishment of freeze hire, and acceleration
of efficiency and automation programs
27Too Early to Give Guidance, But Already
Preparing for a “Post-COVID-19 World”
What could a post-COVID-19 world look like?
Brands with a strong Tempered competition Long-term structural
delivery and carry-out after years of numerous growth story of Philippine
business will outperform. new entrants. dining out remains intact.
PIZZA delivery and carry-out Post-COVID-19, a reversal Value-for-money offerings
sales as of end 2019 at 37% in the trend of heightened that WOW guests will
competition resonate
Currently channeling Shakey’s remains one of the Our business model of high
resources to delivery and most recognized and loved margins, low breakeven, fast
accelerating delivery-related brands in the food service payback, and quick cash
initiatives industry conversion provide sufficient
financial flexibilities
28OTHER FINANCIALS
Balance Sheet

  In PHP Mill                              2018             2019         In PHP Mill                     2018    2019
  Cash                                      434             508          Trade Payable and Others        920     1,075
  Inventory                                 597             477          Short-Term Debt                  48      598
  Other Current Assets                      579             956          Total Current Liabilities       968     1,673
  Total Current Assets                    1,610             1,941        Long-Term Debt                  3,837   3,789
  Property, Plant, and Equipment           1,712            1,808        Other Non-Current Liabilities   259      317
  Goodwill and Trademarks                  6,066            6,977        Total Non-Current Liabilities   4,096   4,107
  Other Non-Current Assets                  245             327          TOTAL LIABILITIES               5,063   5,779
  Total Non-Current Assets                8,023             9,112        TOTAL EQUITY                    4,570   5,274
  TOTAL ASSETS                            9,633         11,053           TOTAL LIABILITIES AND EQUITY    9,633   11,053

   •     Decrease in working capital mainly                               •   Increased short-term debt due to the
         due to NORMALIZING INVENTORY                                         PERI ACQUISITION LOAN
   •     Elevated PPE due to PERI                                         •   Long-term loan of PHP3.8 billion all
         ACQUISITION AND CAPEX FOR                                            PESO-DENOMINATED WITH FIXED
         ORGANIZATIONAL GROWTH                                                INTEREST RATES

*Unless indicated, all figures presented are pre-IFRS 16.           30
Ratios
1.33
1.01 1.00
Net Debt-to-Equity (x) 2018 2019 Pre- 2019 Post-
IFRS 16 IFRS 16
• COMFORTABLE
0.76 0.74 0.77
GEARING
Net Gearing (x) RATIOS despite
2018 2019 Pre- 2019 Post- higher interest-
IFRS 16 IFRS 16 bearing debt
due to Peri
2.59 2.60 acquisition loan
2.23
Interest-Bearing
• MAINTAINED
Debt-to-EBITDA (x) 2018 2019 Pre- 2019 Post- ABOVE-
IFRS 16 IFRS 16 INDUSTRY ROE
at 19%
20% 19% 18%
Return on Equity *Unless indicated, all figures
2018 2019 Pre- 2019 Post-
presented are pre-IFRS 16.
IFRS 16 IFRS 16
Notes: Net Debt-to-Equity = (Total Liabilities – Cash) / Total Equity Interest-Bearing Debt-to-EBITDA uses trailing 12-month EBITDA
Net Gearing = (Interest-Bearing Liabilities – Cash) / Total Equity 31 Return on Equity uses trailing 12-month earnings and average equityCash Flow
In PHP Mill FY 2018 FY 2019
Income before Income Tax 1,082 1,108
Depreciation and Amortization 231 554 • Increase in trademark
Interest Expense 189 311 reflects PERI ACQUISITION
Changes in Working Capital (378) 23
Others (203) (292)
• Capital expenditure
Net Operating Cash Flow 921 1,704 primarily for ACQUISITION
Capital Expenditures (434) (417) OF PERI STORES, IT
Acquisition of Trademark 0 (775) INVESTMENTS, AND NEW
Others 85 (307) SHAKEY’S OUTLETS
Net Investing Cash Flow (349) (1,499)
Proceeds from (Payment of) Loan (50) (300)
• Proceeds from loan used to
Payment of Interest (182) (200) finance PERI ACQUISITION
Net Financing Cash Flow (385) (133)
Effect of Exchange Rate Changes 1 2
Beginning Cash 245 434 • OPERATING CASH FLOWS
Change in Cash 189 74
MORE THAN SUFFICIENT
for regular capital
Ending Cash 434 508
expenditure
Free Cash Flow 487 1,287
*Unless indicated, all figures presented are pre-IFRS 16. 32Cash Conversion Cycle
Working Capital Receivables Inventory Payables
1,200 90 1,200 90 1,200 90 1,200 90
80
1,075
80 80 80
1,000
70
1,000 1,000 1,000 920
70 70 70
800 60
800 709 60 800 60 800 67 60
600
50
50 597 50
62 50
40 600 508 600 600
400 40 477 40 40
30
40
185 400 30 400 30 400 30
200 111 20
31
2 10 20 30 20 20
- (6) 200 24 200 200
- 10 10 10
FY18 FY19
(200) ₱ (10) ₱- - ₱- - ₱- -
Mns Days Mns FY18 FY19 Days Mns FY18 FY19 Days Mns FY18 FY19 Days
• Decrease in cash • Higher receivables driven by FRANCHISEE-LED STORE
conversion cycle NETWORK EXPANSION
relative to end • Normalizing inventory with DEPLETION OF ADVANCED
2018 to -6 DAYS PURCHASE OF CHEESE from end-2018
*Unless indicated, all figures presented are pre-IFRS 16. 33FY 2019 Summarized P&L:
Audited vs. Unaudited
FY 2019 FY 2019 FY 2019 FY 2019
Variance Variance
In PHP Mill Pre-PFRS 16 Pre-PFRS 16 Post-PFRS 16 Post-PFRS 16
in PHPm in PHPm
Unaudited Audited Unaudited Audited
Total Revenue 8,237 8,239 2 8,237 8,239 2
Cost of Sales (5,841) (5,843) -2 (5,857) (5,827) 30
Gross Profit 2,396 2,396 0 2,379 2,412 33
Operating Expenses (1,033) (1,056) -23 (1,026) (1,052) -26
EBITDA 1,694 1,690 -4 2,021 1,971 -50
EBIT 1,362 1,341 -21 1,353 1,360 7
Finance Cost (206) (209) -3 (283) (311) -28
Income before Tax 1,202 1,191 -11 1,116 1,108 -8
Net Income 923 924 1 862 865 3
Margins
Gross Profit 29.1% 29.1% 0.0 pps 28.9% 29.3% 0.4 pps
EBITDA 20.6% 20.5% -0.1 pps 24.5% 23.9% -0.6 pps
EBIT 16.5% 16.3% -0.2 pps 16.4% 16.5% 0.1 pps
Net Income 11.2% 11.2% 0.0 pps 10.5% 10.5% 0.0 pps
*Unless indicated, all figures presented are pre-IFRS 16. 34FY 2019 Summarized Cash Flow: Audited vs. Unaudited In PHP Mill FY 2019 Unaudited FY 2019 Audited Variance in PHPm Income before Income Tax 1,202 1,108 -94 Depreciation and Amortization 286 554 268 Interest Expense 206 311 105 Changes in Working Capital (119) 23 142 Net Operating Cash Flow 1,303 1,704 401 Capital Expenditures (564) (417) 147 Acquisition of Trademark (730) (775) -45 Net Investing Cash Flow (1,311) (1,499) -188 Proceeds from (Payment of) Loan 500 (300) -800 Payment of Interest (203) (200) 3 Net Financing Cash Flow 144 (133) -277 Effect of Exchange Rate Changes 0 2 2 Beginning Cash 434 434 0 Change in Cash 135 74 -61 Ending Cash 569 508 -61 Free Cash Flow 739 1,287 548 *Unless indicated, all figures presented are pre-IFRS 16. 35
FY 2019 Summarized Balance Sheet:
   Audited vs. Unaudited
                                          FY 2019     FY 2019                      FY 2019        FY 2019
                                                                Variance                                       Variance
In PHP Mill                             Pre-PFRS 16 Pre-PFRS 16                  Post-PFRS 16   Post-PFRS 16
                                                                in PHPm                                        in PHPm
                                         Unaudited    Audited                     Unaudited       Audited
Cash                                          569             508         -61        569            508          -61
Inventory                                     491             477         -14        491            477          -14
Total Current Assets                        1,823            1,941        118       1,823          1,938         115
Property, Plant, and Equipment              1,989            1,808        -181      1,744          1,615         -129
Goodwill and Trademarks                     6,796            6,977        181       6,796          6,977         181
Total Non-Current Assets                    9,074            9,112        38       10,438         10,394         -44
TOTAL ASSETS                               10,897            11,053       156      12,261         12,333         72
Trade Payable and Others                      888            1,075        187        888           1,288         400
Short-Term Debt                               698             598         -100       698            598          -100
Total Current Liabilities                   1,586            1,673        87        1,586          1,886         300
Long-Term Debt                              3,686            3,789        103       3,686          3,789         103
Total Non-Current Liabilities               3,964            4,107        143       5,675          5,378         -297
TOTAL LIABILITIES                           5,550            5,779        229       7,261          7,264          3
TOTAL EQUITY                                5,348            5,274        -74       5,000          5,069         69
TOTAL LIABILITIES AND EQUITY               10,897            11,053       156      12,261         12,333         72

 *Unless indicated, all figures presented are pre-IFRS 16.           36
STOCK & INVESTOR RELATIONS HIGHLIGHTS
Stock Highlights
                                                                                                                     Philippine
MARKET CAPITALIZATION                                                                              PIZZA             Consumer
                                                                                                                      Average
  $0.3B                     $0.2B                                        PER                         9.5x                18.4x
  December 2016                  May 2020
                                                                    EV / EBITDA                      2.7x                 7.4x

PERFORMANCE SINCE IPO                                                    ROE                       18.1%                13.6%
                                                                                                   15.9%
                                -43%
                                                               Operating Margin*                                        10.4%
 ₱11.26                                                       Net Income Margin*                   11.1%                 6.8%
        IPO Price               8 May 2020
                                                           Source: BPI Securities 2020 Estimates as of 8 May 2020
                                                           *Bloomberg, trailing 12 months

STOCK PRICE PERFORMANCE                                                                      (BLOOMBERG TICKER: PIZZA PM)
PHP/SHARE
                                                                                                                     PHP6.47
                                                                                                                      as of 7 May 2020
16.00

12.00

 8.00

 4.00
    Dec-16    Mar-17   Jun-17   Sep-17   Dec-17   Mar-18   Jun-18   Sep-18    Dec-18    Mar-19    Jun-19    Sep-19   Dec-19   Mar-20
                                                               38
Stock Highlights
DIVIDEND HISTORY SHAREHOLDERS
Others
Century Pacific Group,
0.30 23% 30% 20%
20% Matthews International Inc. (CPGI) 54%
18% Capital Management 1% • wholly owned by
0.20 20% the Philippines’ Po
Norges Bank 3% family
0.10 10% Prieto Family 4% • majority
0.10 0.10 0.10 shareholder of
0.00 0% CNPF PM and
2017 2018 2019 GIC Private Equity ALCO PM
18%
Regular Cash Payout Ratio* Foreign Ownership Limit: 100%
Free Float Level: 28%
Source: Bloomberg, May 2020
Declaration Record Payment
Date Date Date
2017 May 8 June 6 June 30
2018 August 16 September 14 October 10 Philippines’ Best Small 500 High-Growth
Cap Company Companies Asia Pacific
2019 June 20 July 19 August 14
Finance Asia Financial Times
2018 2020
*Of previous year’s recurring net income
39Investor Relations Highlights
Current Price PHP6.47 SELL-SIDE ACTIVE COVERAGE***
Range since Listing Date* PHP4.54 - 17.48 Institution Analyst Latest Call
No. of Outstanding Shares 1,531,321,053 BDO Nomura Diane Go BUY
BPI Jefferies Javier Consunji BUY
CPGI: 53.8%
Shareholding Structure CLSA Joyce Ramos BUY
Arran (GIC): 18.5%
COL Financial John Luciano BUY
27.7% (includes
Free Float Credit Suisse Hazel Tanedo OUTPERFORM
Prieto family’s 3.8%)
Daiwa Renzo Candano BUY
PHP11.2 million
3-Month Average Turnover Macquarie Karisa Magpayo OUTPERFORM
USD0.2 million
PNB Alvin Arogo NEUTRAL
PHP9.9 billion
Market Capitalization Regis Carissa Mangubat BUY
USD0.2 billion
-34.6% Unicapital Wendy Estacio HOLD
YTD Absolute Performance
YTD Relative to Index -7.0%
YTD Relative to Sector -20.5%
3-Month Absolute Performance -31.5%
3-Month Relative to Index -6.8%
3-Month Relative to Sector -17.1%
*Listing Date: 15 December 2016
**As of 8 May 2020
***At least one research report published in the past 12 months as
of 8 May 2020 40Investor Relations Highlights
PIZZA’s 2018 Glossy Annual Report can be
found on the Company’s corporate website.
Investors > Investor Presentations
https://tinyurl.com/PIZZA-Annual-Report-2018
MESSAGE FROM
THE PRESIDENT
2018. What everyone thought would be
a relatively easy, smooth-sailing year
turned out to be a very challenging one
for the food service industry as well as
for our company.
I am proud to tell you that our company
was still able to finish 2018 on a positive
note and continued to deliver industry-
leading growth that was the envy of
others. The year proved that when the
going gets tough, the tough (Team
Shakey’s) get going!
41Investor Relations Highlights
Investor Conferences Earnings Release
1Q20 Earnings Release
Citi Pan Asia Regional Conference
June 1
May 20 (Virtual)
Annual Stockholders Meeting
July 15 (Virtual)
Nomura Investment Forum Asia
June 2 (Virtual)
2Q20 Earnings Release
August 12
3Q20 Earnings Release
November 11
*Schedule updated as of 14 May 2020 42SUSTAINABILITY
HIGLIGHTSFirst GRI-Compliant
Sustainability Report
Sustainability Framework
Available for download here:
https://tinyurl.com/PIZZA-Annual-Report-2018
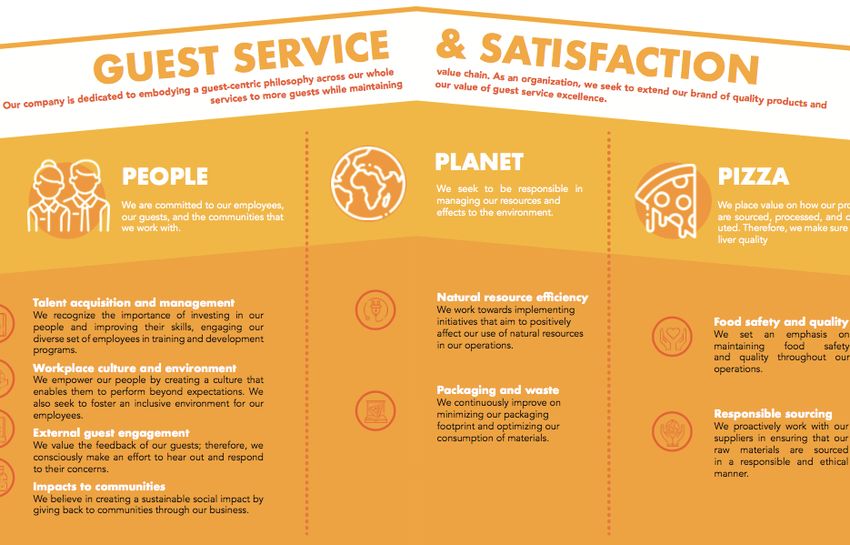
PLANET
PEOPLE PIZZA
• Talent acquisition • Natural resource • Food safety &
& management efficiency quality
• Workplace culture • Packaging & waste • Responsible
& environment sourcing
• External guest • Long-term financial goals now coupled with
engagement ENTERPRISE-WIDE INITIATIVE TO MONITOR
• Impact to AND MEASURE ENVIRONMENTAL, SOCIAL, AND
communities GOVERNANCE METRICS
44First GRI-Compliant
Sustainability Report
2018 Sustainability Highlights
PLANET
PEOPLE PIZZA
43.6 9,149 4% 74%
average jobs reduction in of total spending is
training supported electricity intensity on local suppliers
hours per
1:1 100%
employee
ratio 1% RSPO-certified
8.3/10 between reduction in palm oil
satisfaction male and water intensity Supplier accreditation
of store female
process in place
employees employees 45This document is highly confidential and being given solely for your information and for your use and may not
be, or any portion thereof, shared, copied, reproduced or redistributed to any other person in any manner.
The statements contained in this document speak only as of the date which they are made, and the Company
expressly disclaims any obligation or undertaking to supplement, amend or disseminate any updates or
revisions to any statements contained herein to reflect any change in events, conditions or circumstances
on which any such statements are based. By preparing this presentation, none of the Company, its
management, and their respective advisers undertakes any obligation to provide the recipient with
access to any additional information or to update this presentation or to correct any inaccuracies
in any such information which may become apparent.
This presentation contains statements, including forward-looking statements, based on the
currently held beliefs and assumptions of the management of the Company, which are
expressed in good faith and, in their opinion, reasonable. Forward-looking statements
in particular involve known and unknown risks, uncertainties and other factors, which
may cause the actual results, financial condition, performance, or achievements of the
Company or industry results, to differ materially from the results, financial condition,
performance or achievements expressed or implied by such forward-looking
statements. Given these risks, uncertainties and other factors, recipients of this
document are cautioned not to place undue reliance on these forward-looking
statements.
Any reference herein to "the Company" shall mean, collectively,
Shakey’s Pizza Asia Ventures, Inc. and its subsidiaries.
Paranaque City, Philippines
SHAKEY’S PIZZA investorrelations@shakeys.biz
ASIA VENTURES, INC. +632 8742 5397
www.shakeyspizza.ph
http://edge.pse.com.phYou can also read