Results FY2018 February 28, 2019 - Bolsa de Madrid
←
→
Page content transcription
If your browser does not render page correctly, please read the page content below
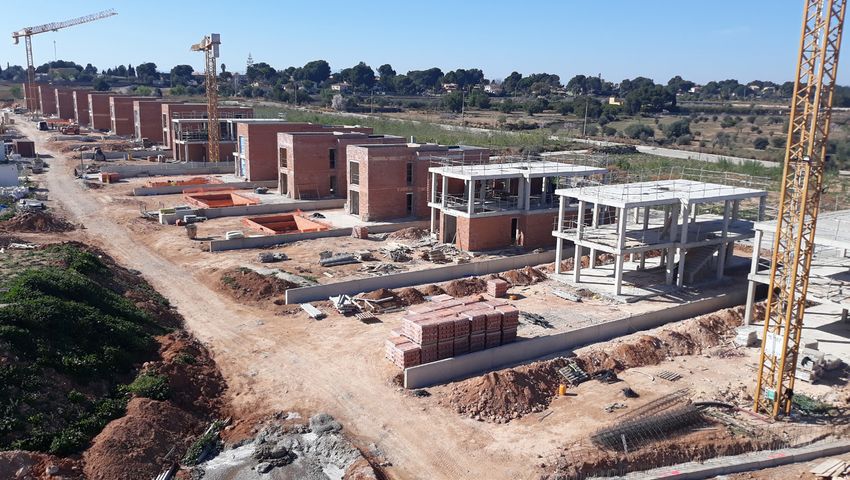
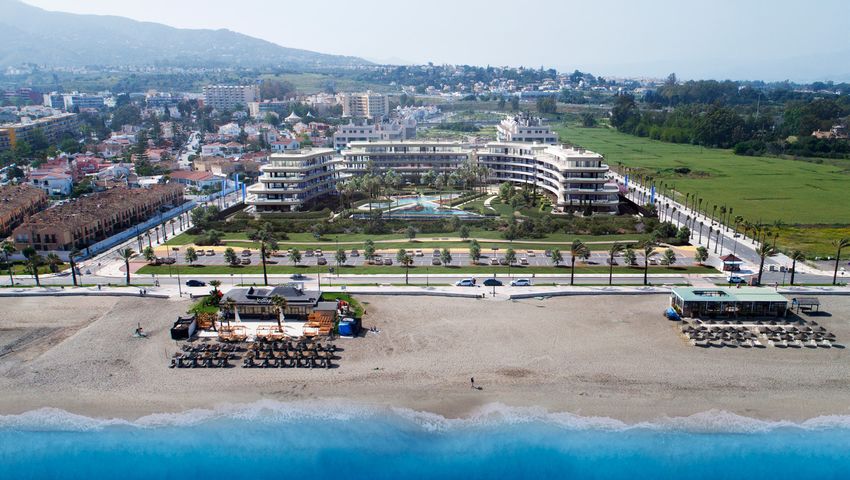
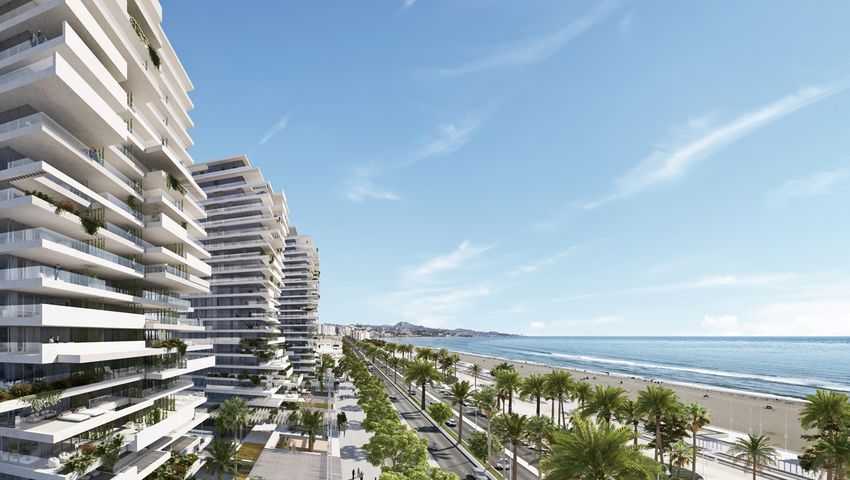
Torre del Río (Málaga)

Results
FY2018
   February 28, 2019
Disclaimer
This Presentation neither constitutes nor forms part of any offer for sale or invitation to purchase or subscribe for, or request for an offer of purchase or subscription, of the shares belonging to Metrovacesa, SA (“Metrovacesa”). This Presentation, as well
as the information included therein, neither constitutes nor forms part of (i) any contract or commitment of purchase or subscription of shares in accordance with the Securities Market Law, or (ii) an offer of purchase, sale or exchange of shares, or a
solicitation of any type of voting rights in the jurisdiction of Spain, UK, USA or any other. “Presentation” refers to this document and any part or content of this document; any oral presentation, brainstorming session and written or audio material processed
or distributed during the meeting related to the Presentation or in any way associated with the Presentation. The Presentation and the information contained in the Presentation may not be reproduced, used, distributed or published, in whole or in part,
in any case, except with regard to the information extracted from the Presentation and used for the preparation of analysts’ reports in accordance with the applicable regulations. The breach of this obligation may result in a violation of the legislation
applying to the securities market and this may lead to civil, administrative or criminal liability. In addition to information related to historical facts, this Presentation may contain forward-looking statements relative to Metrovacesa’s sales and results and to
other issues such as industry, business strategy, goals and expectations concerning its market position, future operations, margins, profitability, capital investment, own resources and other operational and financial information. Forward-looking statements
include statements concerning plans, objectives, goals, strategies, future events or performance, and underlying assumptions and other statements that are not about historical facts. The terms “foresee”, “expect”, “anticipate”, “estimate”, “consider”, “may”
and other similar expressions may identify forward-looking statements. Other forward-looking statements can be identified based on their context. Forward-looking statements are based on numerous hypotheses and assumptions relating to Metrovacesa’s
present and future business strategy, as well as the environment in which Metrovacesa expects to operate in the future. Forward-looking statements include and involve known and unknown risks, uncertainties and other material factors that may affect
the actual results and performance of Metrovacesa or the industry. Therefore, the result and the actual performance may differ materially from those expressed or implied in these statements. None of the forward-looking statements, expectations, or
perspectives included in this Presentation should be construed as a prediction or a promise. Neither should it be understood that the forward-looking statements involve any demonstration, promise or warranty whatsoever of the accuracy or completeness
of the assumptions or hypotheses which such forward-looking statements, expectations, estimates or forecasts are based on, or, in the case of the assumptions, their full inclusion in the Presentation. Numerous factors may cause Metrovacesa’s results
or actual performance to be materially different from any future results or performance expressly or implicitly included in any of the aforementioned forward-looking statements. In the event that one or several of the aforementioned risks or uncertainties
were to materialise, or in the event that the assumptions prove incorrect, actual results may be materially different from those described, anticipated, expected or projected in the Presentation. Therefore, the recipient of this presentation should not unduly
rely on these forward-looking statements and their ability to predict future outcomes. Present and future analysts, securities brokers and investors must operate based on their own judgement as to the suitability and adequacy of the securities in terms
of the achievement of their particular goals, having taken into consideration what is specified in this notice and the public information available and having received all the professional advice, or of any other type, deemed necessary or merely convenient
in these circumstances, without having relied solely on the information contained in the Presentation. The dissemination of this Presentation does not constitute advice or recommendation by Metrovacesa to buy, sell or trade with Metrovacesa shares,
or with any other security. Analysts, securities brokers and investors should take into account that the estimates, projections and forecasts do not guarantee the performance, result, prices, margins, exchange rates and other facts relating to Metrovacesa,
which are subject to risks, uncertainties or other variables that are not within Metrovacesa’s control, in such a way that the future results and the actual performance could be materially different to that anticipated, projected and estimated. The information
contained in this Presentation which is not intended to be all-inclusive, has not been verified by an independent third party and shall not be updated. The information of the Presentation, including the forward-looking statements, refers to the date of this
document and does not imply any guarantee for future results. Metrovacesa expressly disclaims any obligation or undertaking to disseminate any updates or revisions of the information, including financial data and forward-looking statements. In this
regard, Metrovacesa shall not publicly distribute any revision that may affect the information contained in the Presentation that is derived from changes in expectations, facts, conditions or circumstances on which is based the forward-looking statements,
or any other change that occurred on the date of the Presentation or after this date. The data relating to the industry, the market and the competitive position of Metrovacesa contained in this Presentation that are not attributable to a specific source have
been extracted from the analyses or estimates made by Metrovacesa and have not been independently verified. In addition, the Presentation may include information related to other companies operating in the same sector and industry. This information
comes from public sources and Metrovacesa provides no express or implied representation or warranty, nor assumes any responsibility for the accuracy, completeness or verification of the aforementioned data. Certain statistical and financial information
contained in the Presentation are subject to rounding adjustment. Therefore, any discrepancy between the total and the sum of the amounts reflected is due to this rounding off. Some of the indicators of financial and operational management included
in this Presentation have not been subjected to a financial audit or verification by an independent third party. In addition, certain figures of the Presentation, which have not been subject to financial audit either, are pro forma figures. Metrovacesa and its
employees, executives, directors, advisors, representatives, agents or affiliates assume no liability (for fault or negligence, direct or indirect, tort or contract) for damages that may arise from the use of this Presentation or its content or that, in any case,
are related to this Presentation. The information contained in this Presentation does not constitute legal, accounting, regulatory, tax, financial or any other type of advice. The aforementioned information has not been prepared taking into consideration
the needs or particular situations nor the investment, legal, accounting, regulatory, tax, or financial goals of the recipients of the information. Solely recipients shall be responsible for forming their own judgment and reaching their own opinions and
conclusions with respect to these matters and the market, as well as for making an independent assessment of the information. Solely recipients shall be responsible for seeking independent professional advice in connection with the information contained
in the Presentation and any action taken based on such information. No one takes responsibility for the information or for any actions taken by any recipient or any of its directors, executives, employees, agents or associates on the basis of the
aforementioned information. Neither this presentation nor any part thereof are contractual in nature, and may not be used to form part of or constitute any kind of agreement. Upon receipt of or attendance to the Presentation, the recipient declares its
conformity and, therefore, to be subject to the restrictions specified in the preceding paragraphs

                                                                                                                                                                                                                                                  2.
Agenda
Table of Contents

1.     Highlights of the year
2.     Financial Overview
3.     Business Update
4.     Outlook and Positioning
5.     Appendix

Today’s Presenters

                     Jorge Perez de Leza CEO   Borja Tejada CFO   Juan Carlos Calvo IR

                                                                                         3.
Residencial Nereidas (Torremolinos, Málaga)

1. Highlights of the year
Key figures for FY 2018
                                                                                2018

  520 units
      delivered   €201m (7x
                        Revenues
                            prev year)      -2% ratio
                                                LTV
                                                                    +6.2% LFL
                                                                          GAV residential

3,944 units
      launched    €0.4m Pre-tax
                        profit           €-41m Net debt
                                               (cash)           €18.43/sh NAV
                                                                          (+3% yoy)

€64m land sales
     with 16%        26% Gross
                         developer       €46m Net CF
                                              generation
        uplift           margin                   + disposals

                                                                                 5.
2018 targets accomplished
                  Target 2018                         Actual 2018                            Additional information

                      · Deliveries: 520 units           · 520 units delivered                … 336 units in 4Q18
                      · Launches: 3,500-4,000 units     · 3,944 units launched               … On track to meet
   Residential                                                                                  our BP targets

                                                        · JV signed with Tishman Speyer     … Gain of +12%
                                                           (57,000 sqm)
                      Launch 36,000 sqm                 · First turnkey project delivered     and +17% vs IPO appraisals
  Commertial
                                                           to Colonial (9,000 sqm)

                       > €30m land sales                €64m land sales                      …+16% uplift
                                                                                               vs IPO appraisals
   Land sales

                      Fully-permitted land c.80%        79% at Dec 2018                      …On track to reach
                                                                                               93% FP by 2021
Land Management

                                                                                                                      6.
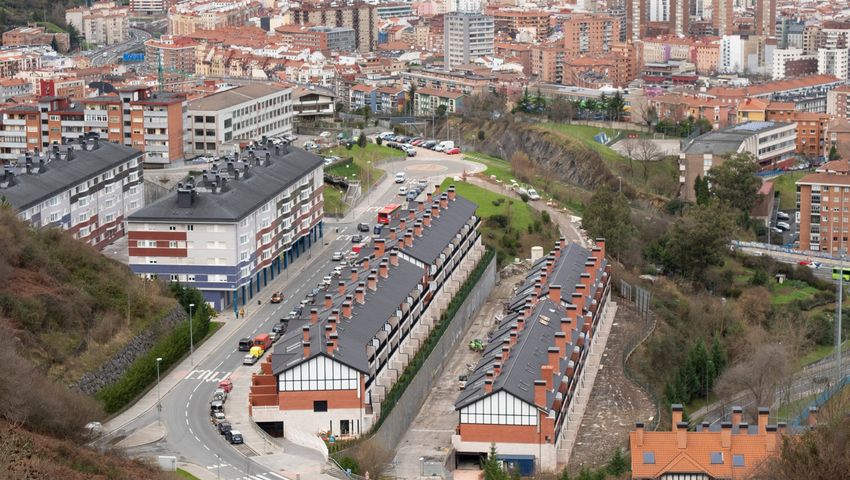
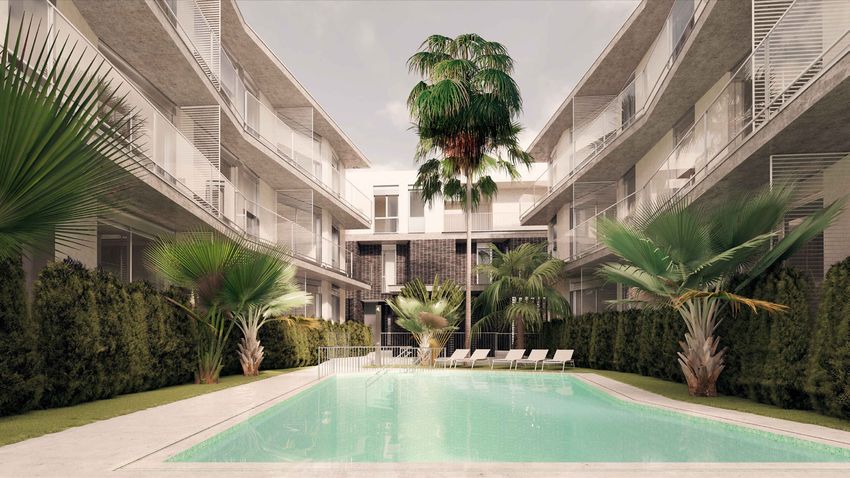
Gaztelondo Berria (Bilbao)

2. Financial Overview
Profit and Loss Account
Summary P&L (1)

     (€m)                                   Dec. 17   Dec. 18
                                                                   Key considerations
 A   Revenues                                 28.2     200.9
     Rev. Development - Res.                  23.8     109.5       A • Residential revenues of €110m (520 units delivered - €218k/unit)
     Rev. Development - Tert.                  0.0      27.9            • Commercial development revenues of €28m
     Rev. Land Sold                            0.0      63.5
                                                                        • Land sales of €64m, of which €50m from inventories and €14m from
     Other                                     4.4       0.0
 A   COGS                                    (21.5)   (165.7)
                                                                           investment properties (2)
     COGs Development - Res.                 (19.0)    (81.3)
                                                                   B • 18% gross margin breakdown
     COGs Development - Tert.                 (0.0)    (24.6)
     COGs Land Sold + Tert                    (0.0)    (58.7)
                                                                          · 26% residential development vs 20% in 2017
     Others                                   (2.5)     (1.4)             · 17% commercial development (3)
 B   Gross Profit                              6.7      35.2              · 8% land sales
     % Gross Margin                           25%       18%
     Commercial Cost                          (1.8)     (6.8)      C • External services: services from third parties and one-off expenses of
     Municipal taxes                          (0.0)     (0.6)             €4.5m related to IPO
 C   Wages & salaries                         (6.4)    (13.4)
 C   Overheads                                (7.1)     (9.0)      D • Net financial expenses mostly linked to the corporate financing
     (Impairment)/revaluation                (64.5)     (0.0)
     EBITDA                                  (73.1)      5.4       E • Income tax: Advanced tax related to the reversal of impairment
     % EBITDA margin                           n.a.      3%               provisions, as per art.11.6 of the Corporate Tax Law. This is a temporarily
 D   Net financial results                    (5.2)     (4.9)             effect already explained in the IPO prospectus
     Others                                    0.3       0.0
     EBT                                     (78.0)      0.4       F • Adjusted net income of €5.0m excluding one-off IPO expenses and taxes
 E   Income Tax                               39.2      (9.5)
     Net Income                              (38.8)     (9.1)
                                                                             Positive Ebitda (€ 5.4m) and Pre-tax profit (€ 0.4m) in 2018
 F   Adjustment one-off expenses               3.7      4.5     Notes
                                                                (1) Audited financial statements for Dec2017 and Dec2018
     Net Income pre-IPO Costs                (35.1)    (4.6)
                                                                (2) According to accounting principles, sales of investment properties are recognized by difference between sales price
     Net Income Pre - IPO Costs - Pre-Tax    (74.3)     5.0     and book value
                                                                (3) 12% gross margin including rental guarantee

                                                                                                                                                                   8.
Cash Flow Statement
Summary Cash Flow Statement

(€m)                                                       Dec. 2017   Dec. 2018
                                                                                      Key considerations
 EBT                                                        (78.1)        0.4
 Changes in trade provisions                                 65.8         1.6         • €96.7m of cash increase during the period
 Changes in investment properties                            (1.4)       (9.7)        • Positive cash flow from operating activities of €34.5m thanks to a
 Financial cost / (income)                                     -          6.6             decrease in working capital amounting to €48.6m
 Other incomes / (expenses)                                    -          1.5         • €50.7m of financing cash inflow as a result of an increase in corporate
 Operating cash flow                                        (13.7)        0.5             credit and project withdrawals
 Changes in working capital                                 (12.9)       48.6         • €46m adjusted cash flow from operating activities (including CF from
    Inventories                                             (22.1)       41.7             assets disposals)
    Trades and other receivable                              (7.0)       (5.1)
    Trades and other payable                                 16.2        11.9
 Other operating cash flows                                    -        (14.6)        Cash Flow Bridge
 Net cash flow from operating activities                    (26.6)       34.5
                                                                                      €m
 Net cash flow from investing activities                     (2.7)       11.4
                                                                                                                                                                          51         147
 Net cash flow from financing activities                     47.2        50.7                              Adj. CF from operating activities= €46m
 Net cash increase / (decrease)                              17.9        96.7
                                                                                                              42                     12                      11
 Cash BoP                                                    32.4        50.3
 Cash EoP                                                    50.3        147.0                                            (5)                   (15)
                                                                                       50          1
 o/w. restricted cash                                        12.0        26.5
 o/w unrestricted cash                                       38.3        120.5
                                                                                     Cash      Operating    Chg in     Chg in      Change in     Other     Investing   Financing     Cash
                                                                                   Dec. 2017     CF        Inventory Receivables   Payables    operating      CF          CF       Dec. 2018
Note                                                                                                                                              CF
(1) Audited financial statements for Dec2017 and Dec2018

                                                                                                                                                                            9.
Cash Flow statement by activity
 Project cash flow by source of revenues                                                                                      Cash flow analysis by activity

                                     Residential         Commercial                                                                                                                                                               (€m)
 (€m)                                                                          Land sales             TOTAL
                                     deliveries (1)      deliveries (1)                                                        Total CF from projects                                                                              141
  Revenues                                110                  28                   64                  201                    Overheads (cash) (2)                                                                                (25)
  CF from projects                         66                  18                   57                  141                    Financial expenses (cash)                                                                           (11)
  As % of sales                          60%                  65%                  90%                  70%                    Others                                                                                               10
                                                                                                                               CF from current operations (A)                                                                      115
                                                                                                                               Capex in WIP developments                                                                           (58)
                                                               Financed with:
                                                                                                                               Advances from clients                                                                                27
                                                               • €39m increase in gross debt:                                CF from WIP developments   (B)                                                                      (31)
                                                                 developer loans and corporate debt
                                                               • Rest: from cash flow operations                             Capex in land transformation                                                                        (38)
                                                                                                                               CF from land transformation (C)                                                                     (38)

                                                                                                                               Adj CF from Operating Activities (A+B+C)                                                             46

                                                                          Positive CF generation from operating activities

Notes
(1) Project cash flow calculated as a difference between the revenues and the cash cost of sales, excluding general expenses. Some of the 2018 Residential and Commercial deliveries are related to assets contributed to Metrovacesa in 2017
already under construction, which means that the cash costs incurred by the Company for their completion was lower than normalised. Potential normalized % over sales are estimated at c.40% for residential developments, c.51% for commercial
developments and c.97% for land sales
(2) Includes overheads, commercial cost, municipal taxes, wages and salaries

                                                                                                                                                                                                                                 10.
Balance Sheet
Summary Balance Sheet (1)
Key considerations
(€m) Dec. 2017 Dec. 2018
A Investment property (2) 370.6 340.1 A • Book value (inventory + investment property): €2.2bn
Other non- current assets 177.3 236.8 • External appraisal value of €2.7bn implies a GAV to BV ratio of 1.2x
Total non-current assets 547.9 576.9
A Inventory 1,906.0 1,840.7
B Cash 50.3 147.0 B • Unrestricted cash of €120.5m
Public administration 10.8 2.4
Other current assets 32.0 26.8
Total current assets 1,999.1 2,016.8
Total Assets 2,547.0 2,593.8 C • Corporate financing debt: net withdrawal of €78m, after repayment of
€16.5m in 2018
Provisions 16.6 10.1
C Bank debt 0,1 68.1
Other non-current liabilities 11,8 15.2
• Developer loans: €101m available but prioritizing the use of client´s
advanced payments
Total non-current liabilities 28.6 93.4
Provisions 13.5 13.8
C Bank debt 47.5 13.0
Other current liabilities 60.0 80.5
Total current liabilities 121.0 107.3
Equity 2,397.4 2,393.1
TOTAL EQUITY + LIABILITIES 2,547.0 2,593.8
Notes
(1) Audited financial statements for Dec2017 and Dec2018
(2) Booked at fair market value (IFRS)
11.Net Debt: €-41.1m at Dec 2018 (net cash)
Net debt position (1)
Key considerations
(€m) Dec. 2017 Dec. 2018
Adjusted gross debt 47.5 86.5 • Net debt of -€41.1m (net cash) at Dec2018
Corporate financing 44.5 78.1 · LTV -2%
Non current 0.0 73.5 · Following strong cashflow generation, particularly in 4Q2018
Current 44.5 4.6
Developer loans 3.0 8.4 • Maintain financial policy
Non current - - · Target LTV < 25%
Current 3.0 8.4 · Use mainly project financing for construction projects and corporate
Available cash (2) 39.4 127.6 financing mainly for general expenses, capex, land urbanization etc.
Other liquid assets (3) 1.1 7.1
Unrestricted cash (2) 38.3 120.5 • Financing already in place to fund the company’s growth
Net Debt 10.3 (41.1) · €101m project loans signed, o/w only €8m drawn
· €500m+ additional developer loans pre-arranged
·C orporate financing: €185m still undrawn to finance Opex, Capex, land
Net debt evolution urbanization, taxes and developments costs.
10.3 9.7
The business plan is fully-funded
Dec. 2017 Jun. 2018
(41.1)
Notes Dec. 2018
(1) Audited financial statements for Dec2017 and Dec2018
(2) Cash figures exclude downpayments from customers
(3) Short term liquid investment
12.GAV evolution: +6.2% LFL residential growth YoY
GAV evolution (1)
123
2,626 2,672
(77)
LFL+4.7%
Residential: +6.2%
GAV Dec. 17 LFL change Portfolio changes GAV Dec. 18
(Capex - Sales)
Valuation details (2)
Levante
€/sqm % LFL 2018 14% Center-North Commercial
36% 24%
Residential fully-permitted 506 +7.0%
Tier1 FP 703 +11.0%
Tier2 FP 476 +4.0% Catalonia GAV GAV
21%
Tier3 FP 362 +6.3% by location by use
Residential non-fully permitted 289 +3.9%
Residential
Total Residential Portfolio 423 +6.2% use 76%
Commercial use 510 0.5% West Andalusia East Andalusia
14% 15%
TOTAL MVC PORTFOLIO 441 +4.7%
€2.672m GAV as of Dec 2018: +4.7% LFL vs. Dec 2017
Notes
(1) Valuation carried out by Savills Aguirre Newman and CBRE as of December 2018 and December 2017, according to RICS Valuation Global Standards regulations (“Red Book”), based on fair value and not adjusted by the equity accounted method
(2) Internal classification of municipalities by Tiers based on several economic, demographic and market metrics: Tier 1 includes: Madrid, Barcelona, Málaga, Navarra, Vizcaya, Girona and Tenerife; Tier 2 includes: Valencia, Alicante, Sevilla, Cádiz,
Baleares, Las Palmas, Zaragoza, Valladolid, A Coruña and Tarragona; Tier 3 includes: Huelva, Murcia, Castellón, Lleida and Pontevedra
13.NAV & NNAV
Equity to NNAV Bridge (€m) GAV to NNAV Bridge (€m)
394 8 2.795 2.688 2.795
2.672 51 34 38 2.688
2.393
(107)
(107)
Equity (1) Capital Other NAV Tax on capital NNAV GAV Tax credits (2) Net Debt Other assets NAV Tax capital NNAV
gains adjustments gains and other Dec.18 & liabilities gains Dec.18
adjustments
NAV and NNAV evolution
Dec.17 Dec.18 % change Dec2018 NAV: € 18.43/share (+2.8% YoY)
NAV €/sh 17.93 18.43 3%
NNAV €/sh 17.38 17.73 2%
Notes
(1) Reported in the consolidated financial statements
(2) Tax loss carry forwards
14.Proposed distribution to shareholders
Key considerations
• Proposed payment of €50m to shareholders
· The Board of Directors has proposed the distribution of €50m against
paid-in reserves, to be voted at the next AGM
· Estimated to be paid in 2Q2019
· Implies a dividend yield of c.3% at current market prices
• Earlier than initial plans
· IPO plan was to initiate dividends in 2020
€ 50m
·F CF generation was positive in 2018 (adj. CF €46m), earlier than in
our business plan due to higher land sales
·N et debt at Dec2018 is €-41.1m (net cash)
·R eflects commitment to distribute free cashflow generation to our
Dividend to be paid shareholders
in 2Q 2019 • Visibility on future dividend distribution
· Policy to distribute >80% of FCF generation
Reaffirmed commitment to distribute cash flow generation to shareholders
15.Complejo Pier 1 (Rota, Cádiz) 3. Business Update
Key operational data as of December 31, 2018
                                                              5,565 active units                            €310k/unit           3,840 units and                     Sales Backlog (2)
     Business                                                   102 active
                                                                    developments
                                                                                                            ASP (1)                 72 developments under
                                                                                                                                       commercialization
                                                                                                                                                                     909        €271m
                                                                                                                                                                     Sold units €298k/unit ASP (1)

                                                               1,329                                        32
                                                               units under                                  developments
                                                               construction                                 under construction

                                                              520                                           €218k/unit                               Commercial business
                                                              units                                         ASP (1)                                  Turnkey projects Josefa Valcárcel delivered
                                                              delivered                                                                              Land Sales: €64m

                                                              6.1 million sqm                               c.38,000                    79%    (4)

                                                              buildable                                     buildable                   Fully
                                                              area                                          units (3)                   permitted

                                                               €2.7Bn                                       €2.8Bn                      - 2%
     Financial                                                 GAV                                          NAV                         LTV

Notes
(1) Average Selling Price, not including future HPA
(2) Defined as bookings + contracts – deliveries in the period
(3) Estimated number of units may vary in time depending on the type of projects and maximum buildability
(4) In terms of GAV as of December 31, 2018

                                                                                                                                                                                         17.
Residential active units: 2018 target accomplished
Active units 2018 # units €m Key considerations
612 266 472 126 348 (9) (17) (17) (67) 1,714
989 • Total active units reached 5,565, with an ASP
5,565
1,662 438 of €310k/unit
(36) (75) (73)
(386)
855 • 102 active developments, of which 72
2,141
under commercialization (including 32 under
Total launches 2018: 3,944 Total deliveries 2018: 520 construction)
Active units Q1 2018 Q2 2018 Q3 2018 Q4 2018 Q1 2018 Q2 2018 Q3 2018 Q4 2018 Active units
Dec. 2017 Dec. 2018 • 3,944 units launched during 2018
·2
018 launches in line with the year target
2018 Active Units by Status
Construction ·1
6 new developments equivalent to 989 units
Commercialization 2018 Active Units – Geographical Split (1)
Design phase launched in Q4
# units of developments
· Geographically, Levante accounted for the
62 86 92 102 Levante Total
5,565
6%
5,565 units
majority of launches in Q4 (43%), followed by
4,912 102 developments East Andalusia (32%)
4,547 Center-North
1,329 30% · As for the full year, East Andalusia accounted
1,157
1,200 East Andalusia for 27% of launches, followed by Catalonia
2,960 33%
(25%)
1,136 1,850
1,042 3,511
393 Note
Catalonia
1,525 2,254 1,862 1,725 22% West Andalusia (1) Center-North: Madrid, Navarre, Galicia, Basque Country, Canary Islands
14% and Castilla-Leon; Levante: Valencian Community, Murcia and Ibiza; Catalonia:
Catalonia and Mallorca; West Andalusia: Cordoba, Seville, Huelva, Cadiz; East
Q1 2018 Q2 2018 Q3 2018 Q4 2018
Andalusia: Costa del Sol and Almeria
18.Residential: c.900 units sold in 2018
888 units sold in 2018, strong Q4 3,840 units under commercialization as of December 31, 24% already sold For sale
Sold
# units # units % sales over units under commercialization
+70% Q4: 405
44% 42% 29% 27% 24%
156 1,222 1,422 2,314 3,137 3,840
+52% Q3: 238 141
+22%
+78%
Q2: 157 102 108 2,931
Q1: 88
80
67 65 2.297
56 1.639
36 681 829
26 26 26 +8%
541 593 675 840 909
Q4 2017 Q1 2018 H1 2018 9M 2018 Q4 2018
Jan.18 Feb.18 Mar.18 Apr.18 May.18 Jun.18 Jul.18 Aug.18 Sep.18 Oct.18 Nov.18 Dec.18
Sales backlog of 909 units FY 2018 Sales backlog - Geographical split
# units €m Levante 6%
135 23 46 60 115 (109) 271 Catalonia
12%
405 909
238
157 East Andalusia
541 88 (520) 48%
Center-North
28%
Sales backlog Sales Sales Sales Sales Deliveries Sales backlog
Dec. 17 Q1 2018 Q2 2018 Q3 2018 Q4 2018 2018 Dec. 18 West Andalusia 7%
19.Residential: Detail of deliveries in 2018
Development Province Municipality Delivery units
Mirador San Blas Alicante Alicante 23
Birdie & Falcon Almería Pulpí 62
Gregorio Marañon Almería Almería 104
Locales Sotorebolo Cádiz Algeciras 1
Reserva Sotorebolo Cádiz Algeciras 8
Puerta del Mediterráneo Castellón Oropesa del Mar 4
Rosales Residencial (Madrid)
Residencial San Cosme Madrid Valdemoro 42
Rosales Residencial Madrid Madrid 130
Terrazas III Málaga Marbella 10
Villas Bahia Rocas Málaga Manilva 12
Lago de Arrosadía Pamplona Pamplona 41
Vedat Cuatro Valencia Vedat del Torrent 1
Vedat Seis Valencia Vedat del Torrent 8
Residencial San Cosme (Madrid) Vedat Siete Valencia Vedat del Torrent 16
Vedat Ocho Valencia Vedat del Torrent 9
Hacienda cuatro Valladolid Aldeamayor 15
Hacienda Cinco Valladolid Aldeamayor 9
Hacienda Seis Valladolid Aldeamayor 5
Cándida Peña Tenerife Arona 9
Gaztelondo Berría Vizcaya Bilbao 13
TOTAL 520
Villas Bahia Rocas (Málaga)
Note
(1) ASP: Average Selling Price
Target deliveries reached with an ASP (1) of €218k per unit
20.Residential: Planned deliveries for 2019
Target License Under
Development Province Municipality % sold
deliveries 2019 obtained construction
Birdie & Falcon Almería Pulpí 79 9% Completed
Gregorio Marañon Almería Almería 9 0% Completed
Gaztelondo Berría F1 Vizcaya Bilbao 9 22% Completed
Mirador de Guadarrama Madrid Collado Villalba 64 84% Completed
Puerta del Mediterráneo Castellón Oropesa del Mar 12 25% Completed
Birdie & Falcon (Pulpí, Almería)
Le Mirage I & II Málaga Estepona 72 100% Completed
Gaztelondo Berría F2 Vizcaya Bilbao 21 14% Completed
Other 7 100% Completed
Momentum Barcelona Montornés 78 21%
Villas de Miramadrid Madrid Paracuellos del Jarama 46 98%
Majestic Heights Málaga Manilva 24 54%
Sunrise Heights Málaga Manilva 23 61%
Le Mirage III Málaga Estepona 66 95%
Gaztelondo Berria (Bilbao) Le Mirage IV Málaga Estepona 29 83%
Serenity Views Málaga Estepona 66 48%
Residencial Oasis Cádiz Algeciras 32 19%
Villas de la Calderona Valencia Bétera 19 84%
Res. Vivaldi Valencia Sagunto 21 86%
Mirador del Jalón Valladolid Valladolid 18 83%
Hacienda Cinco Valladolid Aldeamayor 5 40%
TOTAL 700 59% 100%
Le Mirage III (Estepona, Málaga)
Notes
Data as of February 26, 2019 2019 deliveries are 59% pre-sold, with a 57% construction WIP (1)
(1) Calculated as a weighted average of the total target deliveries
21.Residential: Status of deliveries 2019-2021 (1)
Year of delivery Target deliveries Launched ASP Forecast Gross Margin- % Units sold Construction licence % Under Deliveries
(units) (€ ‘000) (1) Forecast (1) construction
Requested Granted
2019 700 100% 242 23% (2) 59% 100% 100% 100% 0%
2020 c 2.600 100% 295 +24% 20% 100% 70% 44% 0%
2021 c 4.000 44% 310 +26% 1% 24% 3% 0% 0%
Notes
Data as of February 26, 2019
(1) Estimates of average selling price (ASP) and Gross Margin assuming a 3.4% annual HPA (as disclosed in IPO Business Plan) for 2020 and 2021 deliveries, as well as a CCI of 4% for 2021 deliveries. Each percentage increase of 1% in HPA translates
into an increase in gross margins of approximately 1.5%. Gross Margin includes capitalized financial expenses
(2) Adjusted gross margin, without considering the cumulative effect of the reversal of provisions for project impairment. Lower margins due to projects launched pre-IPO following cash flow criteria, as reported during IPO process
22.Land Sales: 2018 target surpassed
Development Province Use Buildable sqm Revenues (€m) Gross Margin(1) Gross Margin(1) Uplift on Date
(€m) (%) GAV IPO
Almogavers Barcelona Office 17,346 22.0 1.0 4% 6% Q2 18
Balius Barcelona Office 9,573 14.0 0.8 6% 13% Q4 18
C/ Marconi, 126 Barcelona Residential 8,087 4.4 1.4 31% 31% Q4 18
Parcela PP-03- S. Isabel Córdoba Residential 214 0.1 0.0 8% 8% Q2 18
Parcela PP-05 Turruñuelos Córdoba Residential 3.570 1.9 0.4 23% 23% Q4 18
Parcela 3.3 Torija Guadalajara Logistics 20,342 1.4 0.2 13% 13% Q4 18
Valdebebas Madrid Retail 3,000 5.4 1.1 21% 21% Q4 18
Sector Levante (2)
Mallorca Hotel 18,500 14.0 (0.1) (1%) 26% Q2 18
Soto de Lezkairu L45.6 Navarra Residential 658 0.4 0.1 17% 17% Q4 18
TOTAL 81,291 63.5 4.9 8% 16%
Target 2018 > €30m Actual sales €63.5m
Uplift of 16% over GAV IPO
89% commercial land, 11% residential land assets
Notes
(1) Gross Margin includes sales costs but not commercialization expenses
(2) Classified as an investment property in the balance sheet, therefore accounted for its fair market value, which explains a gross margin close to 0
23.Land Management FY 18: €117m of land transformed to fully permitted
Organized Fully permitted (1) Fully permitted GAV
Land plot Region Municipality Buildable sqm
Sept. 17
1. Balius Catalonia Barcelona 9,477
74%
2. Can Fábregas Catalonia Mollet del Vallés, Barcelona 11,948
3. Pere IV Catalonia Barcelona 32,819
4. Sector Llevant Catalonia Viladecans, Barcelona 9,040 +5 pp
5. Av. De Madrid Center-North Zaragoza 5,610
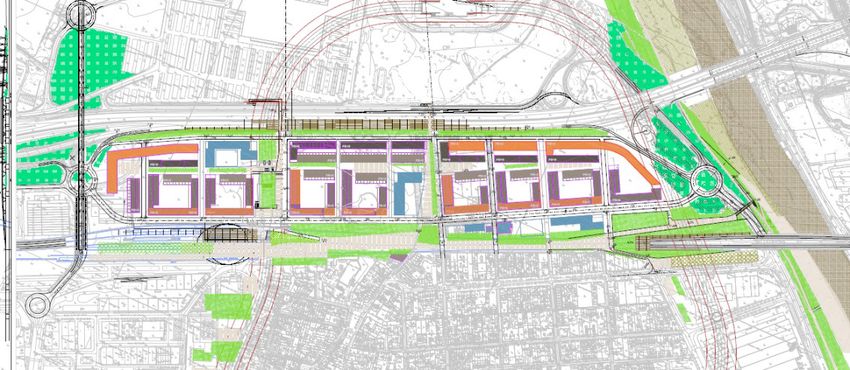
6. Torre del Río Costa del Sol Málaga 44,592
7. Moli d´Animeta Levante Quart de Poblet, Valencia 20,288 Dec. 18
8. Villas de Bes Levante Ibiza, Islas Baleares 945
79%
TOTAL 134,719
8 plots transformed to fully permitted during 2018, representing a GAV of €117m
Note
(1) Fully permitted defined as land with both urbanization and rezoning plans appoved
24.Commercial: Turnkey Projects and JVs
• 5 assets sold for a total of €57m, implying a 16% revaluation vs. GAV IPO
Land Sales • Locations: Madrid, Barcelona, Mallorca and Guadalajara
Josefa Valcárcel
Turnkey A2 Hotel Silken
•9
,081 sqm office building in Madrid
deliveries delivered to Colonial in Sept. 18
Puerta de
América
• Sold for €30m, with a gain of 17% (1)
BBVA
• J V with Tishman Speyer signed in Q3 2018
Turnkey (56,652 sqm). Phase I under project design NH
HOTEL
Projects
• In advanced negotiations in multiple
and JVs VÍA NORTE A-1
projects for> 20,000 sqm in Madrid and BUSINESS CASER HQ
Barcelona PARK
Note
(1) Including rental guarantee
25.Villas de la Calderona (Bétera, Valencia) 4. Outlook and Positioning
Sector Outlook for 2019

                   •F
                     avourable outlook for housing demand underpinned by:
                    ·J  ob creation and higher disposable income leading to higher purchasing power
    Housing         · Demographics: growth in household formation (+120k annual average)
                    · Affordability ratios still below the historical average (1995-2017)
    demand          · Improving availability of mortgage financing in a low interest rate environment
                   • Buy vs rent: it is now more economical to buy than to rent, so turnkey developments have become a relevant customer
                     for developers

    Housing        • Housing permits growing (71k) but still coming from very depressed levels (vs 665k in 2006)
    supply         • New homes account for only 9% of total annual housing transactions

  House price      • Positive outlook though more moderate in 2019. Metrovacesa’s estimate at 5% average
                   • Heterogeneous price performance; gradually gaining traction in Tier 2 sub-markets
  appreciation
                   • Scarcity of quality land already visible, leading to higher land prices

                   • Construction cost is up due to the scarcity of specialised labor force, but the sector is starting to adapt its capacity
   Construction
                   • We do not expect cost rise to accelerate. MVC estimates +6/7% cost increase for 2019 and moderating afterwards
  cost inflation   • Gross margin is not eroded in a context of rising house prices

                   • Some delays in the sector coming from the timing of building licences granted by municipalities and the tendering process
    Delivery          with construction companies, now improving
   calendars       • Keeping an eye on local and regional elections this year in May

                                                                                                                                                 27.
Sector Outlook: relevant metrics still far from peak levels
Spanish residential metrics in 2018 as a % of peak year (2006-2019)
100% 100%
94%
79% 77%
62%
68%
46%
34%
28%
26%
15%
Real Household Employment Transactions Mortgage New mortgage Effort Housing permits Land sales Employment INE MFOM
GDP income (12M rolling) rate % lending rate (12M rolling) (12M rolling) in const.
(12M rolling) (12M rolling)
Economy Residential demand Residential supply Residential prices
Source: Metrovacesa from national statistics
Notes: INE=Instituto Nacional de Estadística, MFOM= Ministerio de Fomento
28.Buying vs Renting comparative exercise
Decision Tree - Renting vs Buying in Spain
Key considerations
2007 2010 2014 2018
• Buying is economically more attractive than
Avg house price in Eur
(100 sqm) 205,605 184,303 145,940 161,073 renting at today’s market conditions: 13% cost
saving, based on our analysis
Avg rental price in Eur/month 968 829 683 818
(100 sqm)
• This is true across all Tiers analyzed and greater
Total cost for a buyer in cities that have experienced faster rental growth
284,828 239,037 166,597 189,590
(24-yr mortgage)
Total cost for a tenant
• Sensitivity analysis: rents have to rise, or house
254,846 214,994 177,414 214,617 prices to decline, significantly to make the decision
(accum. 24-yr)
neutral
Accum. cost saving for buyer -29,982 -24,042 10,817 25,027
vs tenant (Eur)
• Nevertheless, residential for rent turnkey
Cost saving for a buyer -17% -13% +6% +13% developments have become an additional client
vs a tenant (as % of price) and we expect part of MVC´s output to target
investors / operators
Sensitivity analysis: how much would prices or rents have to change to make them
economically neutral
Madrid Valencia Huelva
(tier 1) (tier 2) (tier 3)
Rent today ( €/m2) -28% -42% -25%
House Price today (€/m2) +28% +49% +20%
Note: Metrovacesa Research calculations based on house price and rental price statistics for each year. The total cost for the buyer is calculated with the accumulated mortgage payments at historical average terms (24 years and rate of 3,6%),
transaction costs, monthly community charges and municipal taxes, and adjusted for a house price appreciation of 0.7% p.a. in real terms. The total cost for a renter is calculated over a period of 24 years, and adjusting for the opportunity cost of a
buyer’s initial downpayment.
29.Key value drivers: becoming more relevant in today´s market
A larger land bank: as a competitive advantage NFP land: active management creates value Commercial land: already crystallizing value
•N
o need to acquire land by 2023: lower • NFP land already reduced to 21% from 26% at IPO; • A vast portfolio (1.25 million sqm) with upside:
re-investment risk and better visibility on margins on track to reach 93% target by 2021 · Mostly
in Madrid/Barcelona (86%), and 94%
•C
ashflow generation: greater and earlier than peers • 68% of NFP value is located in Madrid, Barcelona, fully-permitted
Málaga and Valencia ·M ostly for office use but also suitable for alternative
•G
eographical diversification provides wider client uses
reach • Expert dedicated in-house team involved in the
whole value-creation chain • Case by case approach to unwind the portfolio
Diversified A Coruña
Asturias
Vizcaya NFP land by city (% GAV) Commercial land by final use (% GAV)
presence in
Navarra
Pontevedra Lérida
Touristic ap. Other
the most Valladolid
Gerona
5% 1%
dynamic regions Segovia Barcelona Barcelona
Hotel
Tarragona
Menorca 27%
Castellón Other 8%
Madrid
Toledo Valencia 32%
Palma de
Mallorca Retail
31
Ibiza
~ €0.6 Bn
Córdoba
Sevilla 4%
68%
~ €0.6 Bn
Granada Alicante
Huelva
provinces in Spain Murcia
Almería Industrial/
Size of bubble represents Cadiz Logistics
- size of GAV Valencia 2%
Fully permitted Lanzarote 7% Madrid Offices
Under permitting process (1) 26%
Non urban Málaga 70%
Tenerife Fuenteventura
Las Palmas de Gran Canaria
9%
It is increasingly difficult to buy quality land A key prime resource feeding new developments
Full value to crystallize in 4-5 years
with good margin prospects as well as land sales
30.Unique cashflow generation profile
Residential Dev’t (1) Commercial Dev’t (1)
Land sales
(at run-rate) (at run-rate) (residential & commercial)
Potential
returns
Gross margin
(% of sales)
~ 24-26% (2) ~ 21% (2)
Project EBITDA margin
(% of sales) ~ 20-21% (3) ~ 18% (3)
Project FCF generation
(% of sales) ~ 40% (4) ~ 51% (4) ~ 97% (5)
Forecast revenues
2019-2022 € 3.0 Bn € 0.3 Bn € 0.6 Bn
FCFE generation in 2019-2022 should exceed Metrovacesa’s current market capitalization
Notes
(1) Targeted cost structure for residential development at run-rate by 2021 excluding corporate overhead costs. When normalized by 2023 (i.e normal acquisition of land), MVC will target similar cost structure and EBITDA margins as peers; Targeted cost
structure for commercial development at run-rate by 2021 excluding corporate overhead costs
(2) Assumes cost of land of 20-23% for residential and 32%-34% for commercial projects, including cost of urbanization; and construction costs of 51%-55% of sales for residential and 44%-46% for commercial projects, including soft and hard construc-
tion costs.
(3) Includes Opex related to each development project.
(4) FCF considering the project EBITDA margin plus the cost of the land minus land urbanization costs.
(5) Sale price minus selling expenses.
31.Targets for 2019 & mid-term
Target for 2019 Mid-term targets
• Run-rate deliveries of c. 4,000 units/year
• Deliveries: 700 units
• Launches: c. 4,630 units • R
esidential land bank size of < 4 years after 2021
Residential vs. > 8 years now
• Launch of > 45,000 sqm • Accumulated sales 2019-2022 of € 0.3 bn related
to developments
Commertial
• > €100m land sales
•A
ccumulated sales 2019-2022 of € 0.6 bn (resi-
dential & commercial)
· c. €40m residential
· c. €60m commercial
•F
ully-permitted land c.93% by YE21
Land sales • Fully-permitted land c.84%
Targeting to distribute >80% FCFE generation to investors
32.Closing Remarks
· Room for growth · Gradually · Very well · Attractive
in the residential approching full positioned to shareholder
market: speed: benefit from remuneration
market dynamics: policy:
· Relevant metrics still far ·Higher visibility on ·L
and bank: no need to ·W
ell supported by
from peak levels run-rate targets buy additional land in strong cashflow
quarter after quarter the medium term generation
·V
alue creation via
land management and
commercial projects
33.Le Mirage III y VI (Estepona, Málaga) 5. Appendix
Geographical capillarity in the right locations for residential projects
 Distribution by province according to tier: 8 tier 1 (27%), 14 tier 2 (47%) and 8 tier 3 (27%)    Distribution by tier municipality (%GAV dec.18)
 # units                                                                                           Total portfolio
                                                                                                   (€ 2.672 m)
                                                                                                                          tier 3 13%

                                                                                                                                                             tier 1 53%

                                                                                                                     tier 2 34%

                                                                                                  €m                              Residential         Commercial             TOTAL
                                                                                                  Fully permitted              1,505.2     74%       597.5     94%    2,102.7      79%
                                                                                                  Organized                     157.9      8%        20.1      3%         178.0    7%
      tier 1                                                                                      Developable                   261.4      13%        9.5      1%         270.8    10%
      tier 2
                                                                                                  Non urban land                109.2      5%        11.6      2%         120.7    5%
      tier 3
                                                                                                  TOTAL MVC                    2,033.6    100%       638.6    100%    2,672.2      100%

• Municipality tier distribution results in a tier distribution by province leading to a less complex macro analysis
• In provinces with municipalities with different tiers, classification by province is weighted according to GAV

                                                                                                                                                                             35.
Xardins de Gaiteira (under project design)
Key metrics Key highlights
Location A Coruña
• Three buildings very well located in the Rua Gaiteira, next to the Corte
Region Galicia Inglés
Units 72 • 70 homes with 1,2,3 and 4 bedrooms. Parking spaces and storage rooms
Sqm for sale 8,221 • Unique services in the center of A Coruña such as: green open areas,
Construction Company n.a indoor heated pool, children’s play area and gourmet room
Construction Completion n.a • 2 commercial premises
Sales to date n.a
Target Gross Margin c.25% (1)
Notes
(1) Gross Margin includes capitalized financial expenses
36.Halia (in commercialization)
Key metrics Key highlights
Location Málaga
• Located at a very close distance from the beach, after the three future
Region East Andalusia towers that will be the emblematic project of the area
Units 99 • Excellent communications with the city center and to the A-7
Sqm for sale 12,985 • 1 to 4 bedroom multi-family homes with 2 parking spaces each and storage
Construction Company Under tender process room. All of them have a terrace
Construction Completion 0% • Swimming pool, children´s play area, green areas and a gym
Sales to date 44%
Target Gross Margin c.24% (1)
Notes
(1) Gross Margin includes capitalized financial expenses
37.Residencial Vivaldi (under construction)
Key metrics Key highlights
Location Sagunto, Valencia
• Sagunto is located close to Valencia. The complex will be just 10 min walk
Region Levante to the beach, and close to the center of the town, with many amenities,
Units 21 shops, etc
Sqm for sale 3,509 • 21 single-family attached houses, the majority with 4 bedrooms
Construction Company Torrescamara • Swimming pool and open space garden areas
Construction Completion (1) 25%
Sales to date 76%
Target Gross Margin c.21% (2)
Notes
(1) Status as of December 2018 (2) Gross Margin includes capitalized financial expenses
38.Rosales Residencial (delivered)
Key metrics Key highlights
Location Villaverde, Madrid
• Developed in an open block with a “U” shape, ground floor + 7 + attic. Has
Region Center - North a security checkpoint
Units 132 • 132 homes of 2, 3 and 4 bedrooms, with access to 2 basement floors
Sqm for sale 15,509 divided into 4 garages and 220 parking spaces
Construction Company Ortiz • Common areas, including swimming pool, children’s games, gastrobar,
Construction Completion 100% gym and car wash
Sales to date 100%
Target Gross Margin c.25% (1)
Notes
(1) Gross Margin includes capitalized financial expenses
39.NFP Land example: Arpo (Pozuelo, Madrid)
Buildable area:
45,000 sqm
Pozuelo Madrid # of units:
Arpo
256
GAV at IPO:
€25m
Urbanisation works
expected for:
2021
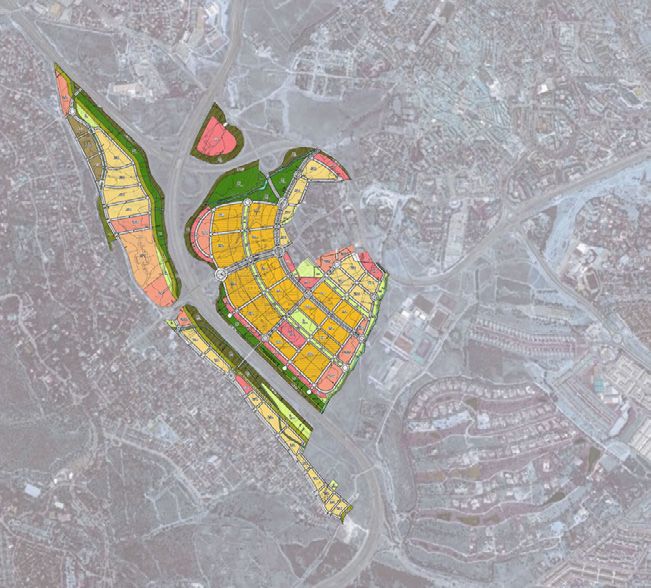
40.NFP Land case example: La Seda/Papelera (El Prat, Barcelona)
Buildable area:
176,000 sqm
Barcelona
# of units:
1,590
GAV at IPO:
rts
s
Co €50m
le
e
ad
Ví
G
ra
n
Urbanisation works
expected for:
2021
41.Land Management Q4: Continuous progress in urban management
Development Municipality Region Urban status Date Key Milestones
Admission to the application process to initiate the internal
1. Vininal Alboraya, Valencia Levante Developable December
rezoning plan
2. La Alborada Benhavís, Málaga East Andalusia Fully permitted December Start of urbanization works
Barberá del Vallés,
3. AD20 Catalonia Organized December Initial approval of the Urbanization works project
Barcelona
4. Balius Barcelona Catalonia Fully permitted November Registration of the Rezoning project
Organized Agreement of the Barcelona CityHall. Final approval of the
5. Pere IV (Loinsa) Barcelona Catalonia December
fully permitted rezoning plan
6. Edificio Normon Madrid Center-North Fully permitted October Initial approval of the Partial Plan
Organized Final approval of Modification of the Partial Plan and approval
7. Torre del Río Málaga East Andalusia December
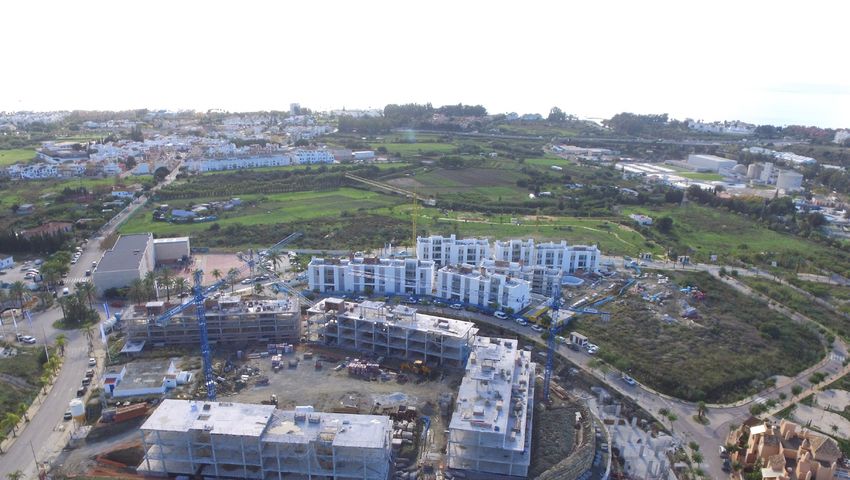
fully permitted of the Detailed Plan
8. San Marcos Santiago de Compostela Center-North Fully permitted December Reception of urbanization works
9. Resid.Norte Albacerrado Tarifa, Cádiz East Andalusia Non urban November Approval of Environmental proprosal
10. "La Cizaña" II Torremolinos, Málaga East Andalusia Fully permitted October Start of urbanization works
Plots transformed into “fully permitted”
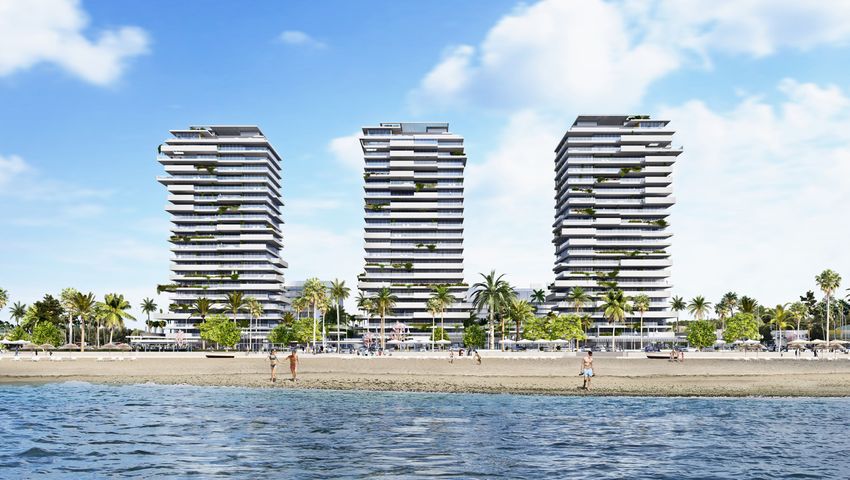
42.Render Torre del Río (Málaga) Q&A
You can also read