Built up area analysis of the green belt of master plan of Delhi (MPD) - 2021 in GIS Platform
←
→
Page content transcription
If your browser does not render page correctly, please read the page content below
th
15 Esri India User Conference 2014

       Built up area analysis of the green belt of master plan of Delhi (MPD) - 2021 in GIS
                                             Platform
                                             Himadri Shekhar Dey1, Greeshma M.A.2
                                     1
                                         Assistant Director (Planning), Delhi Development Authority
                                                2
                                                  Trainee (GIS), Delhi Development Authority
                                                       nd
                                           GIS Unit, 2 Floor, Vikas Minar, I.P.Estate, New Delhi

         Abstract:                                                               About the Author:
         The purpose of the Greenbelt is to protect environmentally
         sensitive land and farmland from urban development and
         sprawl.
         The importance of Greenbelt is to safeguard the central
         Delhi, similarly in south and east side forest and Yamuna
         River treating as a buffer area respectively.                                         Mr. Himadri Shekhar Dey,
         The paper attempts present structure of green belt of Delhi             Mr. Himadri Shekhar Dey, who is Assistant Director
         city indicates successive growth around their cores in the              (Planning) in GIS Unit of Delhi Development
         form of built-up into the rural fringe area. It is evident that         Authority, has done Bachelors (Hons.) & Masters in
         the current trend of urban growth is haphazard along the                Geography from Visva-Bharati & Masters in
         fringe area of green belt.                                              Planning from School of Planning and Architecture,
         This research is focused on the detection of land cover                 New Delhi. He has done Post-Graduate Diploma in
         change within the Greenbelt with the use of remote                      Applied GIS & Remote Sensing from Jadavpur
         sensing and Geographic Information System (GIS). Change                 University, Kolkata. At present he is pursuing Ph.D.
         detection results indicated an increase of urban land area              from Visva-Bharati, Santiniketan in Block level
         and a steady decrease in agricultural land use area.                    Planning & Agricultural Development. He has done
         The results indicate that the city is expanding to-wards its            several thesis on Planning & GIS and have
         peripheral region with the conversion of rural regions in to            experience in guiding students. He has research
         urban expansions.                                                       paper on Indo-Bangladesh Enclaves (Chhitmahals),
         Temporal data of LANDSAT 7 ETM +, ESRI Images (Base                     Importance of Agricultural Development in Block
         map), Open Street Map available with ArcGIS 10.1, GSDL                  Level Planning.
         GIS data (DSSDI), and the approved Master Plans were
                                                                                 E mail ID: himadrishekhardey@yahoo.co.in,
         used for carrying out the mapping of entire Delhi Land use
         as per MPD - 2021. ArcGIS 10.1, data from ArcGIS online,                Contact No: +91-9953858482
         Survey of India sheets, Eicher map of Delhi, high resolution
         imagery and Field data used for finalize the all layer. For
         assessment of functionality, Geo-referencing, Image
         rectification, Vectorization, Editing & Geoprocessing tools
         like Split, Copy Parallel, Union, Clip, Merge, Intersect,
                                                                                                  Ms. Greeshma M.A.
         Erase, and Buffer Analysis is carried out in ArcGIS 10.1.
                                                                                 Ms. Greeshma M. A. has done B.A. (Hons.)
         Image Interpretation & Classification, and Data Cleanup,
                                                                                 Geography from Delhi University and M.Sc. in GIS &
         Topology Creation, Migration of Data etc. is worked out
                                                                                 Remote Sensing form Amity University, NOIDA. She
         through Data Management Tools, Spatial Analyst Tools,
                                                                                 has worked on Mapping of the Inundation Due To
         Conversion Tools, Data Interoperability Tools of ArcGIS
                                                                                 Sea Level Rise for the Coastal Zones of Ernakulam,
         10.1 and ground data for various parameters were
                                                                                 Kerala with National Institute of Oceanography and
         collected through field survey.
                                                                                 done her Master’s thesis on Built up Analysis of the
         The study helps to identify the issues, problems and
                                                                                 Green Belt of Delhi.
         potentials associated with the Green Belts. This paper is an
                                                                                 She is a classical dancer performed in several parts
         attempt to understand change in the development at
                                                                                 of the country including CWG-2010.
         urban extension areas within Green Belt and its influence
         to guide the future development in proper manner.                       E mail ID: grsma.sbsc@gmail.com ,
                                                                                 Contact No: +91-9650554458

                                                                 Page 1 of 10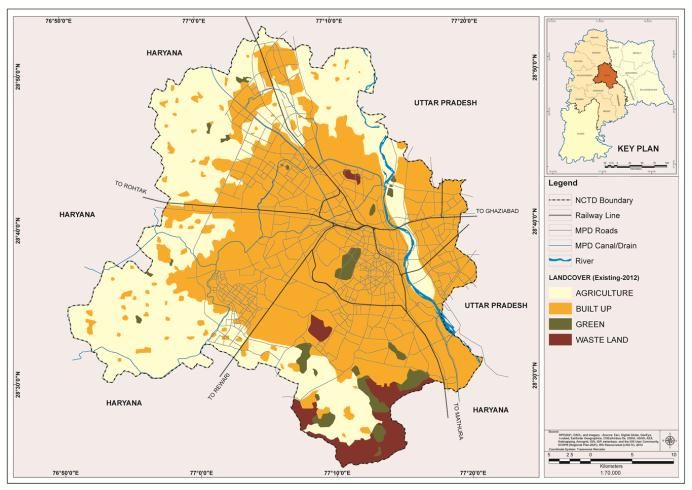
th
15 Esri India User Conference 2014

       Introduction

       Traditionally in the Master Plan of various Towns, the urban areas have been shown as surrounded by a ring of peripheral
       control belt or green belt. This green belt was expected to act as lung space around the urban areas. It was also expected to
       cater to the activities operating in rural areas including agriculture, partly catering to the requirements of the urban uses.

       Background
       The Delhi ridge forests are considered the lungs of the capital, the main areas being the central or the new ridge, and the
       northern or the Old Delhi. The green belt in this area was not completely a gift of nature. Earlier, there were only Kikar
       (Acacia) trees found growing sparsely among the hard rocks. According to the municipal records after 1857, the British
       ordered the planting of thousands of Neem and Babul trees. In 1912, when Delhi became the capital of the British Empire,
       Lutyens, the architect of the new city, ordered the large-scale afforestation of the ridge. Under his leadership this area was
       declared a ‘Reserved Forest’ and no tree could be cut without permission. By the time India attained independence; this
       area was covered with diverse vegetation of plants and trees.
       Green belt refers to an area that is kept in reserve for an open space, most often around larger cities. The main purpose of
       the green belt policy is to protect the land around larger urban centres from urban sprawl, and maintain the designated area
       for forestry and agriculture as well as to provide habitat to wildlife. Green belt offers a number of benefits for both urban
       and rural population. By preventing the urban sprawl, it helps protect agricultural activities and the unique character of rural
       communities.

       Study Area
       The present study has been carried out on Delhi, the capital city of India located between the 28°24′17″N and 28°53′00″N
       latitudes and 76°45′30″E and 77°21′30″E longitudes (Fig. 1-1). Delhi, the National capital Territory situated near the western
       bank of river Yamuna which spreads over an area of around 1,490 km² is surrounded by the Aravali ranges in South - West.
                                                                                    Methodology

                                                                                                              Concept

                                                                                                          Literature Review                  Need of the
                                                                                         (Regional Plan 2021(NCRPB),
                                                                                        MPD 1962, 2001 & 2021 & ZDPs)
                                                                                                                                               Study

                                 Fig.1- Study Area                                                            Setting Aim & Objectives
       Aim

       Analysis of the built-up area in green built under MPD2021 in GIS                                                Primary Data
                                                                                        Data Collection

                                                                                                               (Field Visit, Photographs, Questionnaire)
       platform.

       Objectives                                                                                                      Secondary Data
                                                                                                                (Satellite Imageries, SOI Sheets,, MPD
                                                                                                                           1962, 2001 & 2021)
       The objectives of the study are:
       1. To analysis the spatial distribution pattern of the built-up increase.
       2. To study the past trends of growth and evaluate the growth                                      Analysis of Data                  Remote Sensing
           predictions.                                                                (Image        Interpretation      &
       3. To study the Master Plan proposals of Green Belts in the Delhi               Classification, Vectorization, Clip,
                                                                                       Intersect, Merge, Erase, Editing,
           region & their chronological transformation using GIS data and              Data Cleanup, Topology Creation,
           survey sheets.                                                              Migration of Data)
                                                                                                                                                  GIS

                                                                Page 2 of 10
                                                                                                                Issues Identification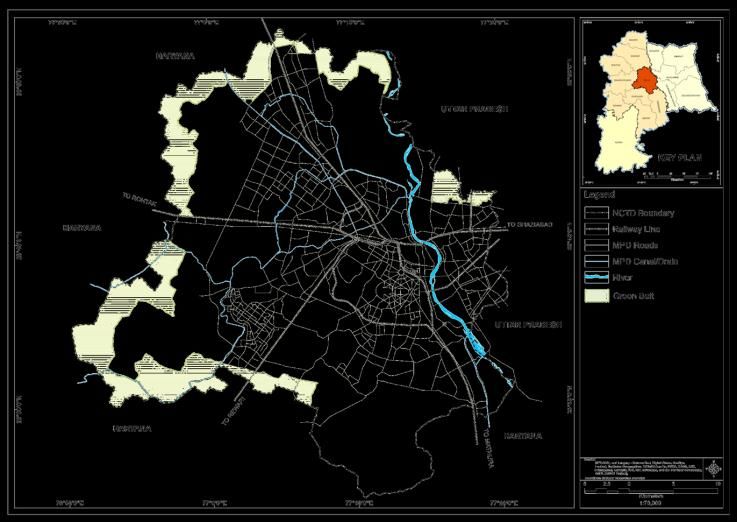
th
15 Esri India User Conference 2014
Purpose
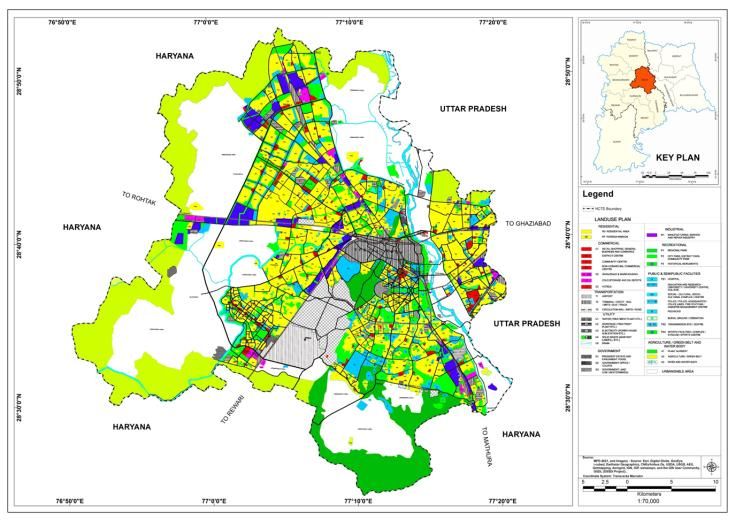
The Land use plan of MPD 2021, in which green belt on the urban extension area (Planning Zones – E, J, G, K-II, L, N, P-I, P-II,)
is shown entirely green. To analyze the impact of urban growth on these green belt, two software packages, Arc Info (ESRI,
10.1), and image processing software are applied to statistically and visually analyse the change in Green Belt. Arc GIS offers
spatial analysis tools to analyse land cover and when it is analysed in GIS software, is found that it isn’t thoroughly green, the
built up area over there is increasing, consequently it is giving rise to un-authorization which eventually is stressing the
green belt area, which is kept and reserved to ensure that there is open space, and is mainly found in cities. The purpose of
green belt land is to protect land from sprawl of urbanization and as a result reserve land for forestry and agriculture, etc. If
in future more stress is given to the fragile area it will have a drastic change over environment which is the need of concern.
The purpose of this study is to analysis the built up area of the Green Belt of Delhi under MPD 2021.
Literature Study
The concept of Green Belt was initially suggested in the late 19th century. In 1898, Ebenezer Howard’s proposed Garden
Cities were intended to be “planned, self-contained, communities surrounded by greenbelts, containing carefully balanced
areas of residences, industry, and agriculture”.
The first Green Belts were designated in London and Sheffield, the former assisted by an Act of Parliament in 1938.
"Green Belt" has been defined as seven to ten miles deep all around the built-up area of Greater London and apart from
some limited "rounding off" of existing small towns and villages, no further urban expansion is to be allowed within this belt.
Case study inferences
Only a restrictive development was permitted in Greenbelt but unpredicted development pressure is the main reason for
the amendment of greenbelt boundaries.
The concept was borrowed from the west but lack of implementation strategy is also responsible for its failure. Without any
specific policy guidelines for the concept, it has been used / attempted in few Indian cities (Delhi, Bangalore, Ahmedabad
and Chandigarh) which overlooked its essence completely.
The concept applied in few Indian cities is very different from the original concept (They are basically green wedges, green
spaces, parks rather than green belts).
Green belt is a strip of planned or protected open space, consisting of recreational parks, farm land, or uncultivated land,
often used to define and limit the boundaries of a community and prevent urban sprawl.
Green belts have ringed major cities to prevent them from sprawling. Planners have used them to separate satellite “new
towns” from the urban core, safeguarding land for recreation, agriculture and forestry.
A city has natural limits, that urban and rural areas should be separated and that settlements should be balanced and
evenly-spaced.
To control urban growth, “Green Belt” as a planning tool can be recommended.
Material Used
(a) Survey of India Sheets (Topographical Map)
Digital data of OSM series map sheets of Survey of India was used. All layers of eight map sheets pertaining to Delhi and
surrounding areas were received and relevant layers were used. NCTD boundary is used for the analysis .SOI sheets no
53D/13, 53D/14, 53H/1, 53H/2, 53H/3, 53H/5, 53H/6 & 53H/7 pertaining to Delhi were used.
Hard copies of the OSM series topographic map sheets were also obtained for planning and cross checking of errors, if
any.
(b) Satellite Data
Landsat 7 Enhanced Thematic mapper (ETM+) images of 2001 and 2009 is used. Seven bands were used except thermal
band along with PAN band, of spatial resolution of 30 meters were used,
ESRI Images (Base map), Open Street Map available with Arc GIS 10.1,
Page 3 of 10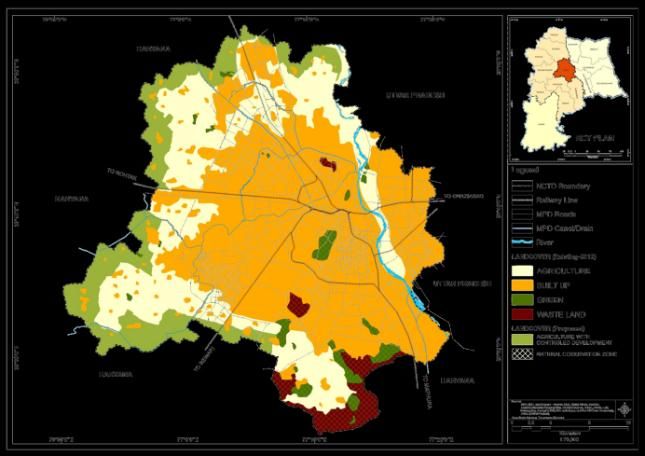
th
15 Esri India User Conference 2014

  (c) GSDL GIS data (DSSDI), and
  (d) The approved Master Plans were used for carrying out the mapping of entire Delhi Land use as per MPD - 2021.
  (e) Arc GIS 10.1, data from Arc GIS online, Eicher map of Delhi, high resolution imagery and Field data used for finalize the all
  layer.
  (f) For assessment of functionality, Geo-referencing, Image rectification, Vectorization, Editing & Geo-processing tools like
  Split, Copy Parallel, Union, Clip, Merge, Intersect, Erase, and Buffer Analysis is carried out in Arc GIS 10.1.
  Image Interpretation & Classification, and Data Cleanup, Topology Creation, Migration of Data etc. is worked out through Data
  Management Tools, Spatial Analyst Tools, Conversion Tools, Data Interoperability Tools of Arc GIS 10.1 and ground data for
  various parameters were collected through field survey.

       Planning/Policy Documents

       (i) Approved Land use plan of Master Plan of Delhi 2021 has been used as its base.
       (ii) Zonal Development Plans of 17 Planning Zones of Delhi under MPD 2021 is also used for detail understanding and to put
             the attributes associated with different features.
       (iii) MPD -1961, & MPD – 2001 is considered for background study & analytical purpose.
       (iv) Regional Plan 2021 prepared by NCRPB is also used for understanding the concept of Green Belt at regional context.
       (v) Concept of Green Belt is also understood from the Plans of London from where basically the concept was obtained to
             MPD 2021.
       (vi) Apart from that the land use plan of Beijing was also studied for understanding the character of the particular land use
             at different parts of the globe.

       Built up - Green Belt Analysis
       Delhi, the national capital, has the distinction of address value, apart from its status as the pre-eminent socio-economic hub.
       The DDA has finalized its policies on green belts; the villages on the periphery of Delhi would be retained as green belts,
       acting as the lungs of Delhi.
       As per MPD - 2021, Green Belt is an area which is kept and reserved to ensure that there is open space and few activities are
       permissible in that area. For more analysis of green belt we first redrafted the green belt to analyse.
       Green belt can be defined as the villages which are amongst the terminal line along the NCTD boundary. According to MPD
       2021 green belt consist of forest, agriculture use, vegetation belt, dairy farms, piggery, poultry farms, farm house, wild life
       sanctuary, bird sanctuary, Biodiversity Park, veterinary centre, police post, fire post, smriti van, plant nursery, orchard etc.

       Comparison of Green Belt of MPD 2021 & Regional Plan 2021

       NCRPB stated green belt as an agricultural use which includes cultivated land, fallow, plantation and horticulture is the
       predominant use of land in the region NCTD which constituted of (1.93%). In the NCT-Delhi Sub-region, built-up is the
       predominant use which constitutes 56.33% of the total area of the Sub-region, followed by agriculture use (34.48%), green
       areas (4.24%), wastelands (3.21%), water bodies (1.52%) and others (0.22%).

              Fig.3- Existing Land use of Regional Plan - 2021           Fig.4- Proposed Land use of Regional Plan - 2021
                                                                 Page 4 of 10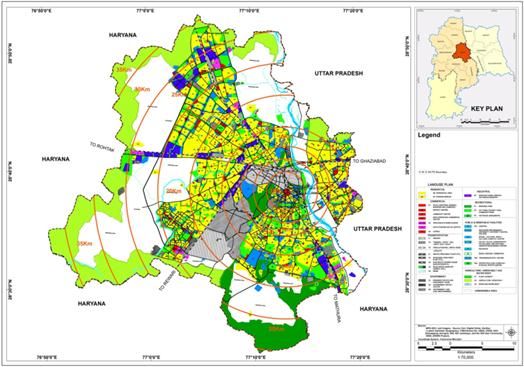
th
15 Esri India User Conference 2014

       MPD-2021 & Green Belt-Area Differences

       As MPD 2021 Green Belt is an area which is kept and reserved to ensure that there is open space and few activities are
       permissible in that area. For more analysis of green belt we first redrafted the green belt to analyse and created base map
       for it and with the help Shannon entropy model we are able to find out the compactness of built up area of every single
       village in green belt.

                              Fig.5- MPD-2021                                       Fig.6- Green Belt under MPD 2021
       As per Master Plan-2021, Green belt of NCTD is calculated 21000 ha. The same is redrafted and calculated an area of
       21714.032 ha. on GIS Platform. On the other hand NCRPB calculated 19061.07 ha. (Excluding Built-Up areas) for the same
       area of Delhi sub-region, which is also termed as Agricultural (rural) Zone with controlled development. In reality after doing
       primary survey it’s not completely green some unauthorized colonies are increasingly growing.

       Villages of Green Belt

       Village revenue boundary consists of two major divisions i.e. Abadi & Agricultural Land. In Green Belt, villages also have the
       same categorise. Abadi which means the built-up area or Habitation is bounded with laldora boundary, which is also the
       only available source for historical data of Village boundary. It was supposed to be used for non-agricultural purpose only.
       Through the term laldora applies to both rural and urban villages, the thin dividing line has vanished over the period of time
       ,and prime areas of Delhi today (through still classified as the laldora) operate commercial and high end residential areas.
       Even though the boundary of laldora still have some limitations due to malpractices and corruption and this was prepared
       with detail primary survey. It is the only available source of historical data kept to patwari.
       It is experienced that there are 45 villages within the Green Belt of MPD 2021, which comprises abadi as well as agricultural
       lands, but with time the character of the abadis are changing in terms of spatial growth, which is again adjusting with the
       counter part that is Agricultural Land.
       Two satellite images are used for analysis of the spatio-temporal changes of the study area. And one high resolution data is
       used to see the temporal change, where abadi is increasing and agriculture is decreasing, as they are inversely proportional.
       Analysis of the changes in relation of built-up area increase is also done for the eight planning zones which consists Green
       Belt as one of the land use.
       Land has become an increasingly scarce resource due to growing population pressure and increasing demand of food.
       Therefore, information on land use/land cover and possibilities for their optimal use is essential for the selection, planning
       and implementation of land use schemes to meet the increasing demands for basic human needs and welfare. Land
       use/land cover pattern of a region is an outcome of interplay between various natural as well as socio-economic factors.
       Land use/land cover refers to the utilization of land by man in time and space. Land use and land cover (LULC) change now
       forms the centre-stage of concern for environmental change at the global level.

                                                                Page 5 of 10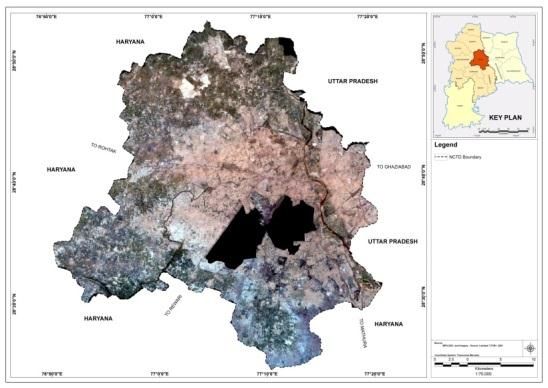
th
15 Esri India User Conference 2014

       Image Analysis and Interpretation
       In this section image analysis methods used for the extraction of built up areas from Landsat images are shown. The first
       part is devoted to image processing and the second part describes the built up area extraction.
       The standard image processing techniques such as image extraction, classification, built up and vegetation analysis through
       erase, clip, intersect etc. were applied in the current study.
       To analyse the extent of urban growth, it is required to have knowledge about the change of land cover with respect to time.
       Hence two temporal images of different time period of Landsat ETM 7 were selected after looking the datasets.
       Landsat 7 satellite is equipped by the enhanced thematic mapper plus (ETM+),the successor of TM the observation bands
       are essentially the same seven bands as TM, and the newly added panchromatic band 8,with high resolution of 15 m was
       added.
           Satellite        Sensor        SPATIAL RESOLUTION       RESOLUTION           ORBITAL PERIOD      Revisit
           Landsat 7        ETM           30 METERS                15 TO 90 METERS      98.9 minutes        16 DAYS

           Fig.7- Satellite Image, 2001                Fig.8- Classified Image, 2001               Fig.9-Built-up, 2001

           Fig.10- Satellite Image, 2009               Fig.11- Classified Image, 2009              Fig.12-Built-up, 2009

                             Fig.13- High resolution Image, 2013                          Fig.14-Built-up, 2001

                                                               Page 6 of 10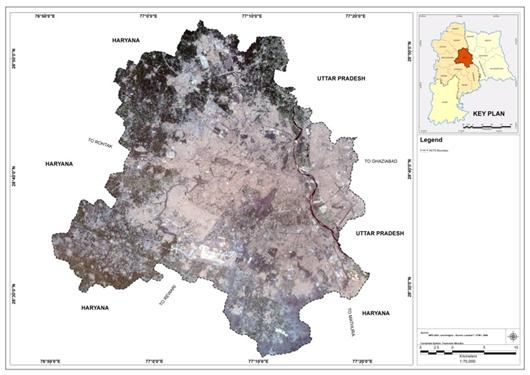
th
15 Esri India User Conference 2014

                  The image obtained by the USGS in seven bands except 6th band (thermal), were used to create a false colour
                  composite (FCC) as shown in fig. Training polygons/signatures were chosen from the composite image. Based on these
                  signatures, corresponding to various land features, image classification was done using supervised classification. From
                  this classification the image was re-classified to four broader categories as vegetation, water bodies, open land, and
                  built up.
                 500
                 450
                 400
                 350
                 300
                 250
   Area in Ha.

                 200
                 150
                 100
                   50
                    0

                                                       built up 2001     built up 2009          built up 2013
                                                   Fig.15- Temporal Changes of Built-up Area

         Classification of urban areas from satellite data

         There are many different approaches to classify remote sensing data. They all fall in under two main topics unsupervised
         and supervised classification.
         Supervised classification -In supervised classification, spectral signatures are developed from specified locations in the
         image. These specified locations are given the generic name 'training sites' and are defined by the user. Generally a vector
         layer is digitized over the raster scene. The vector layer consists of various polygons overlaying different land use types. The
         image below shows the raster image seen earlier with the addition of several training sites outlined on top of it. The training
         sites will help image processing software develop spectral signatures for the outlined areas. The land use categories of
         interest in this are water, agriculture, open space, and built up. Multiple polygons are created for each land use category to
         help ensure that image processing software has sufficient information to create the spectral signatures. Once the training
         sites are developed then we can perform supervised classification.
         Unsupervised Classification -The second attempt made to classify the various land uses in image processing software was
         done using unsupervised classification techniques. Unsupervised classification techniques do not require the user to specify
         any information about the features contained in the images.
         Built up area extraction from classified urban areas
         After doing classification the built up area is clipped for every year in arc info 10.1 through clip tool.
         Vegetation extraction from classified image
         On the other hand as built up is clipped with the help of classification similarly erase tool from ArcGIS 10.1 is used for the
         vegetation changed. From the above analysis the built up area of 2001, 2009, 2013 is increased manifold in respective to the
         actual laldora, which is analysed and shown in the Landsat images and the present high resolution data.

         Discussions & Suggestions

         Aerial expansion of cities in India has occurred on the surrounding agriculture lands for the urban development process.
         Unlike the cites in the west, urban sprawl in India occurs in a more or less contiguous form from the city limits towards the
         fringe areas. In the west, there is generally a gap between the city limit and the patches where built up areas come up in the
         form of sprawl. Unlike this in India context, urban growth and the city share common boundaries. Hence the distance factor
         is missing in India is case. In the wake of urban expansion agricultural fields are acquired by the government agencies for

                                                                    Page 7 of 10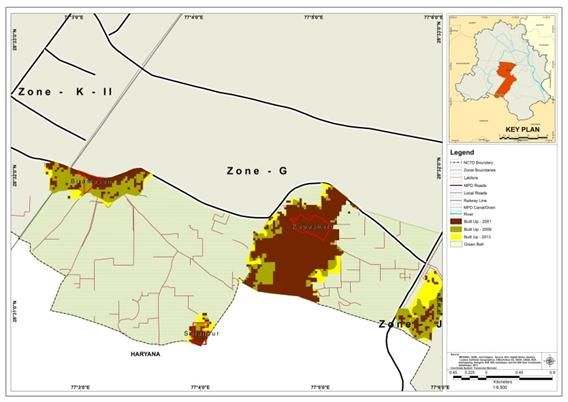
th
15 Esri India User Conference 2014

       urban development .these areas are turned into planned residential or commercial areas. But the problem is with the
       unplanned and haphazard urban growth that takes place on the agricultural land.
       The present structure of most of the Indian cities indicates successive growth around their cores into the rural fringe areas it
       becomes imperative to have current information on urban growth patterns and its impact on the living environment. It is
       evident that the current trend of urban growth is haphazard along the urban-rural fringe areas in most of the Indian cities. In
       order to be able to provide basic amenities and infrastructure for the complex and dynamic urban environment there is an
       obvious need for planners and administrators to monitor the chaotic growth pattern and changing land use along the urban-
       rural fringe, as well as within the densely populated urban core. The outward spread of cities is accompanied by many
       environmental problems: changes in the land use patterns, fragmentation and destruction of wildlife habitat, discharge of
       polluted runoff water into main river channels etc.
       The present study has analysed urban growth and urban land transformation in the Green Belt of Delhi with the help of
       remote sensing and GIS techniques. Urban growth has taken place at a fast pace in the outskirts of Delhi during the recent
       past. Towns and cities have expanded their boundary towards agricultural land or open land. Many villages in Green Belt are
       growing very fast due to its proximity to national capital, Delhi.

                                              Fig.16 & 17- Temporal Changes of Built-up Area
       According to NCR Regional Plan 2021, “Green Areas” are non-agriculture vegetated areas which include dense vegetated
       area including forests, plantation and open scrub and constitute 3.30% of the NCR.
       The study is mainly based on secondary data. However, field observations were also undertaken for ground truth
       verification.
       The concept of the Green belt of Delhi under MPD – 2021came from the Abercrombie Plan for Greater London (1946) was
       reduction of the population within the congested centre, creation of green belt ring to contain Greater London and shifting
       of industry to an Outer Ring.
       Urban expansion in the previous master plans has been based on policy of large-scale acquisition and disposal of land by
       DDA. There has been mixed results of this policy. The present process of acquiring, developing and keeping the land vacant
       till it is actually utilized is a process offers incentives for encroachment and results in far more money being spent on
       improvement. It has resulted in green belt in the creation of a large number of unauthorized colonies and J.J. clusters.
       The built-up in peripheral areas are growing rapidly and expanding at the green belt. The process of urban growth refers to
       spread of urban settlements outside the rural fringe. In other words, it is the growth of built up area outside the village
       limits. Many large urban centres are facing problems of the congestion of the city core and, in some cases cities are facing
       decay also due to saturation within the proper city or the urban limits. This results in pressure on the cities. Fringe areas and
       nearby villages start merging, and over time become part of the city due to the process of suburbanization. Rapid growth of
       population and congestion of the core areas encourage middle class people to seek residence along the fringe areas and,
       thus the process of urban sprawl starts. Slowly the surrounding villages are absorbed and the sprawl further extends
       outward into a new fringe area. Sprawl, thus, is a continuous process of expansion of cities. The suburbanization in many
       Indian cities started with newly added industrial and commercial functions. The cities have developed haphazardly without
       proper planning, because planning was introduced only after the conditions started failing.

                                                                 Page 8 of 10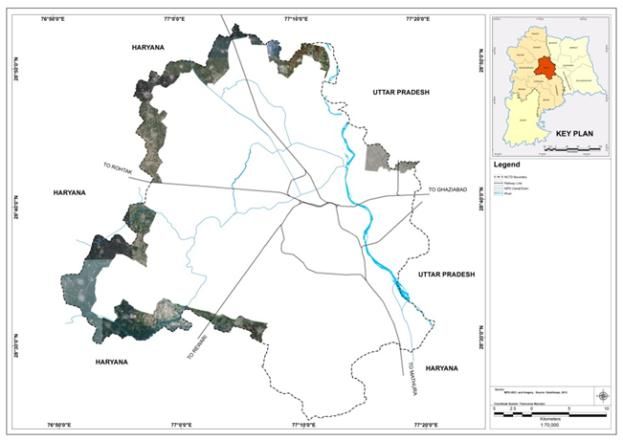
th
15 Esri India User Conference 2014

                    Fig.18-City Growth Direction Analysis                           Fig.19-Buffer Analysis

       It is evident that the growth of the National Capital is much more in western side in compare to the Eastern side, which may
       correlate the natural features such as the presence of River Yamuna which restrict its growth in the eastern side. It may also
       assume from the ancient history that the distribution of princely state are also one such reason behind. On the other hand it
       can also be said that if the Connaught Place is considered as City Centre or Central business District from the period of
       British India, the Industrial activities were developed along the river bank, which in later period shifted or removed to check
       the city health. Due to that reason also city mainly had the natural growth of settlement on the western side. From Fig. 18 it
       can be analysed that the city is mainly bounded within a radius of 15 km from the city centre. In between 15-20 km of
       radius, it is seen that there are several Colonies which are highly congested in nature and mainly unauthorised settlements,
       except Rohini in the Northern Part. From 20-25 km the area is mainly under the provision of future development i.e.
       Urbanisable Area which comprises mainly the Agricultural Land.
       After 25 Km, the Green Belt starts, and as it comprises along with the Last Peripheral Boundaries of NCTD and the boundary
       is not common with 25 km radius arc, it is seen that some where the Green Belt is at a distance between 25-30 Km or
       hereafter from the city centre. Green Belt which consist agricultural land and abadi villages mainly at this distances are easily
       accessible to the city centre through different means of transport. So being in such a distance also, it has the pressure of
       Urban Growth. The delineation of Green Belt is very clear in the Plan, but in real ground it creates confusion between
       Urbanisable area and itself. On the other hand malpractices and other illegal activities also create a negative impression to
       sustain it.
       Buffer Analysis through the Multi Ring Buffer tool of Arc Info is done to understand the distance and the pattern of Green
       Belt distribution in the National Capital. It is seen that maximum portion of the Green Belt is within 25-30 km; otherwise it
       touches almost after 15 Km buffer as the shape of the city is not so even.

References
       1.   Bhowmik, S. (2011). Revisiting the provisions of green belts in Indian cities: A case of Jaipur. MALAVIYA NATIONAL
            INSTITUTE OF TECHNOLOGY JAIPUR, DEPARTMENT OF ARCHITECTURE. JAIPUR: Malaviya National Institute of
            Technology Jaipur.
       2.   Campaign to Protect Rural England. (2007). Green Belts Shrink Despite Prescott Pledge. Sheffield.
       3.   Campaign to Protect Rural England, & Natural England. (2010). Green Belts: A greener Future. Natural England.
            Sheffield: Natural England.
       4.   Carolyn, H. (2002). Spatial Planning England. Green Structures and Urban Planning: European Cooperation in the field of
            Scientific & Technical Research.
       5.   Carolyn, L. (2006, January). Planning reunification: the planning history of the fall of the Berli wall. 21 Planning
            Perspectives, 67.
       6.   Christian, C. (2008). Brabant Centre for Sustainable Development, The StoryBehind the Story. International Examples of
            Sustainable Area Development ( Lifescape Your Landscape).
       7.   Countryscape,,. C. (2005, October). The Countryside Next Door. Report to the Campaign to Protect Rural England.
       8.   DDA. (2010). Draft Zonal Plan - Planning Zone - L (West Delhi - III). Delhi Development Authority, Planning. New Delhi:
            Delhi Development Plan.

                                                                 Page 9 of 10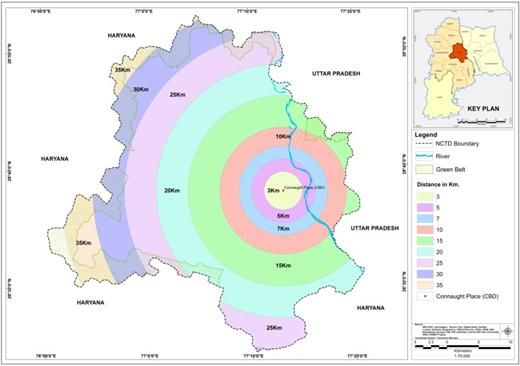
th
15 Esri India User Conference 2014

       9. DDA. (2010). Master Plan of Delhi - 2021. Delhi Development Authority. New Delhi: Delhi Development Authority.
       10. DDA. (2010). Zonal Development Plan - Planning Zone- K-II (Dwarka). Delhi Development Authority, Planning. New
           Delhi: Delhi Development Authority.
       11. DDA. (2010). Zonal Development Plan for Zone - J (South Delhi -II). Delhi Development Authority, Planning. New Delhi:
           Delhi Development Authority.
       12. DDA. (2010). Zonal Development Plan for Zone - N (North West Delhi -III). Delhi Development Authority, Planning. New
           Delhi: Delhi Development Authority.
       13. DDA. (2010). Zonal Development Plan For Zone G (West Delhi I). Delhi Development Authority. New Delhi: Delhi
           Development Authority.
       14. DDA. (2010). Zonal Development Plan For Zone P-I, Narela. Delhi Development Authority, Narela Project . New Delhi:
           Delhi Development Authority.
       15. DDA. (2010). Zonal Development Plan For Zone P-II(North Delhi). Delhi Development Authority. New Delhi: Delhi
           Development Authority.
       16. DDA. (2010). Zonal Development Plan zone (DIVISION)''E'',East Delhi. Delhi Development Authority. New Delhi: Delhi
           Development Authority.
       17. Kshirsagar, J. B. (2007). EVALUATION STUDY OF DMA TOWNS IN NATIONAL CAPITAL REGION (NCR) . MINISTRY OF
           URBAN DEVELOPMENT, GOVERNMENT OF INDIA , TOWN AND COUNTRY PLANNING ORGANISATION , New Delhi.
       18. Marco, A. (2005). A Study on the Planning Processes and Future Directions of the London Green Belt: An Investigation of
           Local Level Planning. University of Tsukuba.
       19. Mohan, M., Pathan, S. K., Narendrareddy, K., Kandya, A., & Pandey, S. (2011, November). Dynamics of Urbanization and
           Its Impact on Landuse/Landcover: A case Study of Megacity Delhi. Journal of Environmental Protection, 2, 1274 - 1283.
       20. Ontario Greenbelt Alliance website, Greenbelt 2.0. . (n.d.). Retrieved from http://www.greenbeltalliance.
           ca/?q=node/32.
       21. Peng, H. (2005). Analysis of the Beijing Green Belts Plans using GIS. Thesis, Washington State University, Landscape of
           Architecture.
       22. Rahman, A., Kumar, Y., Fazal, S., & Bhaskaran, S. (2011). Urnaization and Quality of Urban Environment Using Remote
           Sensing and GIS Techniques in East Delhi-India. Journal of Geographic Information System, 3, 62 - 84.
       23. REPORT, T. A. (2010). an urban vision for india.
       24. Sanyal, S., Nagrath, S., & Singla, G. (n.d.). THE ALTERNATIVE URBAN FUTURES. WWF. Mirabilis Advisory.
       25. Sharma, R., & Sharma, V. (2011). Commercial Real Estate in Delhi NCR. New Delhi.
       26. Shrey, S., Kandoi, S., & Srivastava, S. (n.d.). Urban Planning in India. SOC 477 Project.
       27. Sudhira, H., Ramachandra, T., & Jagadish, K. (2004). Urban Sprawl: Metrics, Dynamic & Modelling using GIS.
           International Journal of Applied Earth Observation and Geoinformation,, 5(1), 29-39.
       28. Thomas, R. (1981). Information Statistics in Geography, Geo-Abstracts. Norwich, United Kingdom: University of East
           Anglia.
       29. Yeh, A. G., & Li, X. (2001). Measurement and Monitoring of Urban Sprawl in rapidly growing region using Entropy.
           Photogrammetry, Engineering, Remote Sensing, 67(1), 83-90.

           Disclaimer: This document presents results drawn from the drawing analysed in ArcInfo software, but the interpretation of it and other
           views expressed in this text are those of the authors. This text does not necessarily represent the views of any offices. The authors bear
           full responsibility for all errors and omissions in the interpretation of the research output.

                                                                     Page 10 of 10
You can also read