SPATIO-TEMPORAL ANALYSIS OF LAND USE/LAND COVER CHANGE THROUGH OVERLAY TECHNIQUE IN KINNAUR DISTRICT OF WESTERN HIMALAYA ANÁLISIS ESPACIO-TEMPORAL ...
←
→
Page content transcription
If your browser does not render page correctly, please read the page content below
Sustainability, Agri, Food and Environmental Research, (ISSN: 0719-3726), 9(1), 2021: 50-65
http://dx.doi.org/10.7770/safer-V0N0-art2161

    SPATIO-TEMPORAL ANALYSIS OF LAND USE/LAND COVER
     CHANGE THROUGH OVERLAY TECHNIQUE IN KINNAUR
             DISTRICT OF WESTERN HIMALAYA

   ANÁLISIS ESPACIO-TEMPORAL DEL USO DE LA TIERRA /
  CAMBIO DE LA CUBIERTA DE LA TIERRA A TRAVÉS DE LA
TÉCNICA DE REVESTIMIENTO EN EL DISTRITO DE KINNAUR DE
                 HIMALAYA OCCIDENTAL

                          Rajan Maurya1*, V.S. Negi2 and B.W. Pandey1
1
 Department of Geography, Delhi School of Economics, University of Delhi, Delhi-
110007
2
 Department of Geography, Shaheed Bhagat Singh College (Ev.), Sheikh Sarai,
University of Delhi, Delhi-110067

*Corresponding Author: Email: rajanmaurya.73@gmail.com

                                               ABSTRACT

        Globalisation is irrevocable as well as its dependency on natural resources which is
increasing at an unprecedented pace and this growing demand indirectly contributes to
the depletion of natural resources. Major drivers of globalisations can be directly linked to
the changes in Land use/Land cover (LULC). It is within the mandate of LULC to facilitate
in sustainable planning and management of natural resources and in addition to
management, it also mandatory to monitor and evaluate the changes in environment. In
order to identify the land use pattern, many researchers from all over the world use many
remote sensing and Geographical Information System (GIS)-based model in their
research. However, this study investigates the changes in land use pattern by adopting
digital change detection model with geo-referenced multi-temporal remote sensing data.
It then further analyses the spatial-temporal variation, based on the secondary data, of
LULC in the Kinnaur district of Himachal Pradesh. Accordingly, Landsat imageries are
gathered from the United States Geological Survey (USGS) for a different period like
Landsat TM, Landsat ETM +, and Landsat OLI. In the past few decades, developments in
Kinnaur in terms of hydro projects; construction of dams, tunnels and roads, show a trend
of conversion in the pattern of land use. This study develops a result which shows an
increase in the built-up area, land under agricultural and Horticultural activities and even
increase in precipitation level (in the form of snow) in the district and gradual decrease in
the area covered by wasteland over a period of 1990 to 2018.

Keywords: Natural Resources, Land Use/ Land Cover, Kinnaur, Hydroelectric Projects.

                                                    50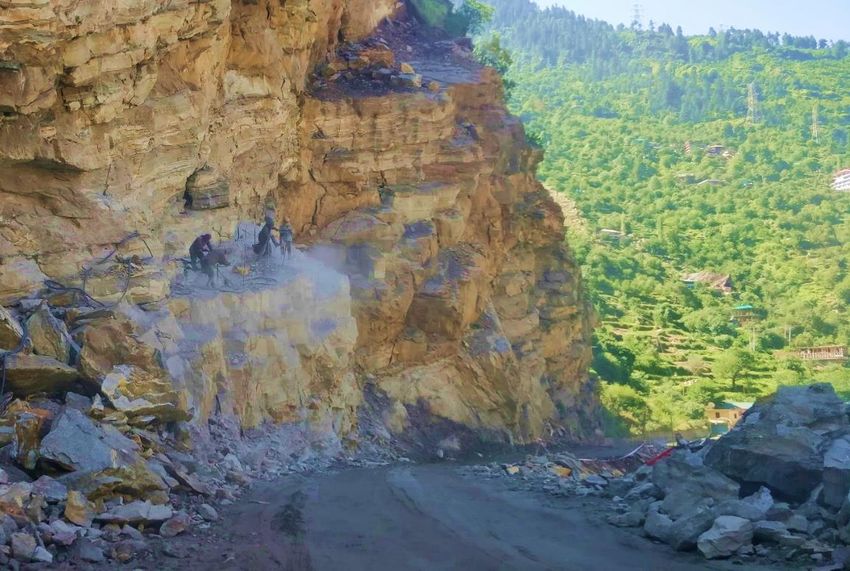
Sustainability, Agri, Food and Environmental Research, (ISSN: 0719-3726), 9(1), 2021: 50-65
http://dx.doi.org/10.7770/safer-V0N0-art2161

                                               RESUMEN

        La globalización es irrevocable, así como su dependencia de los recursos naturales,
que está aumentando a un ritmo sin precedentes y esta demanda creciente contribuye
indirectamente al agotamiento de los recursos naturales. Los principales impulsores de las
globalizaciones pueden vincularse directamente a los cambios en el uso del suelo /
cobertura del suelo (LULC). Está dentro del mandato de LULC facilitar la planificación y
gestión sostenible de los recursos naturales y, además de la gestión, también es
obligatorio monitorear y evaluar los cambios en el medio ambiente. Para identificar el
patrón de uso de la tierra, muchos investigadores de todo el mundo utilizan muchos
modelos basados en el Sistema de Información Geográfica (SIG) y teledetección en sus
investigaciones. Sin embargo, este estudio investiga los cambios en el patrón de uso de
la tierra mediante la adopción de un modelo de detección de cambio digital con datos de
detección remota multitemporales geo-referenciados. Luego analiza más la variación
espacio-temporal, basada en los datos secundarios, de LULC en el distrito de Kinnaur de
Himachal Pradesh. En consecuencia, las imágenes de Landsat se recopilan del Servicio
Geológico de los Estados Unidos (USGS) para un período diferente, como Landsat TM,
Landsat ETM + y Landsat OLI. En las últimas décadas, desarrollos en Kinnaur en términos
de proyectos hidroeléctricos; La construcción de presas, túneles y carreteras, muestra una
tendencia de conversión en el patrón de uso del suelo. Este estudio desarrolla un resultado
que muestra un aumento en el área urbanizada, tierra bajo actividades agrícolas y
hortícolas e incluso un aumento en el nivel de precipitación (en forma de nieve) en el
distrito y una disminución gradual en el área cubierta por tierras baldías durante un
período de 1990 a 2018.

Palabras clave: Recursos naturales, Uso del suelo / Cubierta del suelo, Kinnaur, Proyectos
hidroeléctricos.

                                            INTRODUCTION

        Activities, especially in the anthropogenic activities such as deforestation,
constructions, deconstruction, and reconstruction of built-up areas such as infrastructure,
development, urbanization, tourist inflow and related development all have led to
alterations in the dynamics of land use and land cover (LULC). What matters about land
use dynamics is directly proportional to the quantum of anthropogenic interventions, and
the intent that drives development (Negi 2009). The drivers may have short term as well
as long term impacts which over time may turn into blessings for generations to come or
it can be vice-versa as well (Chawla et al. 2012). To understand the changing dynamics,
multiple techniques are applied by academicians to understand the depth of an ongoing
study. Geospatial and satellite data strengthens research understanding of a changing
landscape over a period that meets parameters of a research inquiry to fulfil the gaps
(Singh 1996).

        Infrastructure development has been recognised as one of the primary factors
which have led to large scale LULC change. And the responsible agent for such changes is
anthropogenic and development activities (Reid et al. 2000). However, socio-economic
goals, luxurious desires and technological advancements have been on an accelerating
trajectory with each passing day. Most of these developments have cost dear to balance
nature, which has subsequently declined the integrity of the ecosystem (Gupta 2007). At
the same time, land use transformation has become a compelling choice and adaptive
mechanism to cater to the needs of people (Pandey 2002). Development activities have
been increasing at an extreme rate to accommodate people to meet their economic needs

                                                    51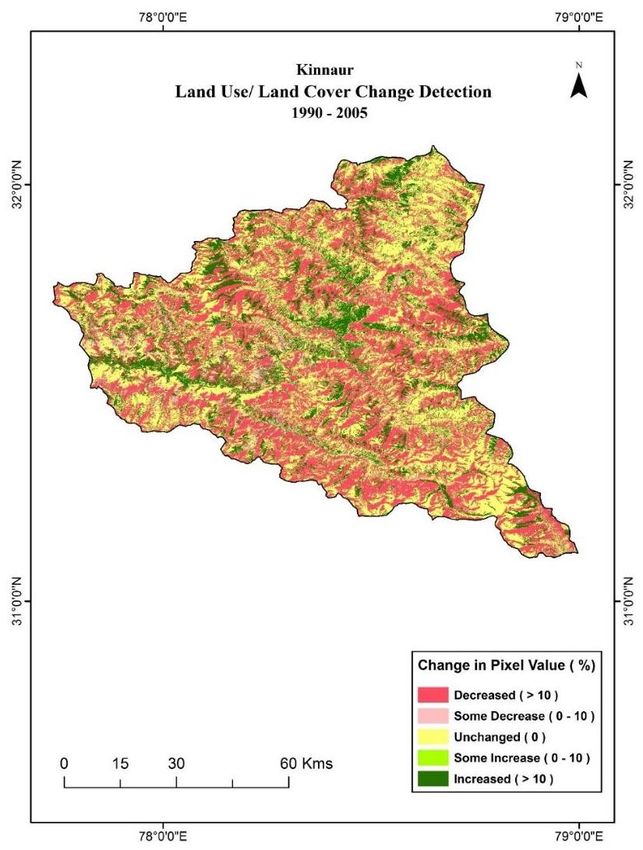
Sustainability, Agri, Food and Environmental Research, (ISSN: 0719-3726), 9(1), 2021: 50-65
http://dx.doi.org/10.7770/safer-V0N0-art2161

and basic requirements (Mahmood et al. 2010). Rapid growth in anthropogenic activities
in the Himalayan states of India has created an imbalance between upland -lowland
interaction. This causes degradation of the natural ecosystem of Himalaya and supporting
services of it which leads to rapid change in land use pattern (Pandey and Jha 2012).
Destruction of upland areas has impacted on lowland system, which resulted in extreme
weather conditions like floods and drought at the same place, which also indicated the
imbalance between natural and anthropogenic activities (Pandey et al. 2017).

        Currently, demand for 24X7 power supply put load on every drainage system which
drastically changes the land uses by the establishment of hydroelectric projects (HEP) on
major streams and nallas of the Kinnaur district, which makes it one of the highest power
generation district of Himachal Pradesh. This district experienced a revolution in apple
orchard farming during the decades of 90s, just because of the demand of ‘Kinnauri apple’
in the local and national market. Apple orchard farming has changed the economy of the
district and lifestyle of tribal communities which has led to rapid change in land-use
patterns of district along the valley of the Sutlej river (Maurya and Mishra 2017). The
improved economic condition of the tribal community has also led to an increase in a built-
up area and decrease in the wasteland, open forest or outer forest land is now converted
into orchards of apple and other fruits (Singh et al. 1992). In the present day, research
related to spatial-temporal analysis is widespread to find the intent of dynamics of it; and
to understand the level of change on the surface to perform any development activities in
the interested area. The changing pattern of development and uneven extent of growth at
an alarming rate in the mountainous region give this study more critical. Due to variation
in temperature and extreme weather condition, it becomes essential to have a sustainable
model of development and growth (Prasad et al. 2016). For this purpose, the study of
LULC is to gain more attention in research fraternity. By dint of its importance, an attempt
is carried out to analyse the LULC pattern and level of development activities in Kinnaur
district.

       The objectives of the study are investigating the land use/land cover pattern of
Kinnaur district and examine the impact of development works in Kinnaur district on LULC
pattern.

                                          MATERIAL AND METHODS

        Study Area: Kinnaur is situated in the western part of the Himalaya (figure 1). It is
one of the scheduled tribe districts of the Himachal Pradesh which is located in the eastern
part bordered with Tibet (China). It adjoins with other districts of Himachal Pradesh like
in the west part Kullu, Lahul and Spiti in North, and Garhwal Himalaya in the south. Its
latitudinal extent is 31o 35’40’’ to 31o34’42’’ north, and the longitudinal length is 77o52’38’’
to 78o51’28’’ East and found in the Toposheet of Survey of India, Toposheet No. 53E/14/3,
53E/14/6.

       It has three development blocks, i.e., Nichar, Kalpa and Poo. Nichar region has
dense forest, and the density of forest gradually decreases from lower to the upper area
of Kinnaur. The Hindu population dominates the lower region of the district, the middle
part shows the mixed culture of Hinduism and Buddhism, and the Buddhist people
dominate the upper part (Lata R. et al. 2015). Sutlej river enters through Shipki La Pass
and passes throughout the district in a south-west direction, and enter into Shimla district.
Kinnauri and Hindi are the prominent languages spoken in the district.

                                                    52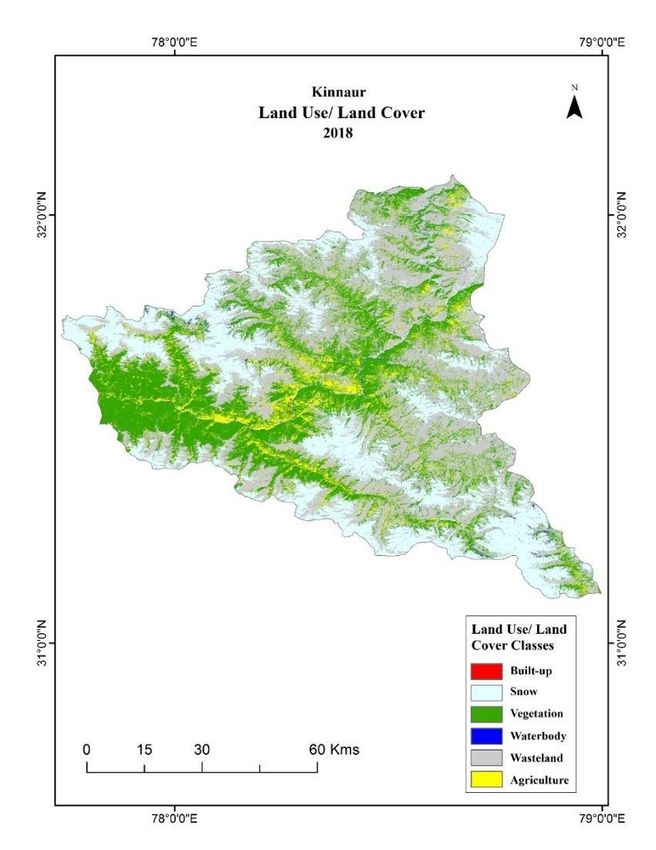
Sustainability, Agri, Food and Environmental Research, (ISSN: 0719-3726), 9(1), 2021: 50-65
http://dx.doi.org/10.7770/safer-V0N0-art2161

Figure 1. Location of Study Area. Source: Prepared by the author with the help of map of
Census of India, 2011

        Images obtention and processing: The Landsat images of 1990 (TM), 2005 (ETM
+) and 2018 (OLI) are collected from the United States Geological Survey (USGS). Further,
in the study we have used eight spectral bands (1-8) for all the images to perform the
layer stacking. In order to neglect the scan line corrector (SLC) error of the Landsat
(ETM+) images, we have performed the focal analysis function from the spatial
enhancement option in Erdas Imagine 9.2. However, this function is especially used to
eradicate the SLC error. It actually fills the gaps of the satellite images based on its
neighbouring pixels. Similarly, we have also used the Landsat images of the same period
to authenticate the consistency of the images. For the preparation of the map ArcGIS 10
software has been used. This application also used to delineate the shapefile of Kinnaur
district based on the revenue map, which is converted into WGS-1984 projection system.
After that, Erdas Imagine 9.2 is used to make a vector layer of shapefile as AOI to extract
boundaries from the satellite images for both time frames. Supervised classification
technique has been performed after selecting six land use classes, i.e. build-up, snow,
vegetation, waterbody, wasteland, and agriculture. After classifying all the three images,
change detection technique has been applied to identify the changes in attributes of a
particular region over the period.

                                                    53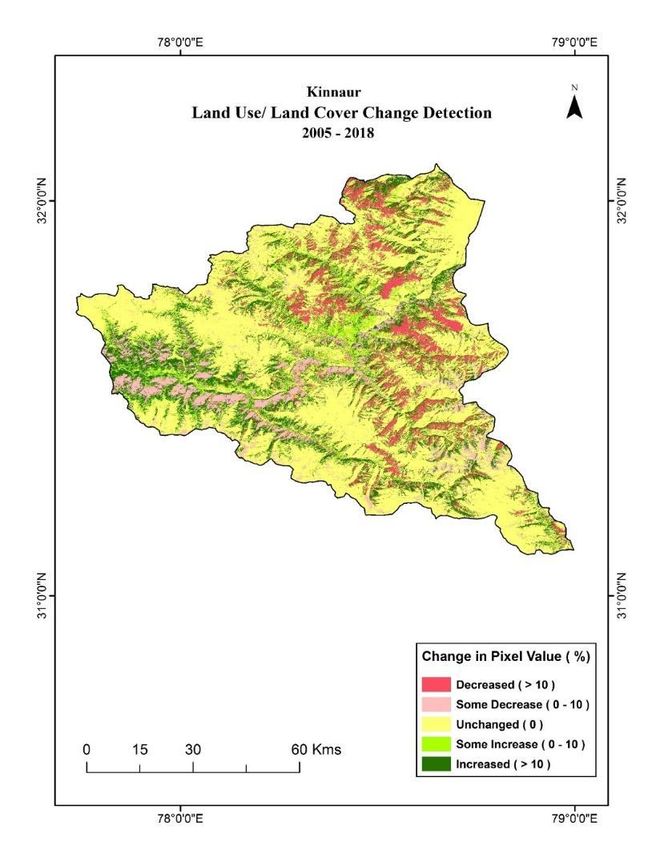
Sustainability, Agri, Food and Environmental Research, (ISSN: 0719-3726), 9(1), 2021: 50-65
http://dx.doi.org/10.7770/safer-V0N0-art2161

        Two continuous raster images are allowed as input in the change detection matrix
technique. There is a threshold value defined by the user for the change of a single pixel,
and it should be marked as the change from one year to the next year. After this process,
a highlighted file is created; and in this file, we can identify the increase or decrease in
the particular threshold value by marking the pixel.             We have to classify the
demarcated/highlighted changes in per cent as increased or decreased more than 10 per
cent respectively. Those highlighted pixels in the map could represent the area where
construction of new roads, dams, horticulture products, and settlement area has been
constructed on wasteland or forest area. This map gives us a quick overview of changes
in a particular area over two time periods. It is like spatial and temporal analysis of that
area with the changes in land use.

        The Matrix analysis, which is a tool of GIS analysis, is used to compare two thematic
images of different years. In this, we have given two supervised classification images as
input and compared two classified sets of data. Then the elimination of false positives due
to difference in radiometry. For example, three detailed images were layered into the
remote sensing process and had near about three classes in each file of snow or any other
LULC pattern. After the matrix operation resulting data shows a thematic range of
particular classes such as ‘was snow is now snow’ or ‘was wasteland is now wasteland’. If
it shows no change from the previous year, then it means there is no change in snow area
or wasteland (for each land use classes, the same process is done) in the present year. It
gives an idea about the changes in land use pattern from last year.

       Land Use/Land Cover Change (1990-2018): In the present study, to identify the
change in land use, and land cover in Kinnaur district, we have used satellite images of
the Landsat (TM) image of January 13, 1990, Landsat (ETM+) image of December 16,
2005, and Landsat (OLI) image of December 28, 2018 in this research paper and by using
maximum likelihood classifier algorithm, supervised classification has been performed.

                                    RESULTS AND DISCUSSION.

        Land Use pattern shows changes in physical factors of any area within a period. It
also shows a link between the historical and socio-economic differences in a particular area
(Kumar et al. 2013). Due to the growth of population in Kinnaur district and limited natural
resources leads to pressure on the environment and ecology of this region (table 1). It
can be seen that the decadal growth rate of population is increasing day by day because
of the modern health system (figure 2). Enormous pressure is on natural resources, and
it becomes imperative to know the pattern of LULC for the sustainability of Kinnaur district.
During 1990, in Kinnaur district area under snow and wasteland is larger than the area
under built-up, vegetation, water body and agriculture (figure 3). Due to globalisation,
increased demand of Kashmiri apple in the international market, and to fulfil the national
requirement, the apple of Himachal and Uttarakhand are rapidly increased. In Kinnaur
district, horticulture land under the vegetation is increased along both sides of the river
Sutlej, and settlement area near Nichar, Sangla, and Kalpa valley. There is no forest cover
in the upper part of Kinnaur; upper part of vegetation cover is dominated with apple
orchards, apricot, wall nut orchards and many other dry fruits, shrubs and alpine pasture
(figure 4).

                                                    54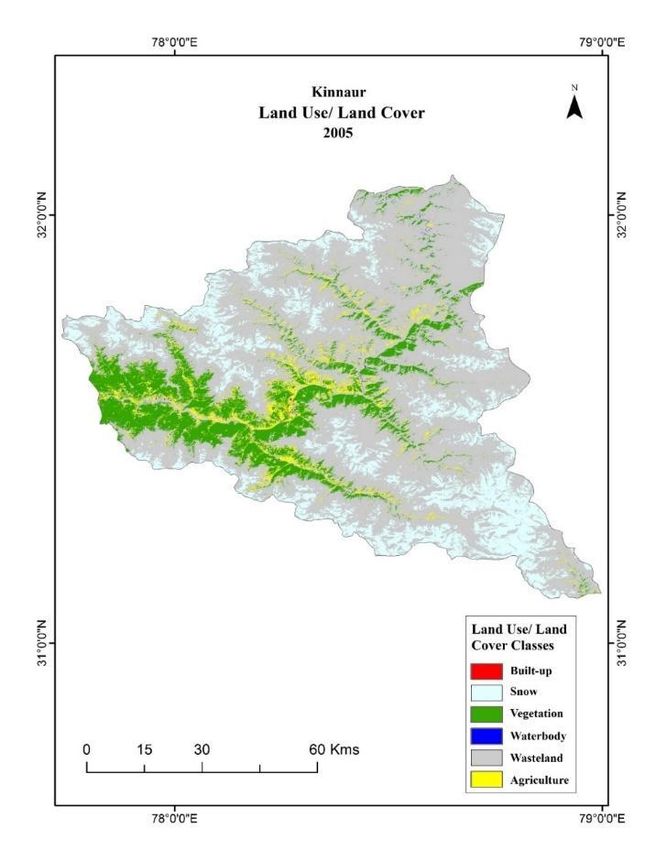
Sustainability, Agri, Food and Environmental Research, (ISSN: 0719-3726), 9(1), 2021: 50-65
http://dx.doi.org/10.7770/safer-V0N0-art2161

Figure 2. Decadal Growth Rate of Population of Kinnaur District. Source: Census of India,
2011

Table 1. Population, Decadal Growth Rate, and Population Density of Kinnaur District.

 Sl.       Year            Population            Decadal Growth Rate            Population Density
 No.                                                     (%)                   (person per sq. km)

   1       1901               27,232                         NA                          NA
   2       1911               28,470                      (+) 4.55                       NA
   3       1921               28,191                      (-) 0.98                       NA
   4       1931               30,445                      (+) 8.00                       NA
   5       1941               33,238                      (+) 9.71                       NA
   6       1951               34,475                      (+) 3.72                       NA
   7       1961               40,980                     (+) 18.87                       NA
   8       1971               49,835                     (+) 21.61                       NA
   9       1981               59,547                     (+) 19.49                       NA
  10       1991               71,270                     (+) 19.69                       11
  11       2001               78,334                      (+) 9.91                       12
  12       2011               84,121                      (+) 7.39                       13
Source: Census of India, 2011

                                                    55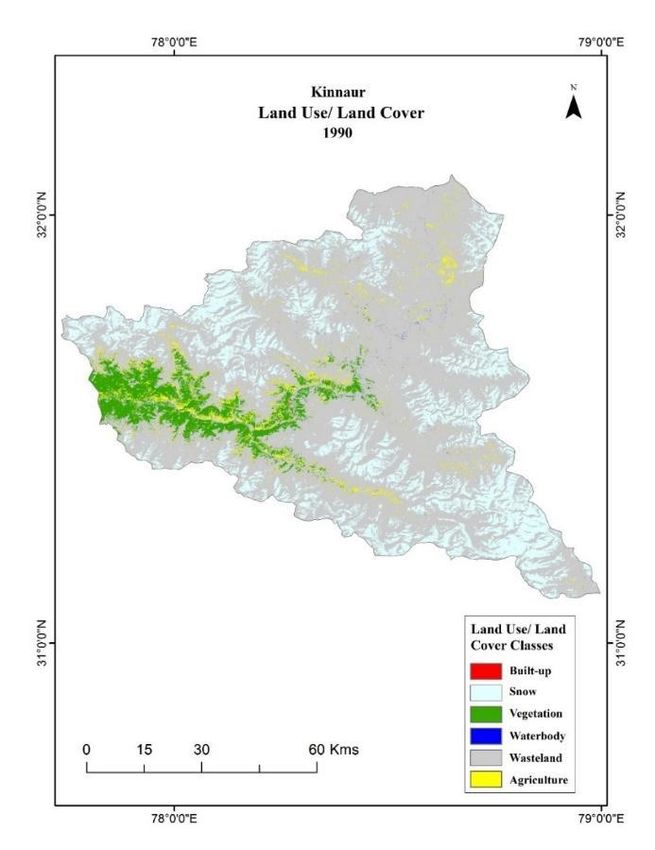
Sustainability, Agri, Food and Environmental Research, (ISSN: 0719-3726), 9(1), 2021: 50-65
http://dx.doi.org/10.7770/safer-V0N0-art2161

Figure 3. Land Use of Kinnaur District by Supervised Classification, 1990. Source: Prepared
by author with the help of LANDSAT TM imagery.

Figure 4. Land Use of Kinnaur District by Supervised Classification, 2005. Source: Prepared
by author with the help of LANDSAT ETM+ imagery.

                                                    56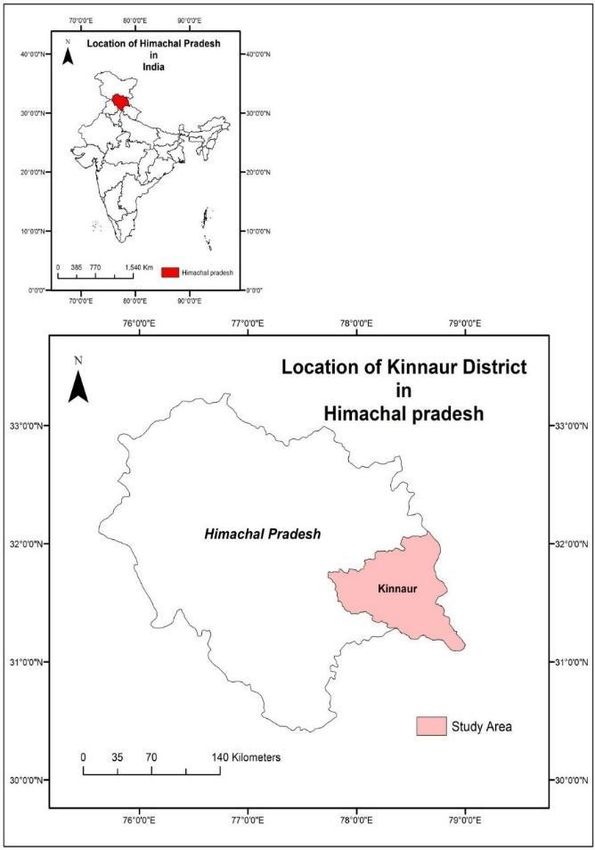
Sustainability, Agri, Food and Environmental Research, (ISSN: 0719-3726), 9(1), 2021: 50-65
http://dx.doi.org/10.7770/safer-V0N0-art2161

        The most built area is increased in Kalpa (Rekong peo), Nichar (near Bhaba Nagar),
and Sangla in Baspa Valley. Climatic variation of grains changed the pattern of demand
in the lower part of the valley or the plains region. Agricultural land is rapidly increased in
the last few decades because of the increasing demand of the cereals, potatoes, peas and
local grains in the lower area (figure 5). The land use/land cover pattern shows an
increasing trend in agriculture land, built-up area, and vegetation area. It is observed that
in the year 1990, 2.7 per cent, 0.1 per cent and 6.5 per cent of the overall geographical
area was covered by agriculture, built-up and vegetation cover respectively. It shows the
decreasing amount to 15.6 per cent in agriculture, 0.6 per cent in built-up, and 14.7 per
cent in vegetation covered in 2018 (figure 6). The reason behind increased per cent in
vegetation is the encroachment of open forest land under the plantation of horticulture
products like apple, cherry, and dry fruits.

 Figure 5. Land Use of Kinnaur District by Supervised Classification, 2018. Source:
Prepared by author with the help of LANDSAT OLI imagery.

       Wasteland area is reduced rapidly from 1990 to 2018. It is observed that 70.1 per
cent to 65.0 per cent from 1990 to 2005 and 43.8 per cent in 2018. Snow cover data
shows that there is an uneven pattern of increase and decrease of snowfall over the few
decades. As it is evident from that in 1990, snow cover was 20.6 per cent of the total
geographical area and then 17.5 per cent, 25.0 per cent in 2005 and 2018 respectively
(table 2). This increasing and decreasing amount of snow is related to local phenomenon
and the rising temperature of this area. Every alternate year rate of snowfall is high. Due
to many development activities, increased dust particle, which resulted in temperature

                                                    57
Sustainability, Agri, Food and Environmental Research, (ISSN: 0719-3726), 9(1), 2021: 50-65
http://dx.doi.org/10.7770/safer-V0N0-art2161
increase. It is the reason behind the uneven pattern of snow in this region. Although water
body is increased only in the rainy season otherwise in average weather conditions, it
shows a lower amount of water in the river beds and its tributaries. By the change
detection matrix technique, a matrix table has been made to identify the changes in land
use pattern between 1990 to 2005, and 2005 to 2018. It is evident from the matrix table
that maximum change is notified in the wasteland from vegetation area is 152 sq. Km, 24
sq. Km of snow area is converted into vegetation cover, and 4 sq. Km area is from
vegetation to agriculture land (table 3). This transformation is due to policy implication
and support in horticulture, especially in apple orchards, hybrid seed nursery, and free
plant distribution from the state government of Himachal Pradesh. Vegetation cover is
high due to apple and other dry fruits orchards in the upper part of the district. The
economy of the Kinnaur is based on apple production, and changes in lifestyle are also
significant changes due to profit in it. People of Kinnaur are focusing on the production of
apple because of the high demand for ‘Kinnauri apple’ in the market; this economy is
changed from rural economy to a market-based economy and more profit gain.
Figure 6. Land Use/Land Cover change between 1990 to 2018. Source: Calculated by
author from LANDSAT imageries.
58Sustainability, Agri, Food and Environmental Research, (ISSN: 0719-3726), 9(1), 2021: 50-65
http://dx.doi.org/10.7770/safer-V0N0-art2161
Table 2. Land Use/Land Cover Change 1990-2018
Year 1990 2005 2018 Change Change Change
between between between
1990-2005 2005-2018 1990-2018
(%) (%) (%)
Land use Area % Area % Area %
Class (km) (km2) (km2)
Snow 515.2 20.6 439.0 17.5 624.9 25.0 -15 42.85 21
Water 2.3 0.2 1.0 0.1 9.2 0.4 -50 300 100
Agriculture 66.5 2.7 90.0 3.6 389.7 15.6 33.33 333 477
Built-up 3.4 0.1 7.6 0.3 16.2 0.6 200 100 500
Wasteland 1754.1 70.1 1626.3 65.0 1095.4 43.8 -7.27 -32.61 -37.51
Vegetation 161.8 6.4 339.4 13.5 367.9 14.7 110 8.88 129.68
Total 2503.3 100 2503.3 100 2503.3 100 00 00
00
Source: Calculated by Author from LANDSAT Imageries
Table 3. Land Use/ Land Cover Change Detection Matrix, 1990-2005
2005
LULC Built-up Snow Vegetation Water Wasteland Agriculture Total
CLASS
1 Built-up 3 0 0 0 0 0 3
9 Snow 0 432 24 0 58 0 515
9 Vegetation 3 1 154 0 0 4 162
0 Water 0 0 0 1 0 1 2
Wasteland 0 6 152 0 1568 28 1754
Agriculture 1 0 9 0 0 56 67
Total 8 439 339 1 1626 90
Source: Calculated by the author with the help of LANDSAT imageries.
It is evident from the LULC change detection that from 1990 to 2005 decreased
amount of snow, water and wasteland, in the middle and southern-east part of Kinnaur
district; it is also observed that unchanged area is scattered every part of the district which
shows the permanent vegetation in the form of dense forest, wasteland and snow on the
peak of mountain (figure 7). If we compare it with the change detection map of 2005 to
59Sustainability, Agri, Food and Environmental Research, (ISSN: 0719-3726), 9(1), 2021: 50-65
http://dx.doi.org/10.7770/safer-V0N0-art2161
2018, it is easily identified that unchanged area in the form of some snow, wasteland,
vegetation area and some settlement part in the river valley are maximum than the other
parts due to local phenomenon. Some increase area shows the horticulture and grasses
medicinal plants on alpine pasture on the upper part of the mountain. Increased area is
shows the agriculture land, and increase in the density of vegetation. Some decrease part
is the shows in the valley region which might be the result of reduce in vegetation due to
landslides, mass wasting in the result of tunnelling and road construction (figure 8).
Figure 7. Land Use/ Land Cover Change Detection of Kinnaur, 1990-2005. Source:
Prepared by the author with the help of LANDSAT imageries.
60Sustainability, Agri, Food and Environmental Research, (ISSN: 0719-3726), 9(1), 2021: 50-65
http://dx.doi.org/10.7770/safer-V0N0-art2161
Figure 8. Land Use/ Land Cover Change Detection of Kinnaur, 2005-2018. Source:
Prepared by the author with the help of LANDSAT imageries.
It has also been evident from the matrix table that during 2005 to 2018 about 36
sq. Km area changed into vegetation from wasteland, and 296 sq. Km from wasteland to
agriculture land (table 4). Reason behind the changes in snow cover is changes in
temperature and rainfall amount. This temperature changes resulted in increasing amount
of species of the medicinal and aromatic plants in this area. The monoculture of chir/chil
and chilgoza pine is also affected by the increasing horticulture land (Singh and Pandey
1995). In Sangla valley (Baspa Valley) high altitude villages like Batseri, Rakchham have
found apple orchards for the fulfilment of economically needs. Changes in land use pattern
are clearly evident in these areas. Kinnaur district has the highest electric production
among the other region of Himachal Pradesh; because it has many big and small HEP. The
natural ecosystem is degrading due to construction of the HEP in the district. Extreme
weather condition due to rise in temperature also harms the ecosystem. Activities like the
construction of the road in remote villages, towers for power supply, changes in lifestyle,
the encroachment of forest land for horticulture activities, and changing patterns of
agriculture in high altitude area have altered the trend in land use/land cover (Lambin et
al. 2001).
Status of changes in LULC pattern in Kinnaur: LULC change is a human-induced
activity by which land pattern is changed over a while. These dynamic changes have a
significant impact on the type of land use pattern associated with an ecological perspective
(Negi 2009). Increasing trend in population of this region show the pressure on the natural
resources which is increased in every census year (figure 9). From the formation of the
61Sustainability, Agri, Food and Environmental Research, (ISSN: 0719-3726), 9(1), 2021: 50-65
http://dx.doi.org/10.7770/safer-V0N0-art2161
district and till now, the area of land is limited but the population is significantly increased.
Kinnaur district scenic natural beauty attracts the foreign as well as a national tourist; it
is also situated on the way of Kaza (in Lahul-Spiti) which is renowned for its great
adventure in Zanskar range, and the isolation and bound with the natural beauty. In
ancient time it is a famous market for the travellers of Tibet. It also bordered with China
which is very important for the geostrategic point of view. Highway of this region is
strategically significant for the national security, and it leads to construction and widening
of roads. From Kinnaur, you traverse the route along Hindustan – Tibet Highway which is
commonly known NH-05 (previously known as NH-22) (Figure 10). These activities have
enough capacity to change the pattern of land use (Pandey 2011). Due to changes in land
use pattern habitat of many wild animals is shifted from the lower area to the upper cold
region, which leads to mal-adaptation for them. Activities, like road construction,
tunnelling for the HEP dam construction in the river, government officials building,
necessary amenities shops near the highways, mining activities in the highland area lead
to a high risk of environmental degradation (Figure 11).
Table 4. Land Use/Land Cover Change Detection Matrix, 2005-2018
2018
LULC Built-up Snow Vegetation Water Wasteland Agriculture Total
CLASS
2 Built-up 8 0 0 0 0 0 8
0 Snow 0 439 0 0 0 0 439
0 Vegetation 0 0 331 0 3 5 339
5 Water 0 0 0 1 0 0 1
Wasteland 9 186 36 8 1092 296 1626
Agriculture 0 0 0 0 0 90 90
Total 17 625 368 9 1095 390
Source: Calculated by the author with the help of the LANDSAT imageries.
Figure 9. Population of Kinnaur District from 1901 to 2011. Source: Census of India, 2011
62Sustainability, Agri, Food and Environmental Research, (ISSN: 0719-3726), 9(1), 2021: 50-65
http://dx.doi.org/10.7770/safer-V0N0-art2161
Figure 10. Road widening (Men at work) on NH-5 connect Shimla to Kaza via Kinnaur.
Source: Primary Survey, 2017.
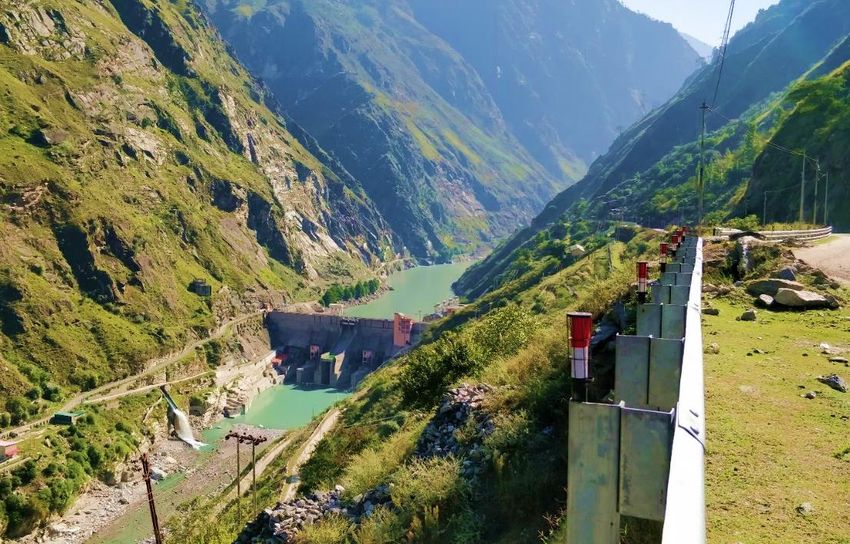
Figure 11. Shows the Nathpa Dam (Part of Nathpa Jhakari HEP) on Sutlej river in Nichar
Valley of Kinnaur Distrcit..Source: Primary Survey, 2017.
As conclusion, Himalayas are one of the youngest fold mountains and at the same
time it is highly densely inhabited in comparison to other mountain system, which makes
it more prone to exploitation through extreme anthropogenic activities, mainly because of
rapid changes in land-use patterns. Kinnaur, situated in Western Himalaya, has
constrained livelihood opportunities and the existing indigenous livelihood practices and
knowledge are adversely affected by continuous changes in the nature of land use/land
63Sustainability, Agri, Food and Environmental Research, (ISSN: 0719-3726), 9(1), 2021: 50-65
http://dx.doi.org/10.7770/safer-V0N0-art2161
cover. The described figures and tables represent the present condition of the district and
show an analogous study of the land-use pattern of the district for the few decades, i.e.
1990, 2005, and 2018. Findings clearly shows more pronounced increase in built-up land,
agriculture land, and vegetation including horticultural land. Recent development activities
in the district, merely started from 1990s to 2010, and this study give a brief glance about
the changing pattern of land use. Nevertheless, decreasing area of wasteland shows that
it is transformed into other land use pattern due to the pressure of increased population
and high reliance on natural resources. These changes cannot be neglected and are
evidence for the exploitation of groundwater explicitly in the form of springs as well.
Uncertain tunnelling has dried up the upper streams and moreover, the excessive point of
flow in the lower areas has negatively contributed in the changes of land use pattern in
the form of mass wasting and landslides. Adequate level of development activities is
essential for the well-being of human civilization and nation, but extreme and unbalanced
way of development has damaging impact on the essence of well-being of nation and its
citizen. Therefore, it is indispensable to have a sustainable development mechanism for
the fragile and endangered ecosystem. However, it can be only achieved by the
collaboration and the initiatives taken by the local government and Corporate Social
Responsibility (CSR). Additionally, the government agencies and global partners must be
involved into the improvement of the degraded land condition for further sustainability of
the region which directly contributes to provide good agriculture output and leads to
availability of quality foods and more livelihood option for the people of the region.
REFERENCES
Chawla, A., Kumar, A., Lal, B., Singh, R. D., & Thukral, A. K. 2012. Ecological
Characterization of High Altitude Himalayan Landscapes in the Upper Sutlej River
Watershed, Kinnaur, Himachal Pradesh, India. Journal of the Indian Society of
Remote Sensing, 40(3), 519-539.
Gupta, H. K. 2007. Deforestation and forest cover changes in the Himachal Himalaya,
India. International Journal of Ecology and Environmental Sciences, 33(2-3), 207-
218.
Kumar, A., Uniyal, S. K., & Singh, R. D. 2013. Land Use and Land Cover Patterns of Indian
Western Himalaya. Climate Change and its Ecological Implications for the Western
Himalaya, 49.
Lambin, E.F., Turner, B.L., Geist, H.J., Agbola, S.B., Angelsen, A., Bruce, J.W., Coomes,
O.T., Dirzo, R., Fischer, G., Folke, C. and George, P. 2001. The causes of land-
use and land-cover change: moving beyond the myths. Global environmental
change, 11(4), 261-269.
Lata, R., Rishi, S., Talwar, D., & Dolma, K. 2015. Comparative Study of Land Use Pattern
in the Hilly Area of Kinnaur district, Himachal Pradesh, India. International Journal
of Innovative Science, Engineering and Technology, 2(4), 559-565.
Mahmood, R., Pielke Sr, R.A., Hubbard, K.G., Niyogi, D., Bonan, G., Lawrence, P., McNider,
R., McAlpine, C., Etter, A., Gameda, S. and Qian, B. 2010. Impacts of land
use/land cover change on climate and future research priorities. Bulletin of the
American Meteorological Society, 91(1), 37-46.
Maurya, R. & Mishra, H. 2017. Impact Assessment of Cultivated Land and forest Products
on Livelihood Security of Tribal Community in Kinnaur District, Himachal Pradesh.
In V.S. Negi, B.W. Pandey, & Kumaria P. (Eds.), Whither Sustainable
64Sustainability, Agri, Food and Environmental Research, (ISSN: 0719-3726), 9(1), 2021: 50-65
http://dx.doi.org/10.7770/safer-V0N0-art2161
Development: Studies in Planning and Management of Land and Water Resources
(pp. 279-294). Research India Press.
Negi, S. P. 2009. Forest cover in Indian Himalayan states-An overview. Indian Journal of
Forestry, 32(1), 1-5.
Pandey, R., & Jha, S. 2012. Climate vulnerability index-measure of climate change
vulnerability to communities: a case of rural Lower Himalaya, India. Mitigation
and Adaptation Strategies for Global Change, 17(5), 487-506.
Pandey, R., Jha, S. K., Alatalo, J. M., Archie, K. M., & Gupta, A. K. 2017. Sustainable
livelihood framework-based indicators for assessing climate change vulnerability
and adaptation for Himalayan communities. Ecological indicators, 79, 338-346.
Pandey, B. W. 2011. In search of sustainability: global perspective on marginality,
technology, politics and planning of land use. Research India Press.
Pandey, B. W. (2002). Geoenvironmental Hazards in Himalaya: Assessment and Mapping.
Mittal Publication, New Delhi.
Prasad, A. S., Pandey, B. W., Leimgruber, W., & Kunwar, R. M. 2016. Mountain hazard
susceptibility and livelihood security in the upper catchment area of the river Beas,
Kullu Valley, Himachal Pradesh, India. Geoenvironmental Disasters, 3(1), 3.
Reid, R. S., Kruska, R. L., Muthui, N., Taye, A., Wotton, S., Wilson, C. J., & Mulatu, W.
2000. Land-use and land-cover dynamics in response to changes in climatic,
biological and socio-political forces: the case of southwestern Ethiopia. Landscape
Ecology, 15(4), 339-355.
Singh, K., Sharma, P. D., & Bhandari, A. R. 1992. Land capability classes and management
needs for sustained productivity in semi-arid regions of north-west
Himalayas (Vol. 2, pp. 51-57). Agropedology.
Singh, R. B. 1996. Remote Sensing and GIS Based Land Use Information System for
Natural Resource Monitoring and Management: The Indian Experience in
Proceedings of Int. In Workshop held at Ullan Bataar, Nagoya, UNCRD (pp. 99-
106).
Singh, R. B., & Pandey, B. W. 1995. Common resources and sustainable livelihoods of
mountain environments: A micro-level experience of Upper Kulu
Valley. Sustainable Reconstruction of Highland and Headwater Regions. Oxford
and IBH Publishing, New Delhi, 663-681.
Received: 31th March 2020; Accepted: 31th April 2020; Published: 01th Jule 2020.
65You can also read