Quantification And Characterization of Changes In Land Use Types In The Menoua Watershed Between 1974 And 2018 - ssrg-journals
←
→
Page content transcription
If your browser does not render page correctly, please read the page content below
SSRG International Journal of Geo-informatics and Geological Science Volume 8 Issue 2, 1-8, May-Aug, 2021
ISSN: 2393 – 9206 /doi:10.14445/23939206/IJGGS-V8I2P101 © 2021 Seventh Sense Research Group®

 Quantification And Characterization of Changes In
Land Use Types In The Menoua Watershed Between
 1974 And 2018
 Kouedjou Idriss Landry1; Ndjeuto Tchouli Prosper I.1; Tchotsoua Michel2
 1
 Ph.D student, Géomatic’s Labs, Géography Department, Universiy of Ngaoundéré, Cameroon
 2
 Titular Professor, Universiy of Ngaoundéré, Cameroon

 Received Date: 22 April 2021
 Revised Date: 29 May 2021
 Accepted Date: 31 May 2021

Abstract versants. Le présent travail se fixe ainsi, pour objectif, la
The state of land use plays a major role in triggering quantification et la caractérisation de l’occupation du sol du
hydrological processes at the plot or watershed level. Thus, bassin versant de la Menoua à partir des données
its study takes a place of choice in the knowledge of the satellitaires hautes et moyennes résolutions (Sentinel-2B et
hydrological functioning of the catchment areas. The Landsat TM). Pour y parvenir, la classification supervisée
objective of this work is to quantify and characterize the land par l’approche Orientée-objet, et la méthode de
use of the Menoua watershed using high and medium comparaison diachronique ont été mises à contribution.
resolution satellite data (Sentinel-2B and Landsat TM). To L’ensemble des opérations du traitement d’images a été
achieve this, supervised classification using the object- évalué au travers de l’indice Kappa largement utilisé dans la
oriented approach and the diachronic comparison method littérature pour évaluer la qualité des opérations de
were used. All the image processing operations were classifications. Le calcul de cet indice a révélé un taux de
evaluated through the Kappa index widely used in the classification de 97% pour l’année 2018 et de 89% pour
literature to evaluate the quality of classification operations. l’année 1978. Les résultats obtenus au terme du processus de
The calculation of this index revealed a classification rate of classification ont permis de caractériser l’évolution spatio-
97% for the year 2018 and 89% for the year 1978. The temporelle de l’occupation du sol dans le bassin versant de
results obtained at the end of the classification process made la Menoua pour la période de quarante ans (1978 à 2018).
it possible to characterize the spatio-temporal evolution of De l’analyse diachronique des images, il ressort que, pour le
land use in the Menoua watershed for the 40-year period pas de temps considéré, le taux global de changement est
(1978 to 2018). The diachronic analysis of the images shows négatif pour les formations végétales fermées (– 1,24%), et
that, for the time step considered, the overall rate of change respectivement de -0.99 % et -0.89 % pour la savane
is negative for closed vegetation formations (-1.24%), and - arbustive et la savane herbeuse. Par contre il est positif pour
0.99% and -0.89% for shrub savannah and grassy savannah les classes bâti (2,59%), agrosystème (1,28%) et sol nu
respectively. On the other hand, it is positive for the built (1,24%). De l’analyse globale de l’évolution spatio-
(2.59%), agrosystem (1.28%) and bare soil (1.24%) classes. temporelle, il ressort que, le bassin versant de la Menoua,
From the overall analysis of the spatio-temporal evolution, it connait une profonde anthropisation témoignant ainsi, de la
appears that the Menoua watershed is undergoing a forte empreinte de l’homme sur le milieu naturel, pouvant à
profound anthropization, thus testifying to the strong imprint un certain moment perturber l’équilibre dynamique de cet
of man on the natural environment, which may at some point écosystème de montagne.
disturb the dynamic balance of this mountain ecosystem.
 Mots clés: Dynamique, occupation du sol, images Sentinel-
Keywords: Dynamics, land cover, Sentinel-2B images,
 2B, approche orientée-objet, bassin versant de la Menoua.
object-oriented approach, Menoua watershed.
 INTRODUCTION
Résumé The state of the occupation plays a preponderant role in the
 L’état de l’occupation du sol joue un rôle triggering of hydrological processes at the plot or watershed
prépondérant dans le déclenchement des processus scale. Indeed, it conditions the processes of infiltration and
hydrologiques à l’échelle de la parcelle ou du bassin runoff of water, through the surface states (Chalier J-B,
versant. Ainsi, son étude revêt une place de choix dans la 2007). As such, its study or characterization has a place of
connaissance du fonctionnement hydrologique des bassins choice in the understanding of the hydrological functioning

 This is an open access article under the CC BY-NC-ND license (http://creativecommons.org/licenses/by-nc-nd/4.0/)
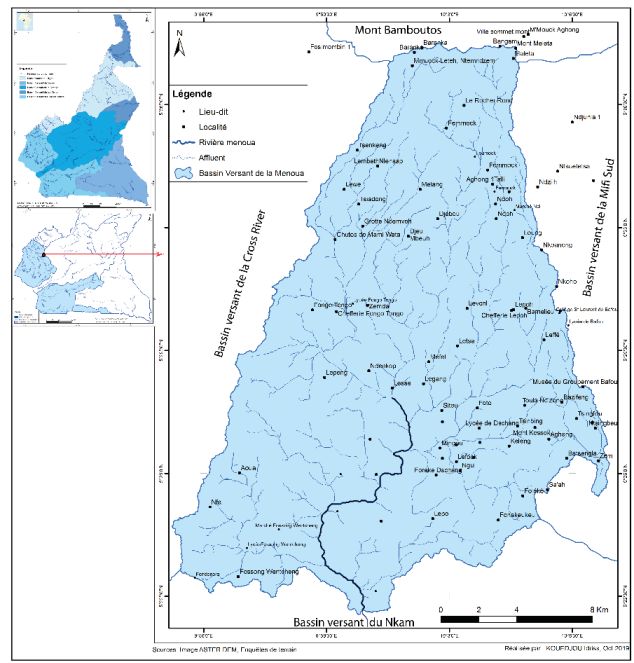
Kouedjou Idriss Landry et al. / IJGGS, 8(2), 1-8, 2021

of watersheds, but also for its development in general. In this
perspective, many studies have developed methods, means
and tools for its characterization. However, due to its
potential, remote sensing is more and more put forward for
its study, and this, since the launching of the first earth
observation satellites. This has been reinforced with the
advent of high spatial resolution satellites (HRS). In parallel
to this technological evolution, methods of processing data
from remote sensing have also undergone a notable
evolution. Thus, we have progressively moved from
undirected to directed classifications, from the pixel
approach to the object-oriented approach. The latter also
avoids the pitfalls of pixel-to-pixel classification and as such
has a better performance than pixel classification (Puech,
2004; Weih and Riggan, 2010). Although fairly recent, it has
already proven itself, in terms of the efficiency it has shown,
in numerous works (Maréchal, 2012). In line with this
perspective, the present study aims to quantify and
characterize the changes in land use in the Menoua
watershed between 1978 and 2018 using this new approach.

 I. METHODOLOGICAL APPROACH Fig. 1 Location of the study area
A. Study area B. Data
The Menoua watershed (Fig. 1), which is the subject of this Several data were mobilized for the present study. These are
study, covers an area of 395.62 km² and is located between geospatial data from various sources and of various types, as
9°56'0'' and 10°6'30'' East longitude and 5°22'0'' and 5°36'30'' well as GPS data.
North latitude. Located in the Western region of Cameroon,
it is part of the large hydrographic basin of the coastal rivers. Satellite data
It is an essentially mountainous basin, whose main activity is
agriculture, mainly because of the very fertile volcanic land For the realization of the present study, we used images from
in the area. Climatically, the ambient climate is a humid two sensors, namely
tropical mountain climate of the Cameroonian type, - The Sentinel 2B image
characterized by two (02) seasons. This climate, which is
influenced by the ocean, is characterized by a long rainy It was acquired in November 2018 from the Theia platform.
season lasting seven months (mid-March to October) and a The choice to focus on this image is justified because of their
short dry season lasting five months from November to mid- free access and characteristics very appreciable (10 m spatial
March. The rainy peaks are observed during the months of resolution for the visible bands).
August and September. On the human level, it is
characterized by a high human density, a fairly - Landsat TM (Thematic Mapper) images
heterogeneous population. The majority of the population is They allowed us to have information on the land cover for
made up of the Bamileke (indigenous people), the Fulani, the the year 1978. They are made of 07 spectral bands, with a
Babanki, the Tikar and the NSO. In addition, because of the resolution of 30 m for the visible bands. They have been
establishment of the University of Dschang, there are also downloaded from the Earth Explorer site at
people from all over the territory, but also from the rest of https://earthexplorer.usgs.gov/
the sub-region.
 The GPS data
 They were collected in the field with a GPS receiver. They
 are representative of the types of occupation detected in the
 field and were used to guide the choice of training plots and
 to validate the classification carried out.

 2
Kouedjou Idriss Landry et al. / IJGGS, 8(2), 1-8, 2021

C. Methodology for processing satellite data This approach combines two main processes: segmentation
 and classification.
a) Mapping of land cover types
 The characterization of the state of land use in the The segmentation of the image refers to the creation of
Menoua watershed was based on the satellite image segments that correspond to individual regions or groups of
classification process. To achieve this, certain preliminary image elements based on criteria of spectral and spatial
steps were taken. These operations, better known as image homogeneity. At the end of this operation, the pixels are
pre-processing, include everything from assembling the grouped into meaningful pixel groups. The objects thus
bands to creating the color compositions to extracting the formed contain not only the value and statistical information
study area. of the pixels with which they are constituted, but also include
 texture, shape and topological information in an attribute
1) The pre-processing operations of satellite images table (Hadjadj Mohamed, 2011). This process was done
Several operations were conducted in the process of pre- using the Ecognition software, and the algorithm chosen is
processing of these images to facilitate their subsequent use. the "multi resolution" segmentation because more used in the
These included the conversion of radiance values into literature (Pedro, 2007; Baatz and schape, 2000., Maréchal,
reflectance using Sen2Cor software, and then contrast op.cit., Baatz et al., 2004, Boon., Rochon, 1992). The
enhancement of the images for visual improvement and to parameters used for the segmentation are the following:
facilitate band analysis (Donnay, 2000). After these Scale: 50; Color: 0.9; Shape: 0.1; Regularity and
operations, we performed a combination of spectral bands; compactness: 0.5.
then an extraction of the study area and finally, colored
compositions in order to better discriminate objects and After this segmentation process, the next step is to create the
better visualize land use types. These last steps were carried thematic classes. Thus, 10 occupancy classes were defined
out using Erdas Imagine software. taking into account the field reality (Table 1).
 The classification process TABLE 1. THEMATIC CLASS DESCRIPTION
Classification is a process of sorting and grouping pixels of Thematic Class Description
an image, which allows to pass from satellite images to land Area crossed by the flames,
use maps. It consists in performing a correspondence Outcrop,
 where the exposure of the
between the elements of an image scene, generally burned, shaded
 bedrock can be observed
materialized by their radiometric values, and classes known a Plantation of cocoa and coffee
priori (or not) by a user (Kouedjou, 2015). Classification thus trees, combined with crops
aims at a cartographic representation as close as possible to Agrosystem such as palm trees, banana
reality from the spectral values of the pixels forming the trees and, in some places,
source image, and this, according to a previously defined sweet potatoes
nomenclature (Aoudou, 2010).
 All built-up areas (buildings,
 Built-up area
Choice of the classification method housing, paved roads)
To perform this operation, we chose the Object-Oriented Surface water River, lake
method. The choice of the object-oriented method used in Agro-pastoral Area of agricultural and
this study is justified by the spatial and spectral heterogeneity space livestock practices
of the landscapes or objects that make up this watershed.
Indeed, the interweaving of rural and urban landscapes Eucalyptus live
 plantations in the form of stand
characteristic of this watershed, and the diversity of spectral hedge and stand
 or live hedge
responses associated with them, explain this spatial and Eucalyptus
spectral heterogeneity. Given this complexity, the object- Uncovered land such as dirt
oriented approach appears to be the most appropriate, as Bare soil roads, stadiums or sand
opposed to the pixel approach. According to Boon and deposits
Rochon (1992), the interest of this type of classification lies Grassy
in the fact that it uses information based on the spectral Grass-dominated savannah
 savannah
characteristics of the pixels that make up the objects, but also
on information related to the geometry of the objects (size, Anthropogenic
structure, perimeter, orientation), the texture (arrangement Shrub-dominated savanna
 shrub savanna
and frequency of the variations in color within the object) or
the topology (neighborhood relationship). Plant formations consisting of
 Closed plant
 forest galleries, forest groves
 formations
 and sacred forests

 3
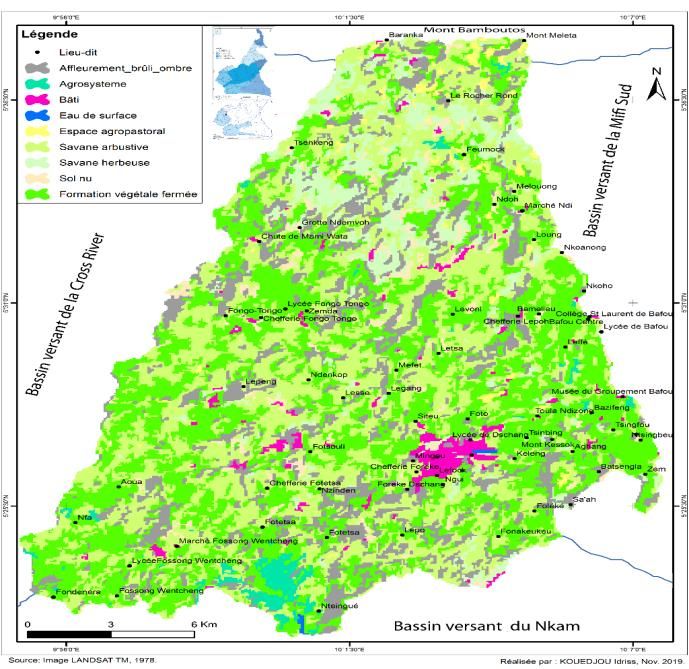
Kouedjou Idriss Landry et al. / IJGGS, 8(2), 1-8, 2021

b) Post classification The overall average accuracy for all years is 0.91.
After having carried out the classification, the next step is to The accuracy of the 1978 classification is the least accurate
evaluate the accuracy of the classification in order to validate (0.86) and is probably due to the poor quality of the images
it. This validation was done through the ground truth and the used. While, for the year 2018, it is 0.97 which is justified by
kappa index. This is an index used in remote sensing and the use of Sentinel 2B images, having not only a better
allows to estimate the accuracy of a classification (Anonyme spatial resolution, but also spectral. According to Pontius
2013, Anaba 2010). (2000) cited by Anaba (op.cit.), in a study of land use, when
 the Kappa index evaluated is above 75% as in this case, the
 Once the validation is done, the raster file obtained classification is very good.
at the end of the classification is converted into vector for
better handling, and then imported into a GIS software to be b) Land use status for 1978 and 2018
able to perform the dressing in order to pass from a sketch to The land use status analysis was based on maps
a map. This step is followed by the export of the showing the land use status of the study area for each of the
classification result in vector form in a GIS software. years 1978 and 2018. The surface area of each type of land
 use is presented and compared to the total surface area of the
 study area for each year. Then, a summary table presenting
D. Quantifying the rates of change the evolution of these areas by land use class for the different
 The study of the dynamics allows to have a clear dates is produced.
apprehension of the different trends in the landscape
transformation processes. And to achieve this, it is necessary 1) The state of land use in 1978
to quantify the rate of change between the areas of the land The state of land use in the Menoua watershed in 1978 is
use classes for the considered time limit. For this purpose, shown in Fig. 2.
two (02) equations were used, namely: the equation proposed
by FAO (1990) for the calculation of the global rate of
change (Tg) and by Bernier (1992) for the calculation of the
average annual rate of change (Tc). These formulas are as
follows:
 − −
 =
 ∗ = ( − )∗
 ∗

With : S1: the area of a surface unit class at date t1
 S2 : the surface of the same class of surface unit at
date t2
 Tg : the overall rate of change and Tc the average
annual rate of change
 Ln: the neperian logarithm; e the base of neperian
logarithms (e= 2.71828)

RESULTS
a) Evaluation of classification accuracy
The accuracy of the classification operations performed for
the defined dates was evaluated using the Kappa index as
mentioned above. However it is necessary to remember that Fig. 2 Land use map for the year 1978
the accuracy for each date is a function of the quality of the
images used which explains the variations observed in table The analysis of Fig. 2. shows that the state of land
(2). use for the year 1978 is characterized by a preponderance of
 the physical elements of the environment distributed as
 TABLE 2. VALUE OF THE KAPPA INDEX FOR THE shown in figure 3. From this figure, the observation that
 YEARS 1978 AND 2018 emerges is that the landscape in 1978 was dominated by
 natural vegetation formations with a preponderance of closed
 Years Kappa index vegetation formations (33%) while surface water represents
 1978 0,86 less than 1% (0.09%).
 2018 0,97
 Source: GIS database

 4
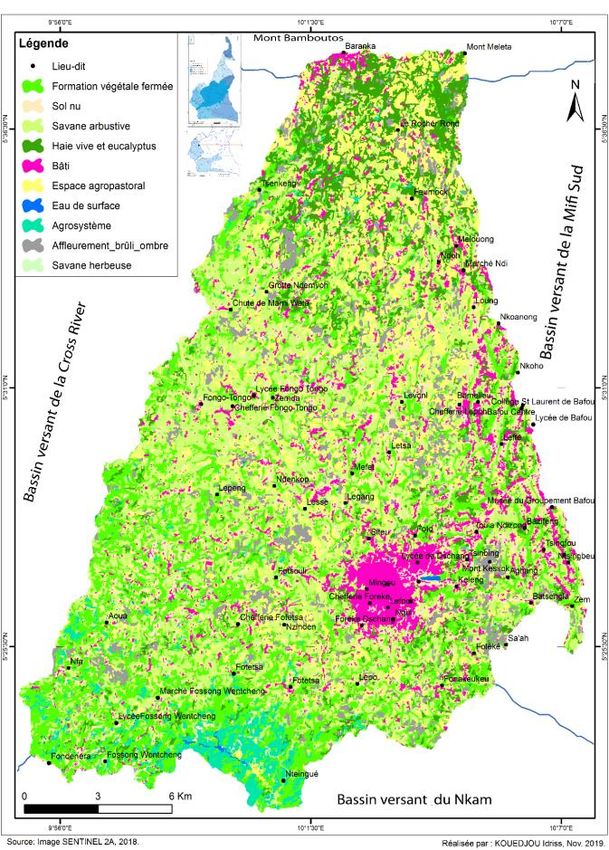
Kouedjou Idriss Landry et al. / IJGGS, 8(2), 1-8, 2021

 Outcrop, Agrosyste Built-up 2) Status of land use in 2018
 burned,
 % Figure 4 obtained following the processing of the Sentinel
 m area
 Closed shaded 2B image, shows the state of land use in the Menoua
 3% 3%
 plant 9% watershed for the year 2018.
 formations Surface
 33% water
 0%
 Bare soil Agro-
 Anthropog pastoral
 4%
 Grassy enic shrub space
 savannah savanna 7%
 10% 31%

 Source: GIS database, 2019
Fig. 3 Distribution of different land use types in 1978
 The concomitant analysis of figures 2 and 3 shows
that, agrosystems are concentrated in the south and west of
the watershed. They cover an area of 12,372 km2, or 3.10%
of the total area. As for the built-up area, it is found mainly
in the southeast of the watershed, in the county seat. A
structuring element of the anthropic landscape, it represents
approximately 4% of the total area of the watershed at this
date. The agropastoral space covers an area of 25.75 km ² or
6.46% of the total area of the study area. These areas are
spread over all the topographic units of the basin. As for
plant formations, they represent the dominant element of the
landscape, are made up of shrub savannah, grassy savannah,
and closed plant formations.
 A remnant of a once existing montane forest, as well
as a wooded savanna, the shrub savanna remains only in
places, although it bears the traces of human activity. Very
dense in the western part of the watershed, it is increasingly
scattered over the rest of the watershed. It occupies nearly
124 km² of the watershed and represents 31% of the area. It
is characterized by Pennisetum purpureum, Terminalia sp, Fig. 4 Map of land use in 2018
Albizia gummifera, ... As for the grassy savannah, it occupies
 The analysis of the state of land use in 2018, shows
an area of 40 km ² and represents 10.11% of the total area of that, it is characterized by agrosystems that 5% of the total
the watershed. Sometimes used as a grazing area by area of the watershed and are concentrated mainly in the
pastoralists, it is found mainly on the peaks and slopes. It is south of the watershed closest to its outlet. In addition to this
characterized by species such as Sporobolus, Imperata
 element, we have the built. It represents 9% of the total area
cylindrica, Pennisetum purpureum, Melinis minutiflora, and of the basin and presents several physiognomies. Much more
Hyparrhenia, ... In most places it bears traces of overgrazing concentrated in the South-East of the basin it presents a
activity and is sometimes presented in the form of a "terrace" grouped form. It is also found in the north of the watershed,
due to the importance of cattle activity. In some places it is
 but in a more dispersed manner. As a whole, it presents a
regularly burned to renew the grass. As for the closed plant
 mixed form, we find constructions in definitive, semi-
formations, they cover a larger part of the basin, i.e. 131 km², definitive and temporary materials. Its development has been
and represent 33% of the total area. Mainly made up of
 greatly influenced by the establishment of the University of
raffia, Chinese bamboo and certain forest species, they are Dschang, the main university structure in the entire western
found in narrow valleys, in sacred forests and in forest region. In addition to this element, we have the agropastoral
reserves. Their existence is still made possible by their
 space. It is found scattered throughout the watershed,
inaccessibility or the sacred nature of certain sites.
 although pastoral activity is much more concentrated
 upstream of the basin, on the peaks and sides of the
 mountains. This is to reduce agropastoral conflicts. This area
 covers 15% of the total surface of the watershed.

 5
Kouedjou Idriss Landry et al. / IJGGS, 8(2), 1-8, 2021

 The land use in 2018 is also characterized by closed TABLE 4. BALANCE OF LAND USE CHANGE
vegetation formations that represent the 17% of the total BETWEEN 1978 AND 2018
surface of the basin. Some of them still exist today, due to
the sacred nature of some sites and the inaccessibility linked Area (1978) Area (2018)
to the steep slopes. In addition to these closed plant Land use class
 km² % km² %
formations, we have the living hedges and stands of
 Outcrop, burned,
eucalyptus. They include mainly the eucalyptus stands shaded 34,7232 8,71 26,68 6,76
arranged either in the form of lines used to delimit
agricultural plots and those organized in the form of groves. Agrosystem 12,372 3,10 20,66 5,18
At this date, they represent 6% and are located mainly Built-up area 13,7812 3,46 38,90 9,76
upstream of the watershed. Table 3 summarizes the land use
 Surface water 0,3456 0,09 0,77 0,20
data for the study period.
 Agropastoral area 25,7504 6,46 70,76 17,75
 TABLE 3. AREA OF LAND USE CLASSES IN 2018. Anthropogenic shrub
 savanna 124,11 31,14 83,53 20,96
Class Area (km²) %
 Grassy savannah 40,3052 10,11 28,23 7,08
Outcrop, burned, shaded 26,68 6,69
 Bare soil 15,2844 3,84 25,08 6,29
Agrosystem 20,66 5,18 Closed plant
Built-up area 38,9 9,76 formations 131,868 33,09 80,24 20,13
Surface water 0,77 Eucalyptus live hedge
 0,19
 and stand Eucalyptus - - 23,69 5,94
Agro-pastoral space 70,76 17,75 Source: GIS database
Eucalyptus live hedge and stand
 23,69 Examination of this table shows that two (02) main
Eucalyptus 5,94
Anthropogenic shrub savanna 83,53 trends emerge. The first trend is largely regression or
 20,96
 degradation of open and closed vegetation formations, which
Grassy savannah 28,23 7,08 have declined considerably, with the greatest loss of 50 km²
Bare soil 25,08 6,29 for closed vegetation formations (Figure 5). These closed
 vegetation formations are converted into savannah
Closed plant formations 80,24 20,13 formations, either agrosystems, eucalyptus stands or
 398,54 100 agropastoral areas.
 Source: GIS database
 60.00
 Analysis of table 3 shows that overall, land use is
largely dominated by natural vegetation formations, which 40.00
represent 192 km² or approximately 49%. However, it is
necessary to recall that in this area, in addition to the sacred 20.00
 Area in km2

forests, other vegetation formations bear traces of
exploitation by man and as such, there are no longer natural 0.00
vegetation formations in the strict sense of the term. Next are
the anthropized surfaces (buildings, agro-pastoral areas, -20.00
agrosystems), which represent 33% of the area, or 130.32
km². Anthropogenic plant formations such as stands of -40.00
Eucalyptus, although important, represent only 6% of the
area. Finally, surface water and bare soil appear in a scattered -60.00
but not negligible way. They represent 6, 53% of the total
area. As for surface water, the communal lake of Dschang
 Source: GIS database, 2019
and the Menoua River in its downstream part near the outlet
of the watershed represent it. Fig. 5 Loss and gain of land cover areas between 1978
 and 2018.
c) Summary of land cover changes between 1978 and 2018
 Table 4 and figure 5 present the balance of the The second trend is that of progression. It concerns classes
evolution of the surface states between 1978 and 2018, i.e. a such as built-up areas, agrosystems, agropastoral areas and
period of 40 years. They present respectively the surface bare soil, which will be analyzed in the following lines.
areas of the surface states at different dates and the variations
of these areas during the same period.

 6
Kouedjou Idriss Landry et al. / IJGGS, 8(2), 1-8, 2021

 The built-up area has been extended by more than Tc and Tg values over the last four (4) decades. This increase
20 km². This extension has been to the detriment of natural is also noticeable for the "agrosystem", "bare soil" and
areas and agro-pastoral areas located on the outskirts of the "hedge and eucalyptus" classes (Figure 13). On the other
old city core. This has resulted in the destruction of plant hand, savannahs and closed vegetation formations have
formations. In addition to the built-up area, the eucalyptus experienced a significant regression of 2% on average.
stands have also increased by almost 20 km² over the last 40
years. The increase in the area occupied by these stands was E. DISCUSSIONS
favored by SONEL (National Electricity Company) which The land cover maps obtained from the directed
used them as a physical support for electrification (electric classification of Landsat TM and Sentinel 2B images, using
poles), by the FNFP (National Forest and Fish Fund), by the object-oriented method, allow us to highlight the changes
ONAREF (National Office for Forest Regeneration) and by in land cover types in the Menoua watershed between 1978
Cameroon Tea Estates (C.T.E) of Djuttitsa. Their extension and 2018. Given the overall accuracy (0.86) for the Landsat
is also justified by their high regeneration capacity and image and 0.97 for the Sentinel 2B image, this classification
because of the multiple uses made by the populations. can be valid according to Pontius' recommendations. The
 supervised classification method via the object-oriented
d) Summary of the evolution of the rate of change between approach used in this study is one of the most recent and
1978 and 2018 widely used methodologies for mapping land cover types.
Table 5, which summarizes the rates of change in land use Indeed, this method gives better results than the usual pixel-
between 1978 and 2018, presents a rather mixed picture with based approach (Wilhauck, 2000; Kagamata et al., 2005;
an average of 1.38%. Maréchal, 2011). However, the quality of these results
TABLE 5. AREA AND RATE OF CHANGE OF remains strongly dependent on the nature of the geospatial
OCCUPANCY CLASSES BETWEEN 1978 AND 2018. data used.
 From the analysis of the results obtained at the end of the
 Land use Area en km² TC Tg classification process, it appears that the dynamics of the
 class (%) (%) natural environment in the Menoua watershed is regressive
 1978 2018
 on the whole. The overall rate of change shows that the
 Outcrop, regressions concern mainly natural plant formations. Even if
 burned, - in some places, we observe a relative stability of some of
 shaded 34,72 26,68 -23,17 0,66 them, due to their sacred character. In addition, an in-depth
 analysis of the maps shows that the most important dynamics
 Agrosystem 12,37 20,66 66,95 1,28 are observed around urban centers and along communication
 routes. This observation is consistent with that made by
 Built-up area 13,78 38,90 182,25 2,59 many authors, such as Tchotsoua (2006) in Central
 Surface water 0,35 0,77 123,55 2,01 Adamaoua, Anaba et al (2019) in the upper watershed of the
 Agro-pastoral Bini, and Koffi Djagnikpo Kpedenou et al (2016) in the
 space 25,75 70,76 174,79 2,53 prefecture of Yoto (southeast Togo), as well as by Mama et
 Anthropogenic - al (2003).
 shrub savanna 124,11 83,53 -32,70 0,99 The artificialization of this natural environment is mainly
 Grassy - due to the significant demographic growth observed after the
 savannah 40,31 28,23 -29,96 0,89 economic crisis of 1985 (Kaffo, 2000; Kamga, 2002), but
 also due to the creation of the University of Dschang in
 Bare soil 15,28 25,08 64,11 1,24 1993. Indeed, the population of this commune increased
 Closed plant - from 17814 inhabitants in 1976 to 35717 in 1987 and then to
 formations 131,87 80,24 -39,15 1,24 63838 in 2005 (RGPH 1976, 1987, 2005). This demographic
 Eucalyptus growth has resulted in an increase in built-up areas, an
 live hedge and increase in construction materials, new mouths to feed, and
 stand above all an increase in the need for wood energy taken
 Eucalyptus 23,69 7,91 directly from the natural environment. Several authors have
 also identified these factors as being responsible for the
 degradation of the natural environment. These authors
 Tc: average annual rate of spatial expansion; Tg:
 include Lavigne (2001); André et al, (2001); Tchotsoua et al,
 overall rate of change. (2010); Tchotsoua (2006), Aoudou (1999), Anaba (2011,
 Source: GIS database analysis, 2019 2019). It should be noted, however, that tradition contributes
 to the preservation of certain natural landscapes, such as
 From the analysis of table 5, it emerges that the "built" sacred places, which are true refuges for species and, as such,
and "agro-pastoral space" classes are those with the highest contribute to their preservation.

 7
Kouedjou Idriss Landry et al. / IJGGS, 8(2), 1-8, 2021

 CONCLUSION [9] F. Bonn and G. Rochon, Précis de télédétection Volume 1: Principes
 et Méthodes, Presses de l’Université du Québec/AUPELF, 1992
 The objective of this study was to conduct a diachronic [10] J. P. Donnay, Les spartiocartes en composition colorée,” Bulletin de
analysis of the evolution of land use types in the Menoua la Société Géographique de Liège, Belgique: (2000) 43-61.
watershed over a 40-year period (1978-2018). To achieve [11] FAO, Forest resources assessment. Survey of tropical forest
this goal, remote sensing and Geographic Information cover.1990, Forestry Paper, 130
 [12] Fethi Mohamed. Hadjadj, Apport des SIG et des images satellites
Systems were used to analyze the land use status. The
 pour la cartographie numérique de la forêt du Chettabah (Wilaya de
supervised classifications of Landsat TM and Sentinel 2B Constantine) (Modélisation climatique et classification), Mémoire de
images have allowed to highlight the state of land use for the master, 2011.
years 1978 and 2018 respectively. From the analysis of these [13] C. Kaffo, Développement du maraichage d’altitude et marché foncier
 dans les monts Bamboutos. Déprise caféière et mutations
maps, it appears that the Menoua watershed is characterized
 socioéconomiques sur les hautes terres de l’Ouest Cameroun,
by a regressive dynamic of its natural landscapes. Natural Geodoc; 51(2000) 24-42.
vegetation formations are those that have been most [14] A. Kamga, Crise économique, retour des migrants, et évolution du
impacted and are gradually being replaced by agrosystems, système agraire sur le versant oriental et méridional des monts
 Bamboutos (Ouest-Cameroun), Thèse de doctorat d’études rurales,
eucalyptus stands and agricultural areas. Close to urban
 Université de Toulouse Le-Mirail, 2002
centers, they are under assault by populations for various [15] K. Koffi Djagnikpo, Tchaa Boukpessi, K. Thiou and Tanzidani
reasons (need for building space, need for wood energy). As Tchamie, Quantification des changements de l’occupation du sol dans
such, urban growth translated spatially by urbanization la prefecture de yoto (sudest togo) à l’aide de l’imagerie satellitaire
 landsat, Revue des Sciences de l’Environnement, Laboratoire de
remains the main factor responsible for the erosion of these Recherches Biogéographiques et d’Etudes Environnementales
natural landscapes in the Menoua watershed. (Université de Lomé), (2016) 137-156.
 [16] L. Idriss Kouedjou, Évaluation de la capacité de séquestration du
 REFERENCES carbone des formations végétales fermées dans les Départements de
[1] R. C. Banimb Anaba, Cartographie et analyse des types d’occupation la Vina et du Mbéré. Mémoire de master 2. Univ. De Ngaoundéré.
 du sol dans la commune d’arrondissement de Ngaoundéré troisième. Cameroun, 2015.
 Mémoire master 2, FALSH, Ngoundéré, Cameroun. 2010. [17] F. Lavigne, Le paradoxe d’une montagne tropicale volcanique:
[2] R. C. Banimb Anaba, S. Doua Aoudou, I. Prosper Ndjeuto Tchouli., surpeuplement et risques naturels sur le volcan Merapi; Javina,
 and M. Tchotsoua, Pression urbaine, agriculture, élevage bovin et Indonésie. In Bart F., Morin S., Salomon J N (dir.). Les montagnes
 dynamique spatiale des formations forestières marginales: cas du haut tropicales: identités, mutations, développement. 2001, Talences
 bassin versant de la Bini (Région de l’Adamaoua au Cameroun), Rev. DYMSET (espaces tropicaux n°16), 670
 Int. géomat. Aménage. Gest. ressour. 5 (2019) 10- 29. [18] A.Mama, B.Sinsin, C. De Canniere and J. Bogaert, Anthropisation et
[3] V.André, G.Pestana, and G. Rossi 2001. Agropastoralisme du milieu dynamisation des paysages en zone soudanienne au nord du Bénin,
 dans le Fouta Djalon (Guinée) des mythes aux réalités. In : Bart F., Tropicultura, 31(1) (2013) 78-88.
 Morin S., Salomon J N. (dir.). Les montagnes tropicales: identités, [19] J. Maréchal., Caractérisation de la dynamique d’occupation du sol de
 mutations, développement. Talences DYMSET (espaces tropicaux la ville de Kisangani (R.D. Congo) et sa périphérie entre 2002 et
 n°16). 205-210. 2010, Mémoire de Master. Université de Liège. 2012.
[4] Anonyme, Génération d’une couverture de sol à partir d’une image [20] J.R. Pontius, Quantification error versus location incomparison of
 satellitale, 2013. 30 p. categorical maps, Photogrammetric Engineering and Remote Sensing,
[5] S. Doua Aoudou, Suivi de l’évolution de la végétation ligneuse de la 66(8) (2000) 1011–1016.
 savane soudanienne dans la haute vallée de la Bénoué au Nord [21] M. Tchotsoua, Évolution récente des territoires de l’Adamaoua
 Cameroun,. Thèse de doctorat, Univ. De Ngaoundéré, Cameroun. central. De la spatialisation à l’aide pour un développement maîtrisé.
 2010. Mémoire inédit pour l’Habilitation à Diriger des Recherches, 2006.
[6] S. Doua Aoudou., Analyse diachronique de l’évolution du couvert [22] M. Tchotsoua and B. Gonne, Des crises socioéconomiques aux crises
 ligneux sur le plateau de Ngaoundéré (1951-1999): le cas des bassins environnementales sur les hautes terres de l’Adamaoua (Cameroun),
 versants de Mbidjoro et Taparé. Mémoire de maîtrise, Université de In Savanes africaines en développement :innover pour durer. Garoua,
 Ngaoundéré, Cameroun, 1999. Cameroun (2009), 2010, Actes du colloque organisé à Garoua
[7] M. Baatz, and A. Schâpe, Multiresolution segmentation: an (Cameroun), 268
 optimization approach for hight quality multi-scale image [23] R. C. Weih, N. D. Riggan, Object-based classification vs. pixel-based
 segmentation, In Strobl T: Angewandte Geographische Informations classification: comparative importance of multi-resolution imagery,
 verarbeitung XII. Beiträge zum AGIT-Symposium Salzburg, 2000. Remote Sensing and Spatial Information Sciences, XXXVIII, 2010
 Verlag: p 321
[8] B. Bernier, Introduction à la macroéconomie. Dunod, Paris, France,
 1992.

 8
You can also read