NAA GEOPHYSICAL SURVEY - WHINFIELD SOLAR FARM COUNTY DURHAM PHASE 2 NAA 21/28 April 2021
←
→
Page content transcription
If your browser does not render page correctly, please read the page content below
NAA
 GEOPHYSICAL SURVEY

WHINFIELD SOLAR FARM
   COUNTY DURHAM
          PHASE 2

        prepared for
Arcus Consultancy Services Ltd

         NAA 21/28
         April 2021
Northern 01833 690800
info@naaheritage.com
Archaeological www.naaheritage.com
Marwood House
Associates Harmire Enterprise Park
Barnard Castle
Co. Durham
DL12 8BN
QUALITY ASSURANCE
Project Number 2089
Report Number 21-28
Manager Alice James
Edit AD Crowson
Authorised Alice James
Issue 1 22-04-2021
Disclaimer
This document has been prepared in good faith on the basis of information available at the date of publication without any independent
verification for the exclusive use and benefit of the named client and for the sole purpose for which it is provided. Northern Archaeological
Associates does not guarantee the accuracy, reliability, completeness, or currency of the content of this document nor its usefulness in
achieving any purpose. This document is not intended to nor should it be relied upon by any third party. Northern Archaeological
Associates accepts no responsibility nor liability should this document be used for any alternative purpose other than for which it is
intended nor to any third party. Northern Archaeological Associates will not be liable for any loss, damage, cost, or expense incurred or
arising by reason of any person using or relying on information in this document.
Author Alice James
Illustrations Alice James
Client Arcus Consultancy Services Ltd
Location Whinfield House Farm, Co. Durham, DL1 3LE
District County Durham
Grid reference NZ 50227 13690
Fieldwork date 12th to 16th April 2021
Site staff Oskar Sveinbjarnarson and Kate Chapman
OASIS Number Northern1-420120
© Northern Archaeological Associates 2021, all rights reservedWHINFIELD SOLAR FARM, CO. DURHAM, PHASE 2
GEOPHYSICAL SURVEY REPORT
TABLE OF CONTENTS
1.0 Introduction 1
2.0 Location, topography and geology 1
3.0 Archaeological and historical background 2
4.0 Aims and objectives 3
5.0 Methodology 3
6.0 Results 4
7.0 Conclusions 7
References 9
Appendix A: Technical information 11
Appendix B: Data processing information 13
Appendix C: Data visualisation information 14
FIGURE LIST
Figure 1: site location
Figure 2: location of geophysics survey area
Figure 3: unprocessed greyscale plots of gradiometer survey results – Phases 1 and 2
Figure 4: processed plots of gradiometer survey results – Phase 1 and 2
Figure 5: interpretation of gradiometer survey results – Phase 1 and 2
Figure 6: processed plots of gradiometer survey results – Areas C
Figure 7: interpretation of gradiometer survey results – Areas C
Figure 8: processed plots of gradiometer survey results – Area E
Figure 9: interpretation of gradiometer survey results – Area E
Figure 10: processed plots of gradiometer survey results – Area I
Figure 11: interpretation of gradiometer survey results – Area I
Disclaimer
The results of geophysical survey may not reveal all potential archaeology and do not provide a comprehensive map
of the sub-surface, but only responses relative to the environment. Geological, agricultural and modern responses
may mask archaeological features. Short-lived features may not give strong responses. Only clear features have been
interpreted and discussed in this report.WHINFIELD SOLAR FARM, CO. DURHAM, PHASE 2
GEOPHYSICAL SURVEY REPORT
Summary
Northern Archaeological Associates (NAA) was commissioned by Arcus Consultancy Services
to undertake a second phase of geophysical (gradiometer) survey of land surrounding
Whinfield House Farm, Co. Durham, in advance of a solar farm development (NGR: NZ 30293
22634).
The first phase of geophysical survey was undertaken in February 2021 and targeted six fields
(totalling c. 27ha) surrounding Whinfield Farm. The results of the survey identified several
linear and rectilinear anomalies to the west and south of the Whinfield Farm that were
tentatively interpreted as potentially belonging to a former enclosure system. Otherwise,
anomalies were considered to relate to agricultural activity (including ridge and furrow and
former field boundaries), modern features, or were of a geological or unknown origin (NAA
2021).
The second phase of geophysical survey was carried out between 12th and 16th April 2021
and covered three fields totalling c.13ha in which ground conditions were not conducive to
survey during the first phase of works. No anomalies were identified that were considered
likely to relate to archaeological deposits. Several linear anomalies, plausibly caused by infilled
features were identified in Area C, and linear anomalies and trends were identified in Area I
that are likely to be caused by an infilled stream. Other weak and diffuse trends and
amorphous anomalies of an unknown origin were identified across the survey area. Several
regimes of ridge and furrow were also identified as well as a diffuse linear anomaly that
possibly denotes a former field boundary. Otherwise, anomalies were considered to be of
agricultural or modern in nature.Whinfield Solar Farm, County Durham, Phase 2: Geophysical Survey
1.0 INTRODUCTION
1.1 Northern Archaeological Associates (NAA) was commissioned by Arcus Consultancy
Services to undertake a second phase of geophysical (gradiometer) survey of c.13ha of
land surrounding Whinfield House Farm, Co. Durham, in advance of a solar farm
development (NZ 30293 22634; Fig. 1). The first phase of geophysical survey was
undertaken in February 2021 and targeted six fields (totalling c. 27ha) surrounding
Whinfield Farm. The second phase of survey works targeted three areas (totalling
c.13ha) in which ground conditions were previously unsuitable (including heavily
ploughed soil) and so could not be surveyed.
1.2 This report details the setting (location, topography, geology), archaeological
background and survey results for the second phase of survey works and should be
used in conjunction with the report summarising the results of the first phase of survey
works (NAA 2021).
1.3 Interpretation of the geophysical survey was achieved through the analysis of
identified anomalies and was aided by a rapid examination of supporting information.
The results of the geophysical survey are discussed below and the interpretations are
supported by appropriate illustrations. Where feasible, a detailed synopsis of
anomalies is provided and, if possible, the features that the anomalies are likely to
relate to are suggested.
2.0 LOCATION, TOPOGRAPHY AND GEOLOGY
Location and land use
2.1 The proposed development area (PDA) comprises three fields surrounding Whinfield
House Farm (totalling c.13ha) within rural land east of Aycliffe Village in Co. Durham
(Fig. 2 – Areas C, E and I).
2.2 All areas within the PDA are bordered by agricultural land. Ricknall Lane runs to the
east and north of Area C, and Lime Lane is located to the north of Area C.
Topography
2.3 The topography of the PDA is generally level with a slight rise in the centre along Lime
Lane. The lowest point is in the north-east of Area E and is at 87m above Ordnance
Datum (aOD), while the highest point is in the south of Area I and is recorded at 97m
aOD.
© Northern Archaeological Associates for Arcus Consultancy Services
1Whinfield Solar Farm, County Durham, Phase 2: Geophysical Survey
Geology and soils
2.4 The geology is composed of Sherwood Sandstone Group. Superficial deposits in the
east of the PDA comprise clay, sand and gravels of the Vale of York Formation.
Alluvium and river terrace deposits of sand and gravel are present in the centre of the
site, and Devensian till is in the west of the PDA (BGS 2021).
2.5 The soils in the east of the PDA are mapped as being of the Crewe Association,
consisting of stagnogley soils in reddish, stoneless till or lacustrine clay (Soil Survey of
England and Wales 1983; Jarvis et al. 1984, 145). The soils in the west of the PDA
comprise Duneswick Association, which is dominated by stagnogley soils in greyish
brown drift derived from carboniferous rocks, Jurassic and Triassic sandstone and
occasional limestone (Soil Survey of England and Wales 1983; Jarvis et al. 1984, 165).
3.0 ARCHAEOLOGICAL AND HISTORICAL BACKGROUND
3.1 The following section provides a short summary of information available at the time
this report was prepared including a desk-based assessment by Arcus (2021) and the
first phase of geophysical survey (NAA 2021).
3.2 There are no listed buildings or scheduled monuments within the direct environs of
the PDA. A scheduled deserted medieval village is located c.1km north of the PDA at
Preston-le-Skerne and the Grade II listed post-medieval Preston Lodge Farmhouse and
outbuilding are located c.0.8km to the east of the PDA. Fourteen non-designated
heritage assets associated with medieval and post-medieval agricultural activity have
been recorded as cropmarks on aerial photographs.
3.3 Historic maps show that the PDA has consisted of rural fields centred on Whinfield
Farm since at least the mid-19th century. The First Edition 1858 Ordnance Survey (OS)
map records a former trackway running east–west across Area H (see Fig. 2 for Areas).
Area B is shown to contain woodland and a trackway until the mid-20th century.
Nineteenth-century maps record the presence and growth of Preston Brick and Tile
Works and associated clay pit, which were located directly to the north of the PDA
until they fell out of use at the turn of the 20th century. On the 1923 OS map, the
Preston Brick and Tile Works is labelled as disused.
3.4 Geophysical survey was undertaken across six fields (totalling c.27ha) surrounding
Whinfield Farm in February 2021. Several linear and rectilinear anomalies were
© Northern Archaeological Associates Arcus Consultancy Services
2Whinfield Solar Farm, County Durham, Phase 2: Geophysical Survey
identified in the south and west of the PDA that were postulated as potentially
denoting a former enclosure system. Other linear anomalies and trends were
identified across the survey area, but were composed of weak increases in magnetic
value or incomplete patterning and so their origin is unknown. Several phases of ridge
and furrow were identified across the survey area, as well as evidence of modern
ploughing and land drains demonstrating that the site is likely to have been
agricultural land since at least the medieval period. There has been little change to the
composition of the PDA since the mid-19th century: former field boundaries,
trackways and a possible stream recorded on the 1858 OS map appeared within the
survey results, as well as a possible trackway that is not depicted on historic maps.
Numerous bipolar anomalies were identified that relate to buried utilities, pylons
carrying overhead power lines and ferrous objects within or in the periphery of the
areas surveyed.
4.0 AIMS AND OBJECTIVES
4.1 The aim of the geophysical survey was to map and record potential buried features
located within the PDA. Through analysis of the results of the geophysical survey, NAA
aimed to provide a detailed interpretation of the archaeological potential of the site
that will inform subsequent archaeological mitigation strategies.
4.2 The objectives of the survey were to:
x undertake a geophysical survey across areas deemed suitable for data collection
within the PDA;
x attempt to identify, record and where possible characterise any subsurface
remains within the survey boundary;
x assess the archaeological potential of identified anomalies; and
x identify possible concentrations of past activity in order to inform the
requirement for any further archaeological investigation at the site.
5.0 METHODOLOGY
5.1 All survey work was completed to appropriate standards contained in current
guidelines (CIfA 2014; Schmidt et al. 2015). The gradiometer survey used Bartington
Grad601-2 dual magnetic gradiometer systems with data loggers. Readings were
recorded at a resolution of 0.01nT, and data was collected with a traverse interval of
1m and a sample interval of 0.25m. The survey data was collected with reference to a
site survey grid comprised of individual 30m x 30m squares. The grid was established
© Northern Archaeological Associates Arcus Consultancy Services
3Whinfield Solar Farm, County Durham, Phase 2: Geophysical Survey
using Real Time Kinematic (RTK) differential GPS equipment and marked out using
non-metallic survey markers. All grid nodes were set out with a positional accuracy of
at least 0.1m and could be relocated on the ground by a third party. The base lines
used to create the survey grids are shown on Figure 2 and further details are available
in Appendix A.
5.2 The processing was carried out using Geoplot 3.0 software and consisted of standard
processing procedures. Details of processing steps applied to collected data are
provided in Appendix B.
5.3 On the greyscale plots, positive readings are shown as increasingly darker areas and
negative readings are shown as increasingly lighter areas (Figs 3, 4, 6, 8, and 10).
5.4 Identified anomalies are generally interpreted by analysis of patterning and increases
in magnetic response, which is often aided by examining supporting information. The
interpreted data uses colour coding to highlight specific readings in the survey area
(Fig 5, 7, 9, and 11). Appendix C details the terminology and characterisation of
anomalies used for interpreting data.
Surface conditions and other mitigating factors
5.5 At the time of survey, Areas C and E both contained arable land that had been recently
rolled and seeded; Area I contained pasture.
5.6 Field boundaries comprised hedgerows and metal fencing; there were occasional
areas of high vegetation along field edges. Three electricity pylons were located in
Area E.
5.7 Attempts were made to avoid areas affected by above-ground features that were likely
to have a high magnetic susceptibility, such as metal fencing, to minimise the
potential for their magnetic responses to impinge on the survey results and mask
potential buried features.
5.8 Of the 13ha development area, 11.6ha was suitable to be surveyed.
6.0 RESULTS
6.1 This section provides a detailed interpretation of the areas surveyed, and discusses
general anomalies identified across the site.
© Northern Archaeological Associates Arcus Consultancy Services
4Whinfield Solar Farm, County Durham, Phase 2: Geophysical Survey
General anomalies across the whole site (Figs 4 and 5)
6.2 There are several weak and diffuse linear trends. Generally, these fail to produce the
necessary patterning or increases in magnetic response in order to be interpreted fully,
and as a consequence their origin is unknown.
6.3 There are numerous alignments of regularly spaced linear anomalies considered most
likely to relate to agricultural activity. Those with a broad spacing and an ‘S’ curve are
considered to be indicative of earlier agricultural features, such as ridge and furrow,
while those with a narrow spacing and straight form are likely to denote modern
ploughing. Linear anomalies with a very broad spacing and straight form are likely to
denote land drains. It should be noted that land drains were often built into ridge and
furrow, so their location might identify the former features. Isolated linear anomalies
with weak increases in magnetic strength are likely to be agricultural in origin, but
their exact cause is unknown.
6.4 Several bipolar responses were identified. Isolated bipolar anomalies are considered
to be modern and caused by material with a high magnetic susceptibility, such as
ferrous objects. Linear bipolar anomalies are likely to denote buried utilities. The
strength and size of the anomaly associated with the buried utility reflect the highly
magnetic responses of the ferrous material of the buried pipe rather than actual feature
dimensions.
6.5 Dipolar anomalies often relate to ferrous or modern objects buried in the topsoil.
Consequently, these anomalies are generally considered to be of a modern nature and
so have not been depicted on interpretation plots.
6.6 Concentrations of dipolar anomalies have been identified that are likely to be caused
by modern magnetic debris in the topsoil or near the surface. Concentrations of
bipolar anomalies—predominantly located along the edges of the survey area—relate
to above-ground features external to the survey area, such as metal fencing, gates and
electricity poles. There is evidence on 19th-century OS maps of a brick and tile works
and clay pits to the north of the PDA, and so it is possible that concentrations of
dipolar/bipolar anomalies may in part relate to activity associated with the works.
© Northern Archaeological Associates Arcus Consultancy Services
5Whinfield Solar Farm, County Durham, Phase 2: Geophysical Survey
Area C (Figs 6 and 7)
6.7 In the east of Area C there is a series of linear anomalies that plausibly denote infilled
features (Fig 7: C1). However, as C1 are composed of a fragmented patterning, it is not
possible to ascertain if they are archaeological, agricultural or modern in origin.
6.8 Numerous alignments of regularly spaced linear anomalies were identified. Those on
a north–south orientation are likely to denote ridge and furrow; those with a narrow
spacing running on an east–west orientation correspond with modern plough furrows.
6.9 The bipolar anomaly (Fig. 7: C2) running on a north-west to south-east orientation
through the west of Area C corresponds with a buried utility identified in Area D (NAA
2021 Fig. 5: D2).
6.10 An area of magnetic disturbance is located in the south-east of Area C that is likely to
be caused by ferrous material in the topsoil and so is considered to be of a modern
nature (C3).
Area E (Figs 8 and 9)
6.11 A linear anomaly composed of weak increases in magnetic value runs on an east–west
orientation through the centre-west of Area E (Fig 9: E1). Although E1 does not appear
on historic maps, it has a patterning that could be suggested to be caused by a former
field boundary. Likewise, a series of diffuse trends (Fig 9: E2) were identified in the
centre-east of Area E on a similar orientation to E1. The interpretation of E2 is very
tentative as it is unclear if they also potentially relate to a former field boundary, an
alternative agricultural activity or are modern or geological in origin.
6.12 Regularly spaced linear anomalies on a north–south orientation correspond with the
modern plough regime. Those with a broad spacing running on an east–west and
south-west to north-east orientation in the south of Area E have a broad spacing
suggestive of land drains.
6.13 Several isolated bipolar anomalies were identified that correspond with the location of
pylons carrying powerlines running on a north–south orientation through Area E (Fig
9: E3).
© Northern Archaeological Associates Arcus Consultancy Services
6Whinfield Solar Farm, County Durham, Phase 2: Geophysical Survey
Area I (Figs 10 and 11)
6.14 A linear anomaly and several adjacent trends (Fig 11: I1) correspond with the location
of a feature (possible stream?) shown on the 1857 OS map and a trend identified in
Area H (NAA 2020, Fig 15: H1). If the linear anomalies that comprise I1 denote an
infilled steam, it is likely that the adjacent trends relate to changing water levels of the
stream several and natural soil deposition processes.
6.15 Several amorphous anomalies (Fig 11: I2) were identified to the north of I1; it is
unclear if they relate to a similar activity, an alternative infilled feature or are modern
in nature.
6.16 Regularly spaced linear anomalies caused by ridge and furrow run on an east–west
orientation. Regularly spaced linear anomalies of an unknown origin were also
identified on a north–south orientation, but it is not possible to determine if they relate
to land drainage or cultivation techniques, or are associated with the former possible
stream that previously meandered through Area I.
6.17 The linear bipolar anomaly in the west of Area I relates to a buried utility (Fig. 11: I3)
and the amorphous bipolar anomaly in the north of the area is likely to relate to a gate
located in the north of the field (Fig. 11: I4).
7.0 CONCLUSIONS
7.1 NAA was commissioned to undertake a geophysical (gradiometer) survey on land at
Whinfield Farm, County Durham, to support a planning application for a proposed
solar development.
7.2 The results of the geophysical survey in Areas C, E and I have not conclusively
identified any features considered to have an archaeological origin. Several
fragmented linear anomlies were identified in Area C that are plausibly caused by
infilled features, and linear anomalies and trends plausibly associated with an infilled
stream were identified in Area I. A linear anomaly running on an east–west orientation
through the centre of Area E possibly denotes a former field boundary but does not
correspond with features recorded on 19th- and 20th-century historic maps.
Numerous trends were identified across all areas surveyed as well as several
amorphous anomalies in Area I. Generally, these were composed of incomplete
© Northern Archaeological Associates Arcus Consultancy Services
7Whinfield Solar Farm, County Durham, Phase 2: Geophysical Survey
patterning or weak increases in magnetic values and consequently their origin is
unknown.
7.3 Otherwise, anomalies were considered to be of an agricultural (including several
regimes of ridge and furrow) or modern in nature.
8.0 STORAGE AND CURATION
8.1 The records of the geophysical survey are currently held by NAA. All material will be
appropriately packaged for long-term storage in accordance with national guidelines
(CIfA 2014; Schmidt et al. 2015). An OASIS form will be completed on the results of
the works within three months of the completion of the project. This will include
submission of a PDF version of the final report to the Archaeology Data Service via the
OASIS form.
© Northern Archaeological Associates Arcus Consultancy Services
8Whinfield Solar Farm, County Durham, Phase 2: Geophysical Survey
REFERENCES
Arcus, (2021) Whinfield Solar Farm: archaeological desk-based assessment. Arcus draft report
20148.
Aspinal, A., Gaffney., C. and Schmidt, A. (2008) Magnetometry for Archaeologists. Plymouth:
Altamira Press.
Bartington Instruments Ltd. (n.d.) Grad601 Single Axis Magnetic Field Gradiometer system.
Oxford: Bartington Instruments Ltd.
British Geological Survey (2021) Geology of Britain viewer. [Online] Available at:
https://www.bgs.ac.uk/discoveringGeology/geologyOfBritain/viewer.html (accessed on
03/02/2021).
Chartered Institute for Archaeologists (CIfA) (2014) Standard and guidance for archaeological
geophysical survey. Reading: Chartered Institute for Archaeologists.
Gaffney, C. and Gater, J. (2003) Revealing the Buried Past. Stroud: Tempus Publishing.
Jarvis, R. A., Bendelow, V. C., Bradley, R. I., Carroll, D. M., Furness, R. R., Kilgour, I. N. L. and
King, S. J. (1984) Soils and their use in Northern England. Soil Survey Bulletin No. 10.
Harpenden: Rothamsted Experimental Station.
Northern Archaeological Associates (2021) Whinfield Solar Farm, County Durham:
Geophysical Survey. NAA Unpublished Report 21/10
Schmidt, A., Linford, P., Linford, N., David, A., Gaffney, C., Sarris, A. and Fassbinder, J. (2015)
EAC Guidelines for the Use of Geophysics in Archaeology. EAC Guidelines 2.
Belgium: Europae Archaeologiae Consilium.
Soil Survey of England and Wales (1983) Soils of England and Wales 1:250 000 Map Sheet 1:
Northern England. Southampton: Ordnance Survey.
Online sources
National Library of Scotland http://maps.nls.uk/
Historic England National Heritage List for England
https://historicengland.org.uk/advice/hpg/heritage-assets/nhle/
© Northern Archaeological Associates Arcus Consultancy Services
9Whinfield Solar Farm, County Durham, Phase 2: Geophysical Survey
Old Maps www.old-maps.co.uk
Google Earth http://earth.google.co.uk
Magic (DEFRA) http://magic.defra.gov.uk/MagicMap.aspx
NPPF Planning Practice Guidance https://www.gov.uk/government/collections/planning-
practice-guidance
British Geological Survey GeoIndex https://www.bgs.ac.uk/
Domesday Book www.opendomesday.org
© Northern Archaeological Associates Arcus Consultancy Services
10Whinfield Solar Farm, Co. Durham, Phase 2: Geophysical Survey Report
APPENDIX A:
TECHNICAL INFORMATION
GRADIOMETER SURVEY
Magnetic surveys measure distortions in the earth’s magnetic field caused by small magnetic
fields associated with buried features (Gaffney and Gater 2003, 36) that have either remanent
or induced magnetic properties (Aspinal et al. 2008, 21–26). Human activity and inhabitation
often alters the magnetic properties of materials (ibid., 21) resulting in the ability for numerous
archaeological features to be detected through magnetic surveys. Intensive burning or heating
can result in materials attaining a thermoremanent magnetisation; examples of which include
kilns, ovens, heaths and brick structures (Gaffney and Gater 2003, 37; Aspinal et al. 2008, 27).
When topsoil rich with iron oxides, fills a man-made depression in the subsoil, it creates an
infilled feature, such as a pit or ditch, with a higher magnetic susceptibility compared to the
surrounding soil (Gaffney and Gater 2003, 22–26; Aspinal et al. 2008, 37–41). Magnetic
surveys can also detect features with a lower magnetically susceptibility than the surrounding
soil, an example of which is a stone wall.
LIMITATIONS
Poor results can be due to several factors including short-lived archaeological occupation/use
or sites with minimal cut or built features. Results can also be limited in areas with soils
naturally deficient in iron compounds or in areas with soils overlying naturally magnetic
geology, which will produce strong responses masking archaeological features.
Overlying layers, such as demolition rubble or layers of made ground, can hide any earlier
archaeological features. The presence of above ground structures and underground services
containing ferrous material can distort or mask nearby features.
Particularly uneven or steep ground can increase the processing required, or distort results
beyond the capabilities of processing. It is also possible in areas containing dramatic
topographical changes that natural weathering, such as hillwash, often in combination with
intensive modern ploughing, will reduced the topsoil on slopes and towards the peaks of hills
and possibly destroy or truncate potential archaeological features. Conversely, features at the
bottom of slopes may be covered by a greater layer of topsoil and so if buried features are
present they appear faint within the results, if at all.
Over processing of data can also obscure or remove features, especially if they are on the same
orientation as the direction of data collection. Consequently, where possible, attempts are
made to ensure data is not collected on the same orientation as known potential features and
that data quality is sufficient to minimise the required data processing.
INSTRUMENTATION
The data was collected using handheld Bartington Grad 601-2 fluxgate gradiometers. The
Bartington 601-2 is a single axis, vertical component fluxgate gradiometer comprising a data
logger battery cassette and two sensors. The sensors are Grad-01-1000L cylindrical gradiometer
sensors mounted on a rigid carrying frame; each sensor contains two fluxgate magnetometers
with 1m vertical separation.
© Northern Archaeological Associates for Arcus Consultancy Services
11Whinfield Solar Farm, Co. Durham, Phase 2: Geophysical Survey Report
The difference in the magnetic field between the two fluxgates in each sensor is measured in
nanoTesla (nT). NAA gradiometer data is recorded with a range of ±100nT, which equates to a
resolution of 0.01nT. It should be noted that the actual resolution is limited to 0.03nT as a
consequence of internal instrumental noise (Bartington Instruments Ltd n.d., 23).
The gradiometer records two lines of data on each traverse, the grids are walked in a zig-zag
pattern amounting to 15 traverses. The gradiometers are calibrated at the start of every day and
recalibrated whenever necessary.
SURVEY DETAILS
Table A1: survey summary.
Survey
Grid size 30m x 30m
Traverse interval 1m
Reading interval 0.25m
Direction of 1st traverse N
Number of Grids 189
Area covered 11.6ha
Table A2: baseline co-ordinates (baseline is shown on Fig. 2).
Grid point (gp) A Grid point (gp) B
NGR: 430260.1225 522815.4235 NGR: 430320.1225 522815.4235
Table A3: site information and conditions.
Item Detail
Geology Sherwood Sandstone Group
Superficial deposits E – Clay, Sand and Graves of the Vale of York
C – Alluvium and river terrace deposits of sand and
gravel
W – Devensian Till
Soils Crewe Association
Topography 87m to 97m aOD
Land use Mixed used: pasture/arable
Weather/conditions prior to and during survey Sunny
© Northern Archaeological Associates for Arcus Consultancy Services
12Whinfield Solar Farm, Co. Durham, Phase 2: Geophysical Survey Report
APPENDIX B:
DATA PROCESSING INFORMATION
Gradiometer survey data is downloaded using the Bartington Grad 601 software and the
processing was undertaken using Geoplot 3.0 software.
Table B1: commonly applied techniques.
Process Effect
Zero mean traverse Removes stripping which can occur as a consequence of using multi sensor
arrays or a zig-zag data collection method by setting the mean reading for
each traverse to zero.
Destagger Removes stagger in the data introduced through inconsistence data
collection pace and often exacerbated through the zig-zag methodology.
Clip Clips data above or below a set value to potentially enhance potential
weaker anomalies.
Despike Removes random spikes or high readings to reduce the appearance of
dominant readings, often created by modern ferrous objects that can distort
the results.
Low pass filter Removes low frequency waves or broad anomalies such as those caused by
strong or large gradual variations in the soil’s magnetic susceptibility often
caused by geological or natural changes in the substrata.
Interpolation Used to smooth or reduce the blocky appearance of data by improving the
spatial density and balance the quantity of data points in the X and Y
directions.
Table B2: processing steps.
Minimal processing Increased processing
x Zero mean traverse +5/-5 x Low Pass Filter
x Destagger x Interpolate Y, Expand – Linear
© Northern Archaeological Associates for Arcus Consultancy Services
13Whinfield Solar Farm, Co. Durham, Phase 2: Geophysical Survey Report
APPENDIX C:
DATA VISUALISATION INFORMATION
FIGURES
The data from the surveys was used to produce a series of images to represent the results. The
terminology is detailed below:
x Greyscale/Colourscale Plot: this visualised the results as a shaded drawing with highest
readings showing as black, running through to lowest shade showing as white.
x XY-trace Plot: this creates a line drawing showing the peaks and troughs of the readings
as vertical offset from a centreline.
x Interpreted Plot: through detailed analysis, anomalies have been interpreted and
possible features identified. Interpretation drawings are used to show potential features
and, in particular, to reinforce and clarify the written interpretation of the data.
Anomalies have been characterised using the terminology detailed in the following
section, and have been assigned colour coding outlined in keys found on the relevant
figures associated with this report.
MAGNETIC ANOMALIES AND TERMINOLOGY
Table C1: lexicon of terminology.
Terminology Detail
Anomaly Any outstanding high or low readings forming a particular shape or
covering a specific area with the survey results.
Feature A man-made or naturally created object or material that has been detected
through investigation works and has sufficient characteristics or supporting
evidence for positive identification.
Magnetic susceptibility The ability of a buried feature to be magnetically induced when a magnetic
field is applied.
Magnetic response The strength of the changes in magnetic values caused by a buried feature
with either a greater or lesser ability to be magnetised compared with the
soil around it.
Anomalies are considered to either have strong/weak or positive/negative
responses.
The strength of magnetic response (along with patterning) can be essential
in determining the nature of an anomaly, but it should be noted that the
size or strength of the magnetic response does not correlate with the size of
the buried feature.
Patterning of an anomaly The shape or form of an individual anomaly.
Different anomalies can represent different features created by human, agricultural or modern
activity, or natural pedological or geological changes in the substrata.
Anomalies interpreted with a ‘greater’ categorisation are considered more likely to be of the
interpreted characterisation; whereas a more tentative interpretation is applied to those with a
© Northern Archaeological Associates for Arcus Consultancy Services
14Whinfield Solar Farm, Co. Durham, Phase 2: Geophysical Survey Report
‘lesser’ categorisation as a consequence of weaker increases in magnetic response or the
anomalies incomplete patterning or irregular form.
The strength and size of anomalies can vary depending on the magnetic properties of the
feature, the magnetic susceptibility of the soil, the depth to which the feature is buried, and the
state of preservation.
Table C2: characterisation of anomalies.
Characterisation Detail
Archaeology?
Linear anomaly Linear anomalies with a positive or negative magnetic responses, and
(infilled feature) composed of a patterning or shape that is suggestive of a buried
archaeological feature. These are often indicative of structural remains or
infilled features such as ditches.
The strength of anomaly signal can be suggestive of the properties of the
feature. Negative linear anomalies represent upstanding or infilled features
that are less magnetically susceptible than background readings, for
example structures or ditches composed of a non-igneous stone material.
Bipolar linear anomalies considered to be of an archaeological nature are
indicative of material with a high magnetic susceptibility, such as a brick
wall.
Trends Weak and diffuse anomalies with an uncertain origin are denoted by
trends. It is possible that these belong to archaeological features, but given
their weak signatures or incomplete patterning it is equally plausible that
they relate to agricultural features or natural soil formations.
Agriculture
Field boundary Isolated linear anomalies that are likely to be indicative of former land
divisions. A more conclusive interpretation is given to linear anomalies that
correspond with the location of field boundaries recorded on historic maps,
Aerial photos or LiDAR coverage of the site.
Ridge and furrow Broadly spaced linear anomalies that are likely to be indicative of earlier
forms of agriculture, such as ridge and furrow. These often correspond with
the location of earthworks visible on the ground or identified on aerial
photos or LiDAR survey coverage.
Agriculture (plough) Regularly spaced linear anomalies, often with a narrower spacing, that
conform with ploughing regime at the time of survey, or a recent regime
recorded on aerial photos of the site.
Agriculture (land drain) The response and distribution of land drains varies depending on the
composition of the land drain and associated ditch or channel.
Consequently, land drains can be composed of weak/strong
positive/negative magnetic responses and are identified as a product of
either their variance in magnetic values or positioning compared with
regularly spaced linear anomalies considered to relate to modern
ploughing.
Land drains can be located within former agricultural regimes, such as
ridge and furrow.
Agriculture? Weak, irregularly spaced or isolated linear anomalies that possibly relate to
agricultural activity. Given the tentative interpretation, the agricultural
process they are caused by is also likely to unknown.
Modern
Bipolar response Positive anomalies with associated negative ‘halo’ (bipolar) denote features
© Northern Archaeological Associates for Arcus Consultancy Services
15Whinfield Solar Farm, Co. Durham, Phase 2: Geophysical Survey Report
Characterisation Detail
(modern) with a strong magnetic response are likely to be of a modern origin.
Isolated bipolar responses of a modern nature are likely to relate to buried
ferrous material or objects, such as metallic agricultural debris. If a trend is
noted in the alignment or spacing of isolated bipolar responses, it is
possible that they are indicative of ferrous fittings or connectors used on
buried non-magnetic buried utilities.
Linear bipolar anomalies are likely to be indicative of modern services.
Dipolar response Dipolar anomalies relate to individual spikes within the data and tend to be
caused by ferrous objects. These responses have only been shown when
located near to archaeological features.
When the site is located in a mining landscape it is possible that identified
dipolar anomalies relate to mining activity and are indicative of further pits
or mine shafts.
Area of increased Areas of increased magnetic response denote areas of disturbance
magnetic response containing a high concentration of dipolar and/or bipolar responses. These
are generally considered to be caused by modern debris in the top soil,
although it is possible that the disturbance is in part also caused by isolated
archaeological material or geological or pedological changes in the
substrata.
Areas of magnetic disturbance, often along the edges of survey areas are
caused by standing metal structures such as fencing and buildings.
© Northern Archaeological Associates for Arcus Consultancy Services
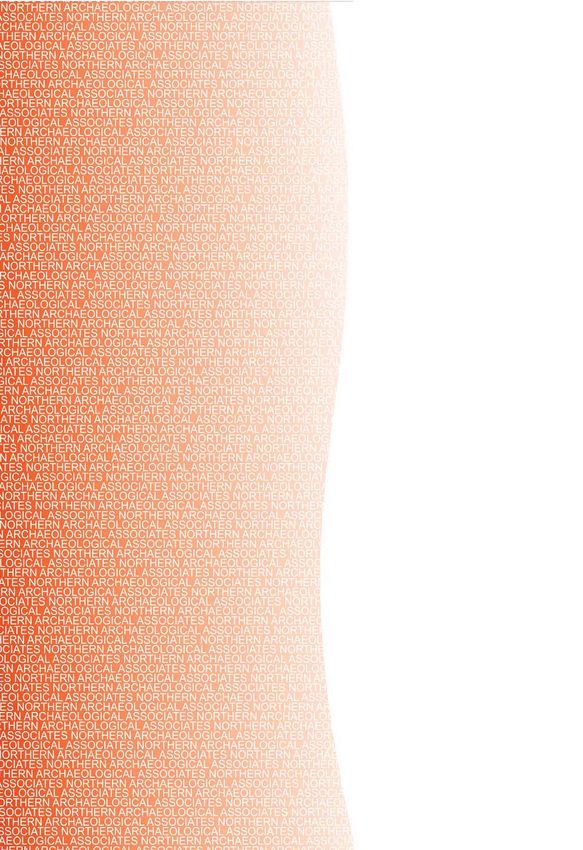
16N
0 5km
scale 1:250,000 @ A4
N
524
523
site location
522
521
0 1km
scale 1:25,000 @ A4
430 431
© NAA 2021
Whinfield Solar Farm, County Durham: site location Figure 1You can also read