National Tertiary Student Wellbeing Survey 2016 - Headspace
←
→
Page content transcription
If your browser does not render page correctly, please read the page content below

National Tertiary Student
  Wellbeing Survey 2016

           National Tertiary Student Wellbeing Survey 2016   1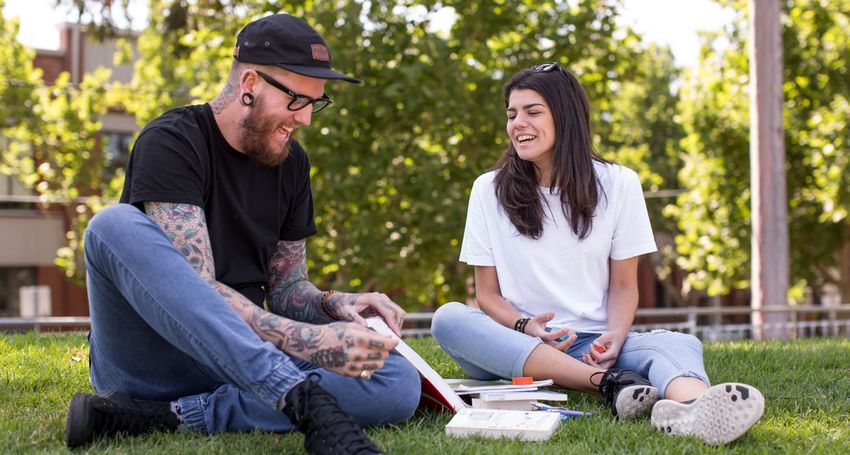
Debra Rickwood – headspace, University of Canberra
Nic Telford – headspace
Shaunagh O’Sullivan – headspace
Dimity Crisp – University of Canberra
Robby Magyar – National Union of Students
Contents

List of Tables and Figures                                   2
Foreword                                                     3
Executive Summary                                            5
Background                                                   6
Methodology                                                  8
    Procedure                                                8
    Survey Measures                                          9
    Participants                                            10
Young adults: 16-25 years                                   13
    Demographic Characteristics                             13
    Academic Issues                                         14
    Financial Issues                                        17
    Mental Health Issues                                    19
            Perceived mental health and health status       19
            Psychological distress                          20
            Mental health problems affecting studies        20
            Days out of role                                21
            Study-related factors affecting mental health   22
            Alcohol and other drug use                      23
    Service Use For Mental Health Problems                  24
            Campus counselling and medical services         24
            headspace                                       25
            Online services                                 26
            Barriers to mental health care                  27
Mature adults: 26-50+ years                                 28
    Demographic Characteristics                             28
    Academic Issues                                         29
    Financial Issues                                        32
    Mental Health Issues                                    34
            Perceived mental health and health status       34
            Psychological distress                          34
            Mental health problems affecting studies        35
            Days out of role                                35
            Study-related factors affecting mental health   36
            Alcohol and other drug use                      37
    Service Use For Mental Health Problems                  38
            Campus counselling and medical services         38
            headspace                                       39
            Online services                                 40
            Barriers to mental health care                  41
Conclusions                                                 42
    Key Findings                                            42
    Limitations                                             43
    Conclusions                                             43
References                                                  44
List of Tables and Figures

Table 1. Demographic characteristics                                                                             11
Table 2. Living, employment and economic characteristics                                                         12
Table 3. Mean stress scores for each academic stressor, by gender                                                16
Table 4. Course-related costs incurred and foregone, by gender (%)                                               18
Table 5. Mean stress scores for each academic stressor, by gender                                                31
Table 6. Course-related costs incurred and foregone, by gender (%)                                               33

Figure 1. Contact hours per week, face-to-face and online (%)                                                    14
Figure 2. Problems experienced with academic progress, by gender (%)                                             14
Figure 3. Factors affecting academic progress for participants who had not passed all subjects, by gender (%)    15
Figure 4. Level of distress for academic activities (%)                                                          16
Figure 5. Weekly income, by gender (%)                                                                           17
Figure 6. Course-related costs in the last academic term, by gender (%)                                          17
Figure 7. Parking/travel costs per week, by gender (%)                                                           18
Figure 8. Rating of mental health and physical health (%)                                                        19
Figure 9. Mental health ratings, by gender (%)                                                                   19
Figure 10. Levels of psychological distress, by gender (%)                                                       20
Figure 11. Mental health issues affecting studies, by gender (%)                                                 20
Figure 12. Number of days out of role in the past four weeks due to mental health problems, by gender (%)        21
Figure 13. Student-related factors affecting mental health and wellbeing, by gender (%)                          22
Figure 14. Alcohol and other drug use in the past 3 months (%)                                                   23
Figure 15. Wait times for campus counselling and medical services (%)                                            24
Figure 16. Rating of campus counselling and medical services (%)                                                 25
Figure 17. Use of headspace services, by gender (%)                                                              25
Figure 18. Use of different online services for mental health support in the past 12 months, by gender (%)       26
Figure 19. Barriers to seeking professional help for mental health issues, by gender (%)                         27
Figure 20. Contact hours per week, face-to-face and online (%)                                                   29
Figure 21. Problems experienced with academic progress, by gender (%)                                            29
Figure 22. Factors affecting academic progress for participants who had not passed all subjects, by gender (%)   30
Figure 23. Level of distress for academic activities (%)                                                         31
Figure 24. Weekly income, by gender (%)                                                                          32
Figure 25. Course-related costs in the last academic term, by gender (%)                                         32
Figure 26. Parking/travel costs per week, by gender (%)                                                          33
Figure 27. Rating of mental health and physical health (%)                                                       34
Figure 28. Levels of psychological distress, by gender (%)                                                       34
Figure 29. Mental health issues affecting studies, by gender (%)                                                 35
Figure 30. Number of days out of role in the past four weeks due to mental health problems, by gender (%)        35
Figure 31. Student-related factors affecting mental health and wellbeing, by gender (%)                          36
Figure 32. Alcohol and other drug use in the past 3 months (%)                                                   37
Figure 33. Wait times for campus counselling and medical services (%)                                            38
Figure 34. Rating of campus counselling and medical services (%)                                                 39
Figure 35. Use of different online services for mental health support in the past 12 months, by gender (%)       40
Figure 36. Barriers to seeking professional help for mental health issues, by gender (%)                         41

2   National Tertiary Student Wellbeing Survey 2016

Foreword

The National Union of Students (NUS), as the peak representative body for
undergraduate university students, has long been aware of the detrimental effects
poor mental health and financial insecurity can have on student wellbeing and
academic performance. However, without data to point to, NUS could only rely
on anecdotal reports provided by student union representatives. It was this lack
of concrete evidence that lead the 2015 National Welfare Officer Dean DÔAngelo
and 2015 National Disabilities Officer Alison Taylor to launch the Student Wellbeing
Survey. Unfortunately, due to competing surveys and campaigns within NUS,
the response rate from the first survey was too low for data comparison and use
in NUS campaigns.

As one of the many student union representatives that promoted the survey in 2015 and found
the response rate underwhelming, I set out to change this by announcing I would relaunch the
Student Wellbeing Survey when I was elected to serve as the National Welfare Officer for 2016.

                                                                                                                  “
It was this pledge that lead me to connect with a like-minded organisation seeking to assist
young people with their health and wellbeing. As a university student who has struggled to get by
on income support and experienced severe bouts of depression, I knew I wanted to work with
headspace on this iteration of the survey as they would treat it with the same care they provide         It was a pledge
young people struggling with poor mental health every day.                                                 that lead me
Together, NUS and headspace finalised the questions, which covered income support,                        to connect with
accommodation, work, transport, student support services and experiences with mental health.
Once we launched the survey, I visited campuses across the country and worked with campus
                                                                                                           a like-minded
student unions to increase awareness of the survey, as well as the impact poor mental health                organisation
and stigma can have on the wellbeing of university students. The success of this survey should
be shared with all the student union representatives that took part, in particular I would like to
                                                                                                         seeking to assist
thank Aislinn Stein-Magee, Akira Boardman, Betty Belay, Cam Petrie, Dom McDonald, Emma                     young people
Boogaerdt, Georgia Tree, Giacomo Arnott, Heidi La Paglia, Hope Smith, Izzy Mansfield, Jacinta
Mortell, James Connelly, Jake Wittey, Jason Byrne, Jill Molloy, Jordon O’Reilly, Lewis Whittaker,
Lizzie Green, Maddie Mulholland, Max Murphy, Nick Douros, Peter Munford, Peter Zacharatos,
Riley Williamson, Simone Jowett, Sinéad Colee, Sophie Johnston, Taylor Ficarra, Terry Watson,
Vanessa Song and Zhang Ziyang for their tireless efforts to promote the survey on their campuses.
Without them, the 2016 Student Wellbeing Survey would not have seen such a high response
rate and student unions would not have a collection of data to address poor mental health and
financial insecurity among tertiary students.

I would also like to thank those who participated. By telling your story, even anonymously through
pre-structured questions, you have assisted those who sit next to you in tutorials and those who
will sit in lecture theatres long after you’ve graduated.

Overseeing the creation, promotion and reportage of the results of the Student Wellbeing Survey
has been a long process that I am very proud to see come to an end. I truly hope that this report
sparks not only discussion and policy development, but a renewed sense of unity and fight among
the student movement to improve the wellbeing of young people across Australia, otherwise our
efforts will all amount to nothing.

ROBBY MAGYAR
2016 National Welfare Officer, National Union of Students

                                                                                  National Tertiary Student Wellbeing Survey 2016   3
Foreword

The 2016 Student Wellbeing survey was completed by thousands of students
across the country to give an insight into the mental health and wellbeing of
young people at university. The results of such an extensive and eye-opening
survey unlike any other are crucial to highlight why there must be a response
within the sector to support students properly and effectively in their studies. With
findings such as 70% of respondents rating their mental health as just poor or
fair, as the NUS Welfare Officer for 2017, I have been absolutely inundated with
campuses, student leaders and staff reaching out after the initial findings came
out earlier in the year and wanting to make a difference.

University is a time of significant changes and challenges that impact a student’s mental health
and wellbeing not to mention that young people are an at-risk group. Increased independence,
more responsibility, financial pressures and personal development which can include relationship

                                                                                                             “
problems and drug and alcohol use are just some of these factors. This is all in combination
with the competitive and stressful nature of tertiary study which has its workloads, deadlines
and grades. Unfortunately, too often students can fall through the cracks without a proper safety
net in place.                                                                                          Unfortunately, too
It is for these reasons why the National Union of Students have partnered with headspace, in           often students can
order to bring these issues to light and into the forefront of discussion. This survey is crucial to
highlight the issues at hand, go about creating a culture to destigmatize mental health issues and
                                                                                                         fall through the
importantly, lobby for better services for students. At present, the services available to students     cracks without a
on campuses across the country differ significantly from one to the next, particularly in regional
and rural areas. Whilst there has been an increased awareness in the University sector around
                                                                                                        proper safety net
wellbeing, the quality of care has not increased accordingly. The National Union of Students is               in place
proud to partner with groups like headspace around these issues and will continue to advocate
for the need to support young people.

JILL MOLLOY
2017 National Welfare Officer, National Union of Students

4   National Tertiary Student Wellbeing Survey 2016
Executive Summary

           The National Union of Students (NUS), with the support of headspace: National
           Youth Mental Health Foundation, conducted a National Tertiary Student Wellbeing
           Survey in the second half of 2016 to provide a snapshot of the key stressors
           and factors affecting the wellbeing of AustraliaÔs tertiary students. The survey
           investigated how the academic, financial and mental health experiences of
           university and TAFE students impact their time at university.

           The survey was undertaken in recognition of the lack of research regarding the wellbeing of tertiary
           students, but increase in risk factors among the tertiary student population. A specific focus was
           placed on mental health and the use of health and counselling services by students for mental
           health issues, given the apparent increased need in this area.

           There were 3303 participants in the survey from 40 universities and 30 TAFEs. The results are
           considered separately for 16-25 year old students (n=2637) and 26-50+ year old students (652),
           to consider separately the findings for emerging/young adults and mature adults in the tertiary
           education system.

       Key Findings
           For Young Adults:
       •      67% rated their mental health as “fair” or “poor” compared with 39% who rated their
              physical health as “fair” or “poor”.
       •      65% reported high or very high psychological distress.
       •      Only 1.6% reported that no symptoms of mental health problems impacted their study
              in the past year.
       •      27% had accessed on-campus counselling services, and 24% rated their experience
              as negative.
       •      28% had accessed on-campus medical services, and 13% rated their experience
              as negative.

           For Mature Adults:
       •      59% rated their mental health as “fair” or “poor” compared with 41% who rated their
              physical health as “fair” or “poor”.
       •      53% reported high or very high psychological distress.
       •      Only 3.4% reported that no symptoms of mental health problems impacted their study
              in the past year.
       •      32% had accessed on-campus counselling services, and 20% rated their experience
              as negative.
       •      26% had accessed on-campus medical services, and 9% rated their experience
              as negative.

                                                           National Tertiary Student Wellbeing Survey 2016   5
Background The health and wellbeing of students in tertiary education is of major significance for Australia. It is estimated that nearly 20% of Australians aged 15-64 years are enrolled in formal study (ABS, 2016), including the majority of secondary school leavers and 45% of those aged 20-24 years. Participation declines to 16% for people aged 25-34 years, 9.2% aged 35-44 years, 5.7% aged 45-54 years, and 2.7% of those aged 55-64 years. Tertiary education in Australia is provided via two main pathways: higher education is generally provided by universities and offers graduate and postgraduate degree qualifications, and is funded primarily by the Australian government; and vocational education and training, which is provided by a wide range of training organisations offering certificate and diploma qualifications, and funded by complex joint state/territory and Federal arrangements. In 2015, there were just over 1.4 million university students enrolled in the 40 Australian universities (37 public and 3 private) and two overseas institutions that operate in Australia (Universities Australia, 2017). In 2015, it was estimated that there were 4.5 million students enrolled in vocational education and training (VET) delivered by 4277 training organisations (Australian Government, 2016). These included 53 Technical and Further Education institutes (TAFE) and 15 universities, which enrolled 20.5% and 1.8% of VET students, respectively. Of the enrolled university students in 2015, 61% were under 25 years of age, 58% were female, 40% were commencing students, 71% were undergraduate students, 68% were studying on-campus, 66% were studying full-time, and 26% were international students (Universities Australia, 2017). 6 National Tertiary Student Wellbeing Survey 2016
Tertiary education conveys significant opportunity and advantage and Australia has a world-class
system. Australia’s university completion rates are the third highest in the OECD and 37% of 25-
34 year olds have a bachelor degree or higher. Tertiary education is a significant economic driver;
for example, the education of international students is Australia’s third largest export and is valued
at $21.8 billion a year.

Nevertheless, tertiary-level study is also associated with specific risks to health and wellbeing,
and many students struggle to cope with the additional demands and stressors. The level
of psychological distress amongst students in higher education is of concern internationally
(Eisenberg, Gollust, Golberstein, & Hefner, 2007; Eskin et al., 2016; Stallman, 2010). In particular,
young adults transitioning from secondary school to tertiary study are identified as a population

                                                                                                                     “
group at increased risk of poor mental health and disengagement.

There is limited Australian research regarding the health and wellbeing of tertiary students, but
a recent report cites a small number of studies revealing a higher prevalence of psychological
distress among Australian tertiary education students compared with non-students (Orygen,
                                                                                                             There is limited
2017). There is no national data, however, specifically on the mental health and wellbeing of                  Australian
tertiary students.
                                                                                                          research regarding
A range of stressors are reported to impact tertiary students, particularly those first year students        the health and
transitioning to university. These include academic and financial stress, and pressures associated
with increased workload, leaving home, and the establishment of new social networks (Said,                    wellbeing of
et al., 2013). It is this increased level of stress which may account for increased levels of               tertiary students
psychological distress and mental health problems. Importantly, past research has shown high
levels of stress are associated with declines in academic performance and engagement (Salzer,
2012); increases in problematic health behaviours, such as excessive drinking, smoking and
substance use (Hamaideh, 2011); and an increase in the risk of depression, anxiety and burnout
(Dahlin et al., 2005), all of which can have significant implications for student mental health,
wellbeing and engagement.

There are several groups of students at further increased risk because they experience multiple
stressors related to tertiary study. These include international students, students from rural and
regional areas, students from lower socio-economic backgrounds, students with disabilities, and
students who are Aboriginal and Torres Strait Islander. Each of these groups has been the focus
of specific efforts by the Australian government to increase their participation in tertiary education.
In the past 10 years, there has been a 94% increase in students with a disability, a 74% increase
in Indigenous students, a 50% increase in students from low socio-economic backgrounds, and a
45% increase in regional and remote students (Universities Australia, 2017).

In light of the increasing number of students enrolling in tertiary education, and increases in
students at higher risk, concern has been raised about the provision of sufficient, appropriate
resources and services to support students to cope with the stressors of tertiary study and
university life. Increased demand has been placed on university health and counselling services,
raising concern that current supports are insufficient. There has been an increase in students
who have contact with university health and counselling services (Andrews, 2016), and Australian
research at two universities showed that 39% of university students who were experiencing high
psychological distress sought professional help (Stallman & Shochet, 2009). Nevertheless, there
is still a sizeable proportion of students who will not seek formal help for mental health issues due
to barriers such as the stigma associated with professional support services and a preference for
self-reliance and informal support.

There is, therefore, an urgent need to better understand the prevalence of mental health problems
among Australian tertiary students, the factors that are associated with mental distress, and the
appropriateness and responsiveness of health and counselling services. The aim of the 2016 NUS
National Student Wellbeing Survey was to begin to better understand these issues.

                                                                                     National Tertiary Student Wellbeing Survey 2016   7
Methodology
Procedure
An online self-report survey was made available to university and TAFE students between August
and November 2016. This comprised students on the campuses of Australia’s 40 universities and
53 TAFEs.
Participants were informed of the survey in multiple ways driven primarily via National Union
of Students (NUS) representatives at each institution. The NUS representatives promoted
the survey via posters, events, and word-of-mouth based on the recruitment information in
Box 1. Recruitment processes varied across institutions and were determined by the Student
Union representatives at each institution. The survey was also promoted via social media from
headspace National Youth Mental Health Foundation and the National Union of Students.
The survey was hosted by SurveyMonkey and could be completed via any type of device with
online access. Pilot testing indicated that completing the survey would take about 15 minutes.
Ethics approval was obtained prior to commencement of recruitment from the Human Research
Ethics Committee of the University of Canberra (HREC Project 16-161).
Are you currently studying at University or TAFE? Your wellbeing matters - tell us
what is affecting you and your student life right now.
Be part of the 2016 National Student Wellbeing Survey.
The National Union of Students (NUS), with the support of headspace the National Youth Mental Health
Foundation, is conducting a National Student Wellbeing Survey that aims to provide a snapshot of the
key stressors and factors affecting student wellbeing. The survey will investigate how the experiences of
University and TAFE students in Australia, in terms of their academic, transitional, health and economic
stressors, impact their time at university.
The results will inform the NUS and universities about how they can improve services to assist students.
Have a look - it is totally anonymous and confidential and only takes about 15 minutes to complete.
We want to know what is happening for you so we can advocate for the services you need.
Box 1. Survey recruitment information
8 National Tertiary Student Wellbeing Survey 2016Survey Measures
The survey questionnaire comprised the following measures:
• Demographic characteristics • Mental health issues
• Gender • Perceived mental health status
• Age • Mental health factors affecting study
• International student • Days out of role (how many days in last 4 weeks
• Aboriginal or Torres Strait Islander totally unable to work, study etc due to mental health
• Ethnically, culturally, linguistically diverse issues)
• Lived experience of disability • Psychological distress – 10-item Kessler
Psychological Distress scale
• Live in regional or remote area
• Service use
• Sexual orientation - LGBTIQ
• Living situation • Ever used a mental health professional
• Used counselling services on campus in last 12
• Institution and course months
• University or TAFE attended • Wait time for on-campus counselling appointment
• Main field of study • Rated experience of on-campus counselling
• Level of study (undergraduate, postgraduate, TAFE) • Used medical services on campus
• Full-time or part-time • Wait time for on-campus medical appointment
• Year of study • Rated experience of on-campus medical services
• Awareness of headspace services and use in last
• Academic issues 12 months
• Face-to-face contact hours • Use of online services in past 12 months for mental
• Online contact hours health
• Academic progression • Factors that prevent seeking mental health help
• Factors that have affected academic progress
• Stressfulness of lectures, tutorials, written
assignments, oral presentations, exams, group work,
group assessments
• Financial issues
• Items have to pay for as part of course (textbooks
etc)
• Associated course costs in last academic term
• Cost of travel/parking each week
• Experience of financial stress
• Cost of rent etc per week
• Budget capability
• Current debts
• Receipt of government income support
• Issues with Centrelink
• Participation in paid employment
• Income per week
National Tertiary Student Wellbeing Survey 2016 9Methodology Participants Overall, there were 3303 participants aged from 16-50+ years from 70 different tertiary institutions—40 universities and 30 TAFEs. The vast majority were university students, with only 3.3% reporting that they were studying at TAFE. There were 2637 participants aged 16-25 years (79.8%) from 70 institutions and 652 students aged 26-50+ years from 45 institutions who took part in the survey. Table 1 presents the demographic characteristics of the participants, showing these separately for young adults aged 16-25 years and mature adults aged 26 years and over. This reveals that the young adults were primarily undergraduate university students (87.5%) who were studying full- time (86.9%). About a third were first year students. They were primarily from metropolitan regions (87.1%). Only 5.3% were international students. There were 2.1% who were Aboriginal and/ or Torres Strait Islander; 13.9% who were from a cultural and linguistically diverse background; 16.4% with lived experience of disability; and over one-quarter (26.7%) reported their sexuality as lesbian, gay, bisexual, transgender, intersex, or questioning/queer (LGBTIQ). The mature adults, aged 26 years and over, were also primarily undergraduate students, although 42% were postgraduate. Over one-third were studying part-time, and 28% were first year. One- fifth were from regional Australia, although almost 80% were still from metropolitan areas. Just over 10% were international students. There were 3.2% who were Aboriginal and/or Torres Strait Islander; 11.8% who were from a cultural and linguistically diverse background; 21.8% with lived experience of disability; and 16.4% who were LGBTIQ. Table 2 shows the living situation, employment and economic characteristics of the participants in each age group. For the young adults, just over half lived with their parents and another quarter lived off campus not with family. There were 13.9% for whom accommodation was an issue of concern. Most mature adults lived with their partner/children, but accommodation was an issue for almost 19%. There were 42.8% of young adults and 45.0% of mature adults who worked more than 10 hours per week. Of those studying full-time, there were 39.9% of young adults and 32.1% of mature adults working 10 or more hours per week. The household poverty line in Australia for a single adult living alone is currently estimated at $426.30 per week (50% median income) before housing costs and $343.00 after housing costs (ACOSS, 2016). A substantial 82.4% of young adults earned less than $400 per week. For mature adults, over half earned less than $400 per week. Just over one-third (37.6%) of young adults and almost half (42.9%) of mature adults were receiving government income support. 10 National Tertiary Student Wellbeing Survey 2016
Table 1. Demographic characteristics

                                   16-25 YEARS                             26 YEARS AND OVER

                          Males       Females             All        Males           Females                All
                       (N = 691)     (N = 1835)   (N = 2637)      (N = 182)          (N = 445)        (N =652)
                           n (%)          n (%)        n (%)          n (%)              n (%)           n (%)
LEVEL OF STUDY
  Undergraduate             623           1580          2302             92                264              368
                          (90.4)         (86.2)        (87.5)         (51.1)             (59.7)           (56.9)
  Postgraduate               54            198           258             87                173              272
                           (7.8)         (10.8)         (9.8)         (48.3)             (39.1)           (42.0)
  TAFE                       12             54            70              1                  5                7
                           (1.7)          (2.9)         (2.7)          (0.6)              (1.1)            (1.1)
STATUS
  Full-time                 600           1597          2286            132                264              407
                          (87.0)         (87.2)        (86.9)         (73.3)             (59.7)           (62.9)
  Part-time                  90            234           344             48                178              240
                          (13.0)         (12.8)        (13.1)         (26.7)             (40.3)           (37.1)
YEAR OF STUDY
  1st                       201            638           884             40                135              182
                          (29.1)         (34.8)        (33.6)         (22.1)             (30.3)           (28.0)
  2nd                       183            477           683             50                118              174
                          (26.5)         (26.0)        (25.9)         (27.6)             (26.5)           (26.8)
  3rd                       159            373           561             37                 83              126
                          (23.0)         (20.3)        (21.3)         (20.4)             (18.7)           (19.4)
  4th                        95            203           304             25                 51               77
                          (13.7)         (11.1)        (11.5)         (13.8)             (11.5)           (11.8)
  5th onwards                53            142           201             29                 58               91
                           (7.7)          (7.7)         (7.6)         (16.0)             (13.0)           (14.0)
RURALITY
  City in Australia         592           1494          2175            146                347              505
                          (91.1)         (85.3)        (87.1)         (82.0)             (80.1)           (79.7)
  Regional Australia         57            247           312             32                 85              127
                           (8.8)         (14.1)        (12.5)         (18.0)             (19.6)           (20.0)
  Remote Australia            1             10            11              0                  1                2
                           (0.2)          (0.5)         (0.4)          (0.0)              (0.2)            (0.3)
INTERNATIONAL                43             93           140             34                 34               71
                           (6.2)          (5.1)         (5.3)         (18.7)              (7.6)           (10.9)
ATSI                         18             32            56              7                  9               21
                           (2.6)          (1.7)         (2.1)          (3.8)              (2.0)            (3.2)
CALD                        101            241           366             25                 47               77
                          (14.6)         (13.1)        (13.9)         (13.7)             (10.6)           (11.8)
DISABILITY                   99            284           432             30                 95              142
                          (14.3)         (15.5)        (16.4)         (16.5)             (21.3)           (21.8)
LGBTIQ                      190            421           703             24                 64              107
                          (27.5)         (22.9)        (26.7)         (13.2)             (14.4)           (16.4)

                                                                National Tertiary Student Wellbeing Survey 2016    11
Table 2. Living, employment and economic characteristics
16-25 YEARS 26 YEARS AND OVER
Males Females All Males Females All
(N = 691) (N = 1835) (N = 2637) (N = 182) (N = 445) (N =652)
n (%) n (%) n (%) n (%) n (%) n (%)
LIVING SITUATION
Parents 346 908 1310 20 50 70
(55.7) (53.6) (54.2) (12.2) (12.0) (11.6)
Partner and/or 20 116 138 60 209 275
children (3.2) (6.8) (5.7) (36.6) (50.0) (45.6)
On campus 67 184 261 7 8 16
(10.8) (10.9) (10.8) (4.3) (1.9) (2.7)
Off campus 174 456 661 71 142 226
(28.0) (26.9) (27.4) (43.3) (34.0) (37.5)
Other 14 30 45 6 9 16
(2.0) (1.8) (1.9) (3.7) (2.2) (2.7)
ACCOMMODATION
Is not an issue 538 1472 2087 129 347 490
(86.5) (86.5) (86.1) (78.7) (83.0) (81.3)
Is an issue 79 214 314 35 68 109
(12.7) (12.6) (12.9) (21.3) (16.3) (18.1)
At risk of being 4 16 22 0 3 3
homeless (0.6) (0.9) (0.9) (0.0) (0.7) (0.5)
Homeless/ 1 0 2 0 0 1
sleeping rough (0.2) (0.0) (0.1) (0.0) (0.0) (0.2)
EMPLOYMENT HOURS
None 193 457 682 59 157 225
(31.2) (27.1) (28.3) (36.2) (37.6) (37.4)
1-10 161 505 695 26 79 106
(26.0) (30.0) (28.9) (16.0) (18.9) (17.6)
11-20 161 445 631 35 61 98
(26.0) (26.4) (26.2) (21.5) (14.6) (16.3)
20-30 63 187 259 13 42 58
(10.2) (11.1) (10.8) (8.0) (10.0) (9.7)
30+ 41 92 139 30 79 114
(6.6) (5.5) (5.8) (18.4) (18.9) (19.0)
INCOME PER WEEK
None 118 265 397 22 79 104
(19.6) (16.2) (17.0) (14.1) (17.8) (18.2)Young Adults: 16-25 Years
Demographic Characteristics
There were 2,637 Australian university or TAFE students aged between 16-25 years (M = 20.82,
SD = 1.99). The majority were female (69.9%), with 26.3% who were male, and 3.7% identifying
as gender diverse, intersex, indeterminate or other. Due to the small number of students who were
non-binary, gender differences are examined in the results comparing males and females only.
Most of the students were undergraduate (87.5%), full-time students (86.9%), and from a major
city in Australia (87.1%). A third (33.6%) were in their first year of academic study, with the
remainder being in a subsequent year.
Culturally, very few were international students (5.3%). There were 2.1% who identified as
Aboriginal or Torres Strait Islander (ATSI); 13.9% were ethically, culturally or linguistically diverse
(CALD). There were 16.4% with lived experience with a disability; and a substantial 26.7% who
identified as LGBTIQ.
Most (86.1%) had somewhere secure to live, but accommodation was an issue for 13.9% of
students. There were 54.2% living at home with their parents, 23.2% house-sharing off campus,
and 10.8% living on campus.
A third (33%) found it difficult or very difficult to meet their living needs with the income they were
on. Of these students, 83.1% had an income of less than $300 per week and 35% were not in
any employment. Just over a third (37.6%) received some form of Government income support.
National Tertiary Student Wellbeing Survey 2016 13Academic Issues
The majority of students spent between 6 and 15 hours in face-to-face contact each week. Just
Figure over
1 half had some online contact each week. There was no association between amount of
face-to-face and online contact. Figure 1 shows the percentage of students with different contact
hours for both face-to-face and online class contact.
50
45 F2F Online
40
35
30
%
25
20
15
10
5
Figure 1. Contact hours per week,
face-to-face and online (%) 0
0 1 to 5 6 to 10 11 to 15 16 to 20 21 to 25 26+
Hours
Most students (58.5%) had passed all subjects to date. Figure 2 shows the problems experienced
with academic progress, by gender. There were 12.4% who reported they had failed one subject
and 14.7% who had failed multiple subjects. There were 5.6% who had been placed on academic
probation. A gender difference was evident, whereby males (M = 1.53) reported significantly more
Figure 2
academic progress problems than females (M = 1.09), t (946.49) = -4.922, p < .001. Over a
quarter of both males and females had considered leaving their course of study.
30
25 Males Females
20
%
15
10
5
Figure 2. Problems experienced with
academic progress, by gender (%) 0
se
cts
ts
re
re
e
n
e
se
t
t
c
us
io
ec
en
en
lu
ilu
ur
an
ur
e
at
ca
bj
ai
m
bj
m
fa
co
co
rm
ob
su
tf
su
ss
ss
ow
ith
g
e
ou
pr
fo
se
se
e
av
vin
le
w
er
sh
on
ith
as
ic
tip
as
le
a
ts
p
em
w
to
le
d
ul
to
ec
e
ic
le
le
on
m
ts
em
d
ad
d
tip
bj
ed
i
Fa
re
ke
ec
d
su
d
ac
ul
ad
rc
e
ile
bj
as
ile
m
id
fo
ed
su
on
Fa
ac
Fa
ns
en
d
en
u
ile
d
Co
ed
ut
in
be
ue
Be
Fa
o
nt
ac
ab
tin
ve
so
Pl
Ha
on
Di
ng
sc
ni
Di
ar
W
14 National Tertiary Student Wellbeing Survey 2016Those who had not passed all subjects were asked about the factors that had affected their
problems with academic progress (n=1095), and these are presented in Figure 3. A substantial
66.6% reported difficulties balancing study and other commitments as the most common factor,
followed by personal, family or relationship problems (54.1%). Notably about 30% cited financial
Figuredifficulties
3 as a factor affecting their academic progress and almost half the students (47.3%) rated
health problems as a factor affecting their academic progress.
70
Males Females
60
50
% 40
30
20
Figure 3. Factors affecting academic 10
progress for participants who had not
passed all subjects, by gender (%)
0
ts
s
s
ity
s
k
nt
en
d
s
m
m
ltie
am
or
te
en
re
rs
os
le
le
w
ec
icu
ffe
ive
itm
ex
ob
ob
ch
xp
h
di
un
iff
uc
m
d
pr
pr
as
ye
ld
ile
ng
m
m
by
p
th
tw
he
cia
Fa
co
hi
hi
o
al
d
To
ns
et
ec
tt
an
He
te
&
m
ha
bj
tio
or
Fin
dy
so
su
tw
la
pp
stu
re
do
ng
su
No
or
g
ro
un
to
cin
tw
ily
d
lt
an
am
te
Fe
gh
an
al
,f
ou
sb
W
al
Th
on
ltie
rs
cu
Pe
ffi
Di
National Tertiary Student Wellbeing Survey 2016 15Overall, very few students reported no academic stress, and 64.2% of students found academic
Figure 4 experiences in general to be ‘very’ or ‘extremely stressful’. Figure 4 shows the level of academic
stress reported for different academic activities. Students reported exams, oral presentations,
and group assessments as the most stressful, with many reporting them as ‘extremely stressful’
(47.8%, 38.6%, and 33.3%, respectively). Lectures were by far the least stressful academic
experience.
Group assessments
Group work
Exams
Oral presentations
Written assignments
Tutorials
Lectures
Academic stress - Total
0 10 20 30 40 50 60 70 80 90 100
%
Not at all stressful Mildly stressful Moderately stressful Very stressful Extremely stressful
Figure 4. Level of distress for academic activities (%)
Gender differences were evident in relation to each academic stressor and academic stress
overall, with females always more likely to report greater stress. Table 3 shows that both males
and females found exams to be most stressful, but females next reported oral presentations,
whereas males reported group assessments as the second most stressful experience.
Table 3. Mean stress scores for each academic stressor, by gender
ACADEMIC STRESSOR MALES M (SD) FEMALES M (SD) t
Academic stress - Total 3.48 (0.79) 3.80 (0.71) 8.92**
Stress – Exams 3.89 (1.12) 4.20 (0.98) 6.23**
Stress – Oral Presentations 3.37 (1.29) 3.93 (1.15) 9.63**
Stress – Group Assignments 3.58 (1.18) 3.85 (1.03) 5.12**
Stress – Written Assessments 3.28 (1.08) 3.68 (1.00) 8.52**
Stress – Group Work 3.15 (1.22) 3.41 (1.18) 4.66**
Stress - Tutorials 2.40 (1.06) 2.65 (1.05) 5.09**
Stress - Lectures 1.79 (0.93) 1.95 (0.97) 3.54**
Note. Scale ranges from 1-5 with higher scores indicating greater stress rating, **p < .001.
16 National Tertiary Student Wellbeing Survey 2016Financial Issues
The majority (82.4%) of young adult students earn less than $400 per week. There was 47.2% of
females and 35.0% of males who reported that they constantly experienced financial stress while
they were at university. One in ten (10.6%) report that it is very difficult to meet daily living needs
with the income they are on and another almost one in four report that it is difficult (22.4%); two-
thirds state is it manageable or very manageable to meet their daily living needs (66.9%). Women
were slightly more likely to experience financial difficulty than men (34.2% vs 28.5%). Overall,
Figurethree-quarters
5 (75.2%) defer all their fees. Figure 5 shows the percentage of male and female
students within earning each income bracket.
25
20 Females Males
15
%
10
5
Figure 5. Weekly income, by
gender (%) 0
I do not have $100 or under $100-$149 $150-$199 $200-$299 $300-$399 $400-$499 $500-$599 $600+
an income
Income
Figure 6 presents the term course-related costs incurred in the past academic term. About
Figureone-quarter
6 reported substantial costs above $500 for the term. These costs include textbooks,
stationary, other materials, travel, and professional association fees.
30
25 Females Males
20
%
15
10
5
Figure 6. Course-related costs in the
last academic term, by gender (%) 0
Less than $50 $50-$100 $100-$199 $200-$299 $300-$399 $400-$499 $500+
Term costs
National Tertiary Student Wellbeing Survey 2016 17FigureFigure
7 7 shows parking/travel costs, specifically, which are a substantial weekly commitment for
most students. Around half pay $20 or more per week just in parking/travel.
35
30 Females Males
25
20
%
15
10
5
Figure 7. Parking/travel costs per
week, by gender (%) 0
Less than $10 $10-$19 $20-$29 $30-$39 $40-$99 $100+
Parking/travel costs
Other course-related costs are presented in Table 4, which shows that the main costs are
textbooks, stationary, travel and printing. Notably, 56.4% have foregone buying textbooks due
to the cost.
Table 4. Course-related costs incurred and foregone, by gender (%)
COST INCURRED FOREGONE
Males Females All Males Females All
Textbooks 85.4 87.7 86.8 55.6 56.5 56.5
Stationary 81.6 87.7 86.1 13.5 15.4 15.3
Travel to uni 80.3 84.5 83.5 14.0 15.1 15.1
Printing 77.7 78.8 78.4 19.8 23.8 23.3
Lab coats/uniforms 20.8 31.4 28.4 2.2 2.7 2.5
Travel to placements 19.8 31.4 28.1 3.2 2.1 2.4
Record check (criminal, WWVP) 10.7 25.0 21.0 1.3 0.9 1.0
Sport facilities 18.2 16.3 16.7 7.7 6.5 6.8
Special software 19.0 13.2 14.8 7.2 6.5 6.8
Field trips 10.0 11.9 11.5 2.0 3.9 3.4
Art materials 7.2 9.4 9.2 2.9 3.8 3.7
Conferences 9.1 7.8 8.3 4.8 5.8 5.5
Professional association fees 5.9 6.6 6.6 1.9 2.7 2.5
18 National Tertiary Student Wellbeing Survey 2016Mental Health Issues
Perceived mental health and health status
A substantial two-thirds (67.3%) of students rated their mental health as only fair or poor, which
compared with a much lower 39.3% who negatively rated their physical health. Notably, there was
a third (33.0%) who rated their mental health as poor – the lowest rating – compared with 10.4%
for physical health (see Figure 8).
Gender differences were observed in mental health ratings (see Figure 9), with males (M = 2.4)
Figure 8 reporting significantly more positive mental health ratings on average than females (M = 2.0) on a
scale of 1-5, t (848.24) = -5.638, p < .001.
38.8
34.3
33
28.9
20.8 17.8
10.4
8.8 4.1
Figure 8. Rating of mental health
and physical health (%) 3.1
Poor Fair Good Very good Excellent
Mental health rating Physical health rating
Figure 9
35.2
34
31
26.9
22.9
20.9
12.9
6.4
7.9
Figure 9. Mental health ratings, 2
by gender (%)
Poor Fair Good Very good Excellent
Males Females
National Tertiary Student Wellbeing Survey 2016 19Psychological distress
Overall, 65.2% of students reported high or very high levels of psychological distress on the 10-
item Kessler Psychological Distress Scale (see Figure 10). This compares with 20% of females
and 11% of males aged 18-24 in the general population who reported high or very high levels
of psychological distress in the 2014-15 national health survey (ABS, 2015). Gender differences
Figure 10
were evident for the students, with females (M = 26.2) reporting significantly higher levels of
psychological distress than males (M = 24.1), t (2251) = 4.89, p < .001.
Males Females
36.7
30.5
27.9 28.3
24.2
19.6 20.3
12.5
Figure 10. Levels of psychological
distress, by gender (%)
Low Moderate High Very High
Mental health problems affecting studies
Only 1.6% of students reported that there were no symptoms of mental health problems that
impacted their studies in the past year. The percentage who reported each type of mental health
problem as affecting their studies is reported in Figure 11. The main factors affecting study were
Figure 11feeling stressed (83.2%), low motivation (82.1%), feeling anxious (79%), and low mood (75.7%).
An alarming 35.4% of students reported thoughts of self-harm or suicide affected their studies.
Females were more likely than males to report an influence of each mental health issue.
90
80 Males Females
70
60
% 50
40
30
20
10
Figure 11. Mental health issues
affecting studies, by gender (%)
0
d
n
ty
d
ng
lity
s
s
c
s
e
es
ge
ni
es
cid
tio
se
oo
ie
i
bi
Pa
ep
sn
bn
x
es
an
iva
m
ui
ita
An
sle
s
/s
str
m
ch
w
ot
le
Irr
m
Nu
Lo
m
pe
g
e
d
ar
in
bl
oo
w
Ho
h
el
ou
Lo
M
lf-
Fe
Tr
Se
20 National Tertiary Student Wellbeing Survey 2016Days out of role
Students reported the number of days out of role, when they could not perform their usual work
or study activities, in the past 4 weeks, due to mental health issues that were affecting their
studies (see Figure 12). There were 71.8% who reported that there had been at least one day
Figure 12 when they were totally unable to work or study due to symptoms of mental health problems in the
past month. Gender differences were also observed, and females (M = 3.72) reported significantly
more days out of role due to mental health issues compared with males (M = 3.21), t (2261) =
4.721, p < .001.
15.7
13.6
12
11.4 14.8
10.4
12.3
9.3 7.7
8.5
7.6
Figure 12. Number of days out of role 4 1.8
in the past four weeks due to mental
health problems, by gender (%) 2.7
1.4
1 day 2 days 3 days 4 days 5-9 days 10-14 days 15-20 days 21-28 days
Males Females
National Tertiary Student Wellbeing Survey 2016 21Study-related factors affecting mental health
Figure 13 presents the study-related factors reported to affect mental health and wellbeing, by
Figure 13gender. The two most common factors reported were academic workload stressors: workload
and deadlines (79.5%); and balancing study and other commitments (76.8%). Next most common
was personal, family or relationship problems (69.5%).
90
80 Males Females
70
60
% 50
40
30
20
Figure 13. Student-related factors 10
affecting mental health and
wellbeing, by gender (%)
0
es
ts
s
n)
ce
es
d
es
es
t
s
en
m
ltie
te
en
io
in
an
ur
di
di
le
m
la
vis
icu
dl
stu
stu
itm
ss
ob
rm
iso
oy
ea
re
re
iff
m
pr
pl
rfo
g
g
g
/d
lp
ld
ng
rin
rin
om
em
in
p
pe
ad
cia
cia
hi
di
el
du
du
rc
e
ns
clu
fe
klo
ic
So
an
at
g
g
he
m
tio
s,
in
in
kin
or
du
Fin
de
es
ot
s(
nt
la
w
ra
or
ca
lin
re
hu
d
am
se
W
tg
an
ne
/a
or
b
ur
Ex
ou
Jo
es
Lo
dy
ily
Co
ab
ad
stu
am
Gr
ns
,f
g
er
in
al
nc
nc
on
la
Co
rs
Ba
Pe
22 National Tertiary Student Wellbeing Survey 2016Alcohol and other drug use
About two-thirds of students (68.1%) reported some form of substance use in the previous three
months. Overall, there were 64.6% who had consumed alcohol at a risky level (4 or more drinks
in a session), 17.9% used tobacco products, 11.1% used prescription drugs for non-medical
reasons, and 16.7% used illicit drugs. Figure 14 shows the percentage reporting use of each
substance at different levels. Alcohol was most likely to be consumed one or twice, monthly or
Figure 14 weekly, whereas tobacco was most likely to be used on a daily basis. Prescription and illicit drugs
were most likely to be used monthly, or once or twice. Gender differences were evident, with
males significantly more likely to report each type of substance use compared with females.
21.8 21.4
19.1
7.4
5.9
5.2 5.1
4.4 2.7
4.5 2.5 2.3
Figure 14. Alcohol and other drug use
3.1 1.5
2.4
in the past 3 months (%) 1.1
Once or twice Monthly Weekly Daily or almost daily
Alcohol (4 or more drinks in a day) Tobacco products
Prescription drugs for non-medical reasons Illicit drugs
National Tertiary Student Wellbeing Survey 2016 23Service Use For Mental Health Problems
There was a high level of service use for mental health problems evident among the sample,
with two-thirds (64.9%) having sought help from a mental health professional at some point in
their lives for a personal or emotional problem. A quarter (24.5%) were currently seeing a mental
health professional, a fifth (20.3%) had seen a mental health professional in the past 12 months,
and another fifth (20.2%) had seen a mental health professional more than 12 months ago. There
were, however, 826 young people who had never seen a mental health professional, and of these
only about a third (n = 287, 34.7%) reported that mental health help did not apply to them.
Campus counselling and medical services
There were 27.0% of young people who had accessed on-campus counselling services in the
past 12 months and 27.8% who had accessed on-campus medical services. Females were
significantly more likely than males to use both counselling (27.1% vs 22.9%) and medical services
(29.1% vs 24.4%).
Figure 15
Wait times were somewhat longer for counselling compared with medical services, although two-
thirds reported waiting less than a week for their counselling appointment (see Figure 15). A third
(33.5%) of those who had sought counselling services reporting having to wait more than a week
compared with only 11.2% using medical services.
33.5
30.6
24.3
20.8
24.1
19 13.8
13.1
11.2
9.6
Figure 15. Wait times for campus
counselling and medical services (%)
3 hours or less One day 2-4 days 5-7 days More than one week
Campus Counselling Campus Medical
24 National Tertiary Student Wellbeing Survey 2016Figure 16 Students reported a somewhat more positive experience of medical compared with counselling
services on-campus. Experience of services was rated on an 11-point scale from very negative
to very positive. Figure 16 shows the percentage reporting each rating by type of service. On
average, counselling services were given a rating of 6.04 (SD = 2.77) and medical services a rating
of 7.11 (SD = 2.36) out of a possible score of 10.
19.7
17
18.2 17.9
13.7 13.4
13.5 13
11.1
10.8
6.8
6
8.3
4.5 4.3 6.9
2.4
4
3.5
Figure 16. Rating of campus 2.7
counselling and medical services (%) 1.6
0.8
Very Neither Very
negative negative positive
or positive
Campus Counselling Campus Medical
headspace
There was a very high level of awareness of headspace, with 85.9% of students having heard
about headspace. Of those who were aware of headspace, 33.3% had used a headspace
service (including accessing the website). There were 28.3% who had visited the headspace
website, 6.9% had received help through eheadspace, and 10.4% had visited a headspace
Figure 17
centre. Figure 17 shows the gender differences in use of headspace services, with females more
likely to access the website or visit eheadspace.
35
30 Males Females
25
20
%
15
10
5
Figure 17. Use of headspace
services, by gender (%) 0
Accessed the Received help online or Visited a headspace centre
headspace website by phone through eheadspace
National Tertiary Student Wellbeing Survey 2016 25Online services
Overall, 52.5% of students searched the internet or used online services (including eheadspace,
ReachOut, Beyond Blue) to get help or information about mental health problems. There were
44.1% who used online services to get information about mental health issues, 30.0% who used
online assessment tools (such as filling out a questionnaire), 7.2% used a chat room or support
Figure 18 group, 7.6% used online personal support or counselling, 13.8% used online self-help, and 14%
accessed information about services in the community. Figure 18 shows that females were more
likely than males to use each type of online option for mental health support.
50
45
Males Females
40
35
30
%
25
20
15
10
Figure 18. Use of different online 5
services for mental health support in
the past 12 months, by gender (%)
0
Information Online Chat room or Online personal Online self-help Information
about mental assessment tools support group support or about services
health issues counselling in the community
26 National Tertiary Student Wellbeing Survey 2016Barriers to mental health care
In terms of barriers to seeking help for mental health issues, there were only 409 (15.5%) who
stated they definitely did not need any sort of mental health care help in the previous 12 months.
Of those who did recognise a potential need for help, Figure 19 presents the percentage who
reported different types of barriers that kept them from getting the mental health help they
needed. The two most common barriers were wanting to sort out the problem themselves (most
Figure 19prevalent for males) and not being sure if they needed help (most prevalent for females). Next
most common was thinking that the problem would get better by itself. About one in five were,
however, too embarrassed to ask for help.
50
45 Males Females
40
35
30
%
25
20
15
10
Figure 19. Barriers to seeking 5
professional help for mental health
issues, by gender (%) 0
n
s
lp
p
lp
k
r
p
lf
h
ge
nd
in
tse
w
el
el
he
he
uc
th
yo
th
rh
an
ie
yi
m
d
ld
ht
/fr
ge
fo
str
m
rb
de
ou
o
ig
ily
to
k
on
to
ee
te
a
m
as
w
m
st
et
ith
re
In
g
le
m
fa
co
to
tb
in
he
tw
op
le
if
ith
ed
yth
ge
ht
ob
w
e
pe
ti
w
ig
ur
ss
an
ou
pr
e
ld
m
m
er
ts
ur
rra
ou
ab
he
nk
le
th
ts
it
n'
ba
w
ob
to
ht
tt
as
hi
n'
lk
em
m
ou
tt
ug
ta
pr
as
ha
Iw
n'
le
ho
Iw
o
he
tw
rt
id
o
ob
tt
so
to
It
Id
tt
an
ou
pr
ou
as
to
tw
ab
e
Iw
d
th
rt
te
n'
so
d
at
an
rie
id
th
to
Id
or
Iw
ht
d
w
te
ug
as
an
ho
Iw
Iw
It
National Tertiary Student Wellbeing Survey 2016 27Mature Adults: 26-50+ Years
Demographic Characteristics
There were 652 Australian university or TAFE students aged between 26-50 years (M = 34.32,
SD = 8.079). The majority were female (68.5%), with 28% male, and 3.5% identifying as gender
diverse, intersex, indeterminate or other. Due to the small number of students who were non-
binary, gender differences are examined in the results comparing males and females only.
Most of the students were undergraduate (56.9%), full-time students (62.9%), and from a major
city in Australia (79.7%). There were 28.0% in their first year of academic study, with the remainder
being in a subsequent year.
Culturally, very few were international students (10.9%). There were 3.2% who identified as
Aboriginal or Torres Strait Islander (ATSI); 11.8% were ethically, culturally or linguistically diverse
(CALD). There were 21.8% with lived experience with a disability; and 16.4% who identified
as LGBTIQ.
Most (81.3%) had somewhere secure to live, but accommodation is an issue for 18.7% of
students. There were 45.6% living at home with their partner and/or children, 24.2% house-
sharing off campus, and 13.3% living alone off campus.
There were 44.6% who found it difficult or very difficult to meet their living needs with the income
they are on. Of these students, 42.9% had an income of less than $300 per week and 19.8%
were not in employment; 42.9% of students received some form of Government income support.
28 National Tertiary Student Wellbeing Survey 2016Academic Issues
The majority of students spent between 0-10 hours in face-to-face contact each week. There
Figure 20 were 65.4% who had some online contact each week. There was no association between amount
of face-to-face and online contact. Figure 20 shows the percentage of students with different
contact hours for both face-to-face and online class contact.
40
35 F2F Online
30
25
%
20
15
10
5
Figure 20. Contact hours per week,
face-to-face and online (%)
0
0 1 to 5 6 to 10 11 to 15 16 to 20 21 to 25 26+
Hours
Most students (67.4%) had passed all subjects to date. Figure 21 shows the problems
experienced with academic progress, by gender. There were 10.8% who reported they had failed
one subject and 11.1% who had failed multiple subjects. There were 7.0% who had been placed
on academic probation. A gender difference was evident, whereby males (M = 1.3) reported
Figure 21
significantly more academic progress problems than females (M = 0.92), t (222.791) = -2.168,
p < .05. Over a quarter of both males and females had considered leaving their course of study.
30
25 Males Females
20
%
15
10
5
Figure 21. Problems experienced with
academic progress, by gender (%) 0
se
re
ts
t
ts
re
ce
n
t
e
se
ec
en
us
io
ec
en
lu
ilu
ur
an
ur
bj
at
m
ca
ai
bj
m
fa
co
co
su
rm
ob
ss
tf
su
ss
ow
ith
se
g
ve
ou
pr
rfo
e
se
vin
le
on
w
a
as
sh
ith
ic
pe
tip
as
le
a
ts
em
d
w
e
to
le
ul
to
ec
ile
ic
le
on
m
ts
m
d
ad
d
tip
bj
Fa
ed
re
ke
ec
d
de
d
su
ac
ul
rc
ile
e
ile
bj
as
m
ca
id
fo
ed
Fa
su
on
Fa
ns
en
ta
d
en
u
ile
d
Co
ed
in
be
ou
ue
Be
Fa
nt
ac
ab
tin
ve
so
Pl
Ha
on
Di
ng
sc
ni
Di
ar
W
National Tertiary Student Wellbeing Survey 2016 29Those who had not passed all subjects were asked about the factors that had affected their
problems with academic progress (n=196), and these are presented in Figure 22. A substantial
63.9% reported difficulties balancing study and other commitments as the most common
Figure 22
factor, followed by health problems (50.0%). Notably 45.3% cited financial difficulties as a factor
affecting their academic progress and almost half the students (47.8%) rated personal, family or
relationship problems as a factor affecting their academic progress.
80
70 Males Females
60
50
%
40
30
20
Figure 22. Factors affecting
academic progress for participants 10
who had not passed all subjects, by
gender (%)
0
ts
s
s
s
ity
s
k
ds
d
s
nt
m
m
ltie
ue
am
or
te
en
re
rs
an
le
le
w
ec
iss
icu
ffe
ive
itm
ex
ob
ob
m
xp
h
di
iff
un
lity
uc
de
m
d
pr
pr
ye
ld
ile
ng
m
m
bi
by
th
p
er
he
cia
Fa
sa
co
hi
hi
o
al
re
d
To
ns
et
tt
Di
an
He
Ca
te
&
m
ha
tio
or
Fin
dy
so
tw
la
pp
stu
re
do
su
No
or
g
un
to
cin
ily
d
lt
an
am
te
Fe
an
al
,f
sb
W
al
on
ltie
rs
cu
Pe
ffi
Di
30 National Tertiary Student Wellbeing Survey 2016Overall, very few students reported no academic stress, and 54.8% of students found academic
Figure 23
experiences in general to be ‘very’ or ‘extremely stressful’. Figure 23 shows the level of
academic stress reported for different academic activities. Students reported exams, group
assessments, and oral presentations as the most stressful, with many reporting them as
‘extremely stressful’ (39.0%, 32.7%, and 32.1%, respectively). Lectures were by far the least
stressful academic experience.
Group assessments
Group work
Exams
Oral presentations
Written assignments
Tutorials
Lectures
Academic stress - Total
0 10 20 30 40 50 60 70 80 90 100
%
Not at all stressful Mildly stressful Moderately stressful Very stressful Extremely stressful
Figure 23. Level of distress for academic activities (%)
Gender differences were evident in relation to most academic stressors and academic stress
overall, with females always more likely to report greater stress. Table 5 shows that both males
and females found exams to be most stressful, but females next reported oral presentations,
whereas males reported group assessments as the second most stressful experience.
Table 5. Mean stress scores for each academic stressor, by gender
ACADEMIC STRESSOR MALES M (SD) FEMALES M (SD) t
Academic stress - Total 3.31 (0.89) 3.64 (0.81) 4.08**
Stress – Exams 3.58 (1.21) 3.93 (1.13) 3.17*
Stress – Oral Presentations 3.23 (1.33) 3.73 (1.18) 2.72*
Stress – Group Assignments 3.38 (1.29) 3.70 (1.21) 5.12**
Stress – Written Assessments 3.31 (1.13) 3.62 (1.03) 3.08*
Stress – Group Work 3.06 (1.28) 3.40 (1.26) 2.82*
Stress - Tutorials 2.13 (1.04) 2.29 (1.12) 1.52
Stress - Lectures 1.75 (0.94) 1.79 (0.95) 0.44
Note. Scale ranges from 1-5 with higher scores indicating greater stress rating, **p < .001, *p < .05.
National Tertiary Student Wellbeing Survey 2016 31You can also read