Stress & wellbeing HOW AUSTRALIANS ARE COPING WITH LIFE - Heads Up

Page created by Ben Zimmerman
 
CONTINUE READING
Stress & wellbeing HOW AUSTRALIANS ARE COPING WITH LIFE - Heads Up
Stress & wellbeing
      HOW AUSTRALIANS ARE COPING WITH LIFE
The findings of the
Australian Psychological
Society Stress and         PLUS
wellbeing in Australia
survey 2015

                             FoMO survey:
                             The impact of connectivity to social media
                             on teens and adults in Australian Page 30
Stress & wellbeing HOW AUSTRALIANS ARE COPING WITH LIFE - Heads Up
Stress & wellbeing
                    CONTENTS
                    List of tables								         3
                    List of figures								  3
                    1. Summary of findings							  4
                       1.1. Key findings for stress and wellbeing					  6
                       1.2. Key findings on Fear of Missing Out (FoMO)				  6
                    2.   Introduction								 
                                             7
                    3.   Methodology								 7
                       3.1. Survey participants/timeframe					 	  7
                       3.2. The survey							  7
                       3.3. Focus and rationale in 2015					 	  8
                       3.4. Data analysis							10
                       3.5. Demographic variables						                              10
                       3.6. Life stage segment variables					 	                      11
                       3.7. Cross-year data		 					                                  11
                       3.8. Between-group comparisons 						                         12
                       3.9. Prevalence percentage						12
                       3.10. Data presentation, significance and subsample sizes				 12
                       3.11. The report							                                       12
                    4.   Five years of stress and wellbeing						                                        13
                       4.1. Across five years in Australia						                                          13
                       4.2. Prevalence of levels of distress, depressions symptoms and anxiety symptoms		 14
                       4.3. Causes of stress							                                                       15
                       4.4. Stress management							                                                      17
                      	     4.4.1. How do we manage stress?					                                          17
                      	     4.4.2. How effective are our stress management activities/behaviours?		       17
                      	     4.4.3. Relationship between ways of managing stress and experience of
                    	     distress, anxiety and depressions symptoms				                                  20
                      	     4.4.4. How do we seek help for stress?					                                   21
                      	     4.4.5. How do we think stress affects us?				                                 22
                       4.5. Wellbeing								22
                      	     4.5.1. Across five years in Australia					                                    22
                      	     4.5.2. By age							                                                          23
                      	     4.5.3. By living arrangements						                                           24
                      	     4.5.4. By level of education						                                            24
                      	     4.5.5. By primary employment						                                            25
                      	     4.5.6. By annual income						                                                 25
                      	     4.5.7. Workplace wellbeing						                                              26
                    5.   Stress and wellness in 2015						                                               27
                       5.1. Causes of stress in 2015						                                               27
                       5.2. Wellness in 2015							                                                      28
                    6.   Special topic: FoMO							30
                      6.1.    Key findings							                                                        30
                       6.2.   Teen social media use						                                                30
                       6.3.   Teen social media experience						                                         33
                       6.4.   Teen FoMO							                                                           34
                       6.5.   Adult social media usage						                                             36
                       6.6.   Adult social media experience						                                        38
                       6.7.   Adult FoMO							                                                          38
                    References								                                                                   41
                    Acknowledgements								                                                             41
                    Appendix A: Sample statistics							                                                 42
                    Appendix B: Measuring stress, distress, depression and anxiety				                   43

2   Australian Psychological Society Stress and wellbeing in Australia survey 2015
Stress & wellbeing HOW AUSTRALIANS ARE COPING WITH LIFE - Heads Up
TABLES
Table 1: 	  Sample Sizes for Main Survey and Standalone FoMO Survey					  8
Table 2: 	  Sample Proportions for Teen Connection to Social Media					  9
Table 3: 	  Sample Proportions for Adult Connection to Social Media					  9
Table 4: 	  Sample Sizes for Teen Gender								                                      10
Table 5: 	  Sample Sizes for Teen Age Group							                                    10
Table 6: 	  Sample Sizes for Adult Gender								                                     10
Table 7: 	  Sample Sizes for Adult Age Group							                                   11
Table 8: 	  Life Stage Segments and Criteria for 2015						                           11
Table 9: 	  Sample Sizes by Survey Year								                                       11
Table 10:    Workplace Wellbeing								                                              26
Table 11:    Wellness Prevalence by Gender, 2015							                               29
Table 12:    Wellness Prevalence by Age Group, 2015							                            29
Table 13:    Social Media Average Usage by Teens During Periods of the Day, 2015				  32
Table 14:    Social Media Average Usage by Adults During Periods of the Day, 2015				 37
Table 15:    Prevalence of FoMO by Age Group, 2015							                             39
Table 16:    Gender of Survey Participants in 2015							                             42
Table 17:    Location of Survey Participants in 2015							                           42
Table 18:    Age Group of Survey Participants in 2015						                           42

FIGURES
Figure 1:    Aggregate Measures of Stress, Distress, Depression and Anxiety, 2011-2015			                 13
Figure 2:    Average Kessler Psychological Distress Scale (K-10) Category Prevalence, 2011-2015		         14
Figure 3:    Average DASS-21 Depression Scale Category Prevalence, 2011-2015				                          14
Figure 4:    Average DASS-21 Anxiety Scale Category Prevalence, 2011-2015				                             15
Figure 5:    Prevalence of Stressors, 2011-2015							                                                    16
Figure 6:    Ways of Managing Stress %, 2011-2015							                                                  18
Figure 7:    Prevalence % vs Effectiveness % of Stress Management, 2011-2015				                          19
Figure 8:    Stress Reliever % by K10 Distress Category						                                             20
Figure 9:    Stress Reliever % by DASS-21 Depression Category						                                       20
Figure 10:   Stress Reliever % by DASS-21 Anxiety Category						                                          21
Figure 11:   Prevalence % of Help Sought to Manage Stress, 2011-2015					                                 21
Figure 12:   Perceived % Impact of Stress on Physical Health						                                        22
Figure 13:   Perceived % Impact of Stress on Mental Health						                                          22
Figure 14:   Mean Wellbeing Score, 2011-2015							                                                       23
Figure 15:   Wellbeing Score by Age Group, 2011-2015						                                                23
Figure 16:   Average Warwick-Edinburgh Mental Wellbeing Score by Level of Education, 2011-2015		          24
Figure 17:   Average Warwick-Edinburgh Mental Wellbeing Score by Primary Employment, 2011-2015		          25
Figure 18:   Average Warwick-Edinburgh Mental Wellbeing Score by Income, 2011-2015			                     25
Figure 19:   Prevalence of Stressors, 2015								                                                        27
Figure 20:   FoMO for Heavy Social Media Users, 2015						                                                31
Figure 21:   Time Spent Connected to Social Media by Teens Age-Band and Gender, 2015			                   32
Figure 22:   Attitudes Toward Social Media Use in Teens, 2015						                                       33
Figure 23:   Prevalence of ‘FoMO’ by Frequency of Social Media Usage in Teens, 2015 heavy vs light		      35
Figure 24:   Time Spent Connected to Social Media by Adults and Gender, 2015				                          36
Figure 25:   Time Spent Connected to Social Media by Adults Age Group, 2015				                           37
Figure 26:   Social Media Experience in Adults, 2015							                                               38
Figure 27:   Prevalence of FoMO by Frequency of Social Media Usage in Adults, 2015				                    40

                                                    Australian Psychological Society Stress and wellbeing in Australia survey 2015   3
Stress & wellbeing HOW AUSTRALIANS ARE COPING WITH LIFE - Heads Up
Stress & wellbeing
                    1. SUMMARY OF FINDINGS
                    The Australian Psychological Society (APS) has conducted its fifth successive
                    national Stress and wellbeing in Australia survey. This year the survey also
                    examined the impact of social media on Australians’ wellbeing and behaviour
                    as well as exploring their experience of the Fear of Missing Out (FoMO)1.

                    1.1. Key findings for stress and wellbeing
                    The half decade snapshot shows that Australians are faring worse than they were in 2011 when the survey
                    began, reporting lower levels of wellbeing and workplace wellbeing and higher levels of stress, depression and
                    anxiety symptoms.

                    Australians’ levels of wellbeing have fluctuated over the five years. A slight improvement was recorded in 2014
                    and 2015 but wellbeing still remains lower than that in 2011 when the APS first surveyed Australians on this
                    important measure.

                    Interestingly, when Australians were asked in 2015 about their wellness across six key life domains (physical,
                    social, emotional, spiritual, intellectual and vocational wellness), they rated themselves as faring well across
                    these life areas. Key wellbeing findings over five years include:

                    •     Age: Younger people (18-25) have consistently reported lower levels of wellbeing than older Australians;
                    •     Employment status: The unemployed report the lowest levels of wellbeing whereas the retirees report the
                          highest levels of wellbeing;
                    •     Living arrangements: Australians living with a partner reported significantly higher levels of wellbeing
                          compared to all other groups (e.g. sole parents, living with parents, etc.);
                    •     Children: Those with children have higher levels of wellbeing than those without children; and
                    •     Education/Income: Wellbeing levels rise with education and income.

                    Key findings on other measures include:

                    •     35 per cent of Australians report having a significant level of distress in their lives;
                    •     26 per cent of Australians report above normal levels of anxiety symptoms;
                    •     26 per cent of Australians report having moderate to extremely severe levels of depression symptoms; and
                    •     In 2015, anxiety symptoms were the highest they have been in the five years of the survey.

                    Australians’ worries about money have not abated. Financial issues are rated as the top cause of stress over the
                    five years, while also of concern is the increase in the number of people turning to gambling to manage stress
                    (now one in five), growing from 13 per cent in 2011 to 19 per cent in 2015.

                    People who report higher levels of anxiety and depression symptoms and distress are more likely to gamble,
                    smoke cigarettes, drink alcohol and take recreational drugs:

                    •     Of those reporting severe levels of distress, 61 per cent drink alcohol, 41 per cent gamble, 40 per cent
                          smoke and 31 per cent take recreational drugs to manage stress;
                    •     Of those reporting extremely severe levels of depression symptoms, 57 per cent drink alcohol, 46 per cent
                          gamble, 41 per cent smoke cigarettes and 38 per cent take recreational drugs to manage stress; and

                    1 FoMO is defined as a pervasive apprehension that others might be having rewarding experiences that you are not part of, and is characterised
                    by the desire to stay continually connected with what others are doing (Przybylski, Murayama, DeHaan, & Gladwell, 2013)

4   Australian Psychological Society Stress and wellbeing in Australia survey 2015
Stress & wellbeing HOW AUSTRALIANS ARE COPING WITH LIFE - Heads Up
•
                    ‘              26 per cent of Australians report having
                                   moderate to extremely severe depression
                                   symptoms

     Of those reporting extremely severe levels of anxiety symptoms, 66 per cent drink alcohol, 54 per cent
     gamble, 47 per cent take recreational drugs and 45 per cent smoke cigarettes to manage stress.

The top five causes of stress in Australia over the five years are:

•    personal finances - 49 per cent;
•    family issues - 45 per cent;
•    personal health - 44 per cent;
•    trying to maintain a healthy lifestyle - 40 per cent; and
•    issues with the health of others close to us - 38 per cent.

The five most popular ways of managing stress in Australia over the five years are:

•    watching television/movies - 85 per cent;
•    focusing on the positives - 81 per cent;
•    spending time with friends and/or family - 81 per cent;
•    listening to music - 80 per cent; and
•    reading - 75 per cent.

Younger people (18-25) are significantly more likely than the older age groups to cite ‘environmental issues’ as
a cause of stress.

                                                   Australian Psychological Society Stress and wellbeing in Australia survey 2015   5
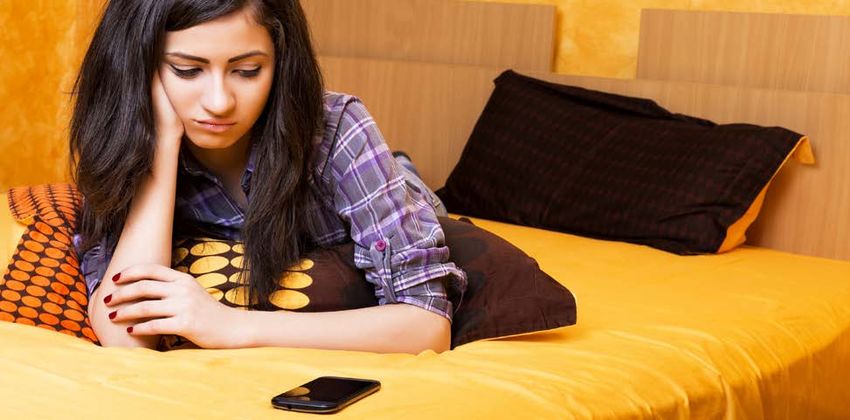
Stress & wellbeing HOW AUSTRALIANS ARE COPING WITH LIFE - Heads Up
Stress & wellbeing
                    1.2. Key findings on FoMO (Fear of Missing Out)
                    Of the Australians who responded to the FoMO Questionnaire, adults were spending 2.1 hours per day and
                    teens 2.7 hours per day connected to social media. This provides a direct comparison between adults and
                    teens.

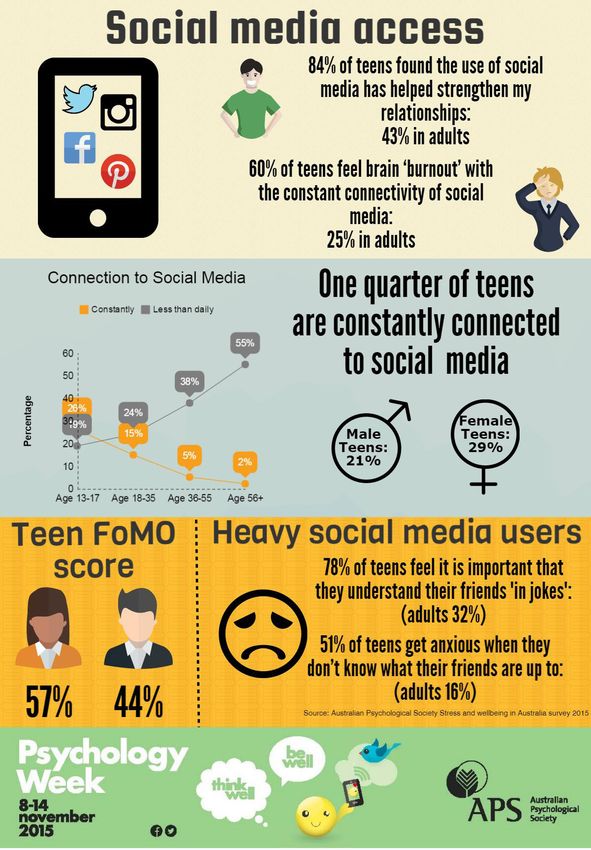
                    Social media is affecting how Australians behave, with 56 per cent of teens reporting they are heavy social
                    media users (connecting 5+ times per day), with 25 per cent being constantly connected.
                    When we look at the adult population - almost one in four (23%) report being heavy social media users, with six
                    per cent of those being constantly connected.

                    Social media is both a cause of stress and a means of managing stress.

                    •   More than one in 10 Australians (12%) report ‘issues with keeping up with social media networks’ as a
                        source of stress (2015)
                    •   More people are reporting using social media to manage stress, with almost one in two Australians now
                        reporting visiting social media sites to manage stress (37% in 2011 vs 51% in 2015)

                    Social media dominates the life of many teens.

                    •   Over half of Australian teens (53%) connect to social media 15 minutes before bed every night.
                    •   Almost two in five connect (37%) in the presence of others and within 15 minutes of waking up.
                    •   Almost one in four teens (24%) reported using social media when they were eating breakfast and lunch
                        seven days a week.

                    The impact of social media use on Australians’ wellbeing is evident in a range of ways: more than one in two
                    teens (57%) find it difficult to sleep or relax after spending time on social networking sites, and 60 per cent feel
                    brain ‘burnout’ from constant connectivity of social media.

                    Both Australian adults and teens experience Fear of Missing Out (FoMO): one in two teens and one in four
                    adults.

                    Teens connected to social media more frequently (five or more times a day, i.e. heavy users) are significantly
                    more likely to experience aspects of FoMO such as:

                    •   It is important that I understand my friends’ in-jokes (78%);
                    •   Fearing their friends are having more rewarding experiences than them (54%);
                    •   Worrying when they find out their friends are having fun without them (60%); and
                    •   Being bothered when they miss out on planned get-togethers (63%).

                    At the same time, not only do fewer adults report being constantly connected to social media (6%), they are also
                    less affected by FoMO than teens. For instance, of those adults connected to social media more frequently (five
                    or more times a day, i.e. heavy users):

                    •   It is important that I understand my friends in-jokes (32%;
                    •   Fearing their friends are having more rewarding experiences than them (26%);
                    •   Worrying when they find out their friends are having fun without them (17%); and
                    •   Being bothered when they miss out on planned get-togethers (31%).

                    When looking at the relationship between heavy social media use and FoMO, teens are significantly more likely
                    to experience all aspects of FoMO than adults. This suggests that social media has a greater impact on teens
                    and plays a role in their identity formation and their search for a sense of self.

6   Australian Psychological Society Stress and wellbeing in Australia survey 2015
Stress & wellbeing HOW AUSTRALIANS ARE COPING WITH LIFE - Heads Up
2. INTRODUCTION
This is the fifth year the Australian Psychological Society (APS) has conducted its ‘state-of-the-nation’ survey
on a representative sample of adult Australians to examine the levels of stress and wellbeing experienced in
the community. The assessment of stress and wellbeing levels generates key insights for understanding and
enhancing the psychological and physical health of Australians.

The survey findings are released during Psychology Week as a part of the APS’s commitment to promoting
community mental health awareness and psychological wellbeing. In the previous four years, the survey
included additional questions on a specific topic or aspect of stress and wellbeing to contribute to a special
feature.

The 2015 survey had three main aims:

•   To assess the stress and wellbeing of the Australian population five years on from the initial survey to allow
    year-on-year comparisons;
•   To gain insights into Australian adults’ experiences of social media and FoMO; and
•   To gain insight into the impact of social media usage and FoMO on Australian teens.

3. METHODOLOGY
3.1. Survey participants/timeframe
The Australian Psychological Society (APS), in conjunction with an online research company, conducted the
Stress and Wellbeing in Australia Survey with a representative sample of Australians. The national sample
(n=1521) comprised approximately equal numbers of men and women and was representative of the Australian
adult population (18 and above) for age, gender, geographical location and work status (matched on Australian
Bureau of Statistics [ABS]) as shown in Appendix A: Sample Statistics).

In addition to conducting the main survey, just under half the sample (n=740) completed an additional survey
relating specifically to social media usage and FoMO.

Further, a group of Australian teenagers aged 13 to 17 years (n=210) were recruited through parent panellists
of the online research company to allow us to understand Australian teens’ experience of social media and how
they compared with those of the adult population. The teen sample comprised equal numbers of boys (n=103)
and girls (n=103), with four (n=4) individuals not nominating a gender.

In total, 1,731 people completed the online survey, which was conducted over a two-and-a-half week period
from 14 August to 31 August 2015.

3.2. The survey
This year’s Stress and Wellbeing in Australia Survey included core questions present in the previous APS
surveys to enable year-on-year comparisons to be conducted. The questions incorporated standardised
measures of stress, wellbeing, anxiety and depression (please see Appendix B for details). A series of additional
questions from a separate survey examined Australians’ experience of FoMO, social media engagement and
behaviour.

                                                  Australian Psychological Society Stress and wellbeing in Australia survey 2015   7
Stress & wellbeing HOW AUSTRALIANS ARE COPING WITH LIFE - Heads Up
Stress & wellbeing

                 ‘               Social media in the context of this report is defined
                                 as the use of the internet and mobile technologies to
                                 turn communication into social interactive dialogue.
                                 It excludes activities like work texting and email

                    3.3.      Focus and rationale in 2015
                    The 2015 survey included an in-depth exploration of Australians’ experiences of social media usage and
                    the social, psychological and behavioural impact of the use of social media on their health and wellbeing.
                    Social media in the context of this report is defined as the use of the internet and mobile technologies to turn
                    communication into social interactive dialogue. It excludes activities like work texting and email.

                    Social media allow individuals access to increasingly abundant opportunities for interaction through real-time
                    information about the activities, events, and conversations happening across diverse social networks. However,
                    it contributes to the phenomenon of Fear of Missing Out (FoMO) which is defined as a pervasive apprehension
                    that others might be having rewarding experiences that you are not part of, and is characterised by the desire to
                    stay continually connected with what others are doing (Przybylski, Murayama, DeHaan, & Gladwell, 2013).

                    To align the content of our surveys on the topic of social media engagement and the concept of FoMO, we have
                    included the following validated and standardised instruments developed by Przybylski and colleagues (2013) in
                    this year’s survey:

                    •    The Social Media Engagement Questionnaire (SMEQ)
                    •    The FoMO Scale (FoMOs)

                    Overall, the sample sizes responding to each of the questionnaires were:

                    Table 1: Sample Sizes for Main Survey and Standalone FoMO Survey

                     Sample sizes                                                      Adult respondents       Teen respondents
                     Main Survey:
                     Stress and Wellbeing Survey                                            1521                      N/A
                     Sub-sample within Main Survey:
                     Social Media Engagement Questionnaire (SMEQ)                            1077                     N/A
                     Stand alone Survey following the Main Survey:
                     FoMO Questionnaire                                                      740                      210

8   Australian Psychological Society Stress and wellbeing in Australia survey 2015
Stress & wellbeing HOW AUSTRALIANS ARE COPING WITH LIFE - Heads Up
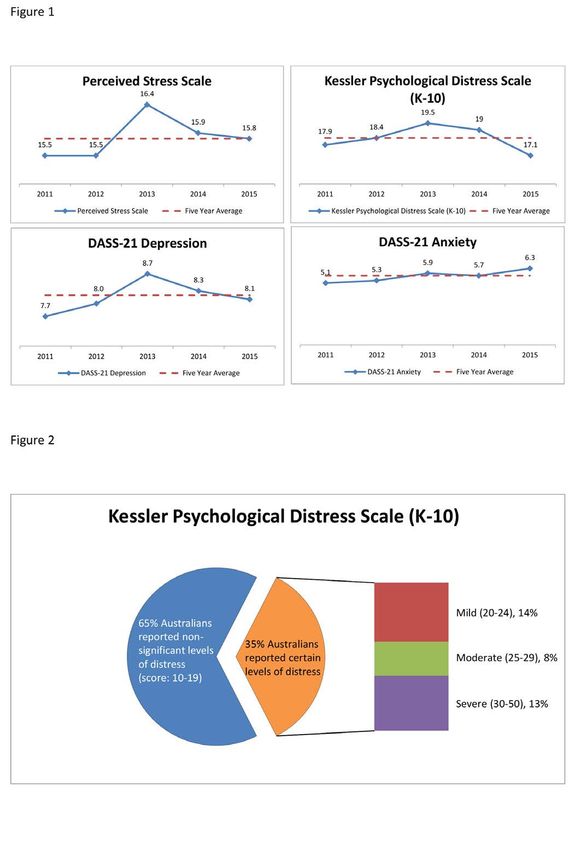
The following tables describe the FoMO sub-sample proportions used in this analysis. Heavy social media users
in this report are all those who connect to social media five or more times a day and light users are those who
connect to social media less than five times a day.

Table 2: Sample Proportions for Teen Connection to Social Media

 Teen Connection to Social Media                                                                   n             %
 (from FoMO Questionnaire
 Heavy Social Media User (n=118)                  Constantly                                       53           25%
                                                  More than 10 times per day                       25           12%
                                                  About 5 - 10 times a day                         40           19%
 Light Social Media User (n=92)                   About 1 - 4 times day                            50           24%
                                                  Several times a week                             31           15%
                                                  Once a week                                      10            5%
                                                  Once or twice a month                             0            0%
                                                  Less than once a month                            1            0%
 Total                                                                                            210          100%

Table 3: Sample Proportions for Adult Connection to Social Media

 Adult Connection to Social Media                                                                                 %
 (from FoMO Questionnaire
 Heavy Social Media User (n=170)                 Constantly                                                      6%
                                                 More than 10 times per day                                      5%
                                                 About 5 - 10 times a day                                       12%
 Light Social Media User (n=570)                  About 1 - 4 times day                                         36%
                                                  Several times a week                                          23%
                                                  Once a week                                                    9%
                                                  Once or twice a month                                          5%
                                                  Less than once a month                                         4%
 Total                                                                                                         100%

                                                            Australian Psychological Society Stress and wellbeing in Australia survey 2015   9
Stress & wellbeing HOW AUSTRALIANS ARE COPING WITH LIFE - Heads Up
Stress & wellbeing
                     3.4.      Data analysis
                     The data presented has been selected on the basis of a preliminary analysis of noteworthy findings. The
                     approach to data analysis in this report replicates the approach of previous years. Appendix B of this report
                     provides further information on specific scales, such as the derivation of summary scores.

                     3.5.      Demographic variables
                     Analyses were run for the total sample and across all key demographic variables and where sub-sample sizes
                     permitted. Preliminary analyses for various combinations of age, gender, employment and marital status
                     generated a number of significant findings, with sample sizes between all relevant groups and sub-samples
                     sufficient to permit reporting and inclusion in further data exploration. Where no significant findings were
                     uncovered for given groups or demographic variables, results were omitted from this report.

                     The following tables detail the demographic breakdowns used in this analysis.

                     Table 4: Sample Sizes for Teen Gender

                      Teen gender                                               n
                      Male                                                    103
                      Female                                                  103
                      No gender nominated                                      4
                      Total                                                   210
                     * Four individuals did not nominate a gender

                    Table 5: Sample Sizes for Teen Age Group

                      Teen age groups                                           n
                      13-15                                                   120
                      16-17                                                   90
                      Total                                                   210

                    Table 6: Sample Sizes for Adult Gender

                      Adult gender                                              n
                      Male                                                    705
                      Female                                                  813
                      No gender nominated                                      3
                      Total                                                  1521
                     * Three individuals did not nominate a gender

10   Australian Psychological Society Stress and wellbeing in Australia survey 2015
Table 7: Sample Sizes for Adult Age Group

 Adult age group                                               n
 18-25                                                       184
 26-35                                                       290
 36-45                                                       312
 46-55                                                       269
 56-65                                                       42
 66 and above                                                223
 No age nominated                                             3
 Total                                                      1521

3.6. Life stage segment variables
Where indicated, the analysis has been conducted to segment respondents into various life stage cohorts.
These cohorts have been generated from the data collected on respondents’ age and relationship/marital
status/living arrangements. The cohorts are shown in Table 8 (below):

Table 8: Life Stage Segments and Criteria for 2015

 Life stage segment                   Criteria                                                                        n
 Young singles (YS)                   Aged 18-35 without a partner                                                   109
 Young couples (YC)                   Aged 18-35 with a partner and no child(ren) under 18                           38
 Young families (YF)                  Aged 18-35 with a partner and child(ren) under 18                              209
 Young sole parents (YSP)             Aged 18-35 without a partner and child(ren) under 18                           65
 Older singles (OS)                   Aged 36-65 without a partner and child(ren) under 18                           119
 Older couples (OC)                   Aged 36-65 with a partner and no child(ren) under 18                           105
 Established families (EF)            Aged 36-65 with a partner and child(ren) under 18                              89
 Older sole parents (OSP)             Aged 36-65 without a partner and child(ren) under 18                           255
 Single retirees (SR)                 Aged 56 and above single and retired                                           145
 Couple retirees (CR)                 Aged 56 and above with a partner and retired                                   284

3.7. Cross-year data
To make comparisons between data gathered from 2011,                                  Table 9: Sample Sizes by Survey Year
2012, 2013, 2014 and 2015, either one-sample t-tests or
                                                                                          Year                   n
univariate ANOVAs (with Tukey’s HSD post hoc tests as year-
on-year samples were of equivalent sizes) were performed to                               2011                 1537
determine whether the mean levels of variables of interest                                2012                 1550
were significantly different at the 95 per cent confidence                                2013                 1548
level.                                                                                    2014                 1548

Table 9 (right) shows the sample sizes for each year used in                              2015                 1521
summary or comparison statistics:                                                         Total                7672

                                                       Australian Psychological Society Stress and wellbeing in Australia survey 2015   11
Stress & wellbeing
                     3.8.    Between-group comparisons
                     For comparisons between different groups (e.g. males/ females, different age groups, heavy/ light social
                     media users, etc.), a combination of parametric and non-parametric statistical techniques were applied. These
                     included omnibus F-tests for one-way ANOVAs for independent variables of interest (e.g. testing for effect of
                     age on level of wellbeing), and Games-Howell multiple comparison tests to test for sub-group differences (e.g.
                     segment differences), as this test does not assume equal variances nor equivalent sample sizes.

                     Analysing associations between nominal or categorical data involved Chi-square tests of independence (eg.
                     gender differences and strategies used to manage stress).

                     3.9.    Prevalence percentage
                     Unless otherwise indicated, prevalence percentage includes those participants who rated scale items as either,
                     ‘moderately well’, ‘quite well’ or ‘extremely well’, or ‘somewhat’, ‘quite a bit’, or ‘a great deal’.

                     3.10.     Data presentation, significance and sub-sample sizes
                     All the data in this report has been summarised and reduced for ease of reading and interpretation.
                     Percentages have been rounded to the nearest whole number. Mean values for stress and wellbeing scales have
                     been rounded to one decimal place. Where necessary and practicable, statistical significance is reported and
                     denoted by an asterisk (*) for differences between groups and an alpha level is given in either the footer of the
                     relevant table/ figure or in the text descriptor for the table/ figure. As a rule of thumb, significance will always be
                     indicated for the larger of two groups, indicating that a particular group is significantly larger than its comparator.

                     Sub-sample numbers are displayed in sections 3.3, 3.7 and 3.8 and these should be referred to where testing
                     for significant differences between groups occurs. Since not all questions in the survey are compulsory the sub-
                     samples may not always sum to the total sample (n).

                     3.11. The report
                     What follows is a report detailing the key findings and results from the 2015 Stress and Wellbeing in Australia
                     Survey and the FoMO Survey. The report is broken down into two key components:

                     1.   The review of the relevant results from five years of the survey along with multiple cross year comparisons;
                          with a supplementary evaluation of the 2015 results as a standalone examination; and
                     2.   The analysis of the special topic on social media and FoMO.

12   Australian Psychological Society Stress and wellbeing in Australia survey 2015
4. FIVE YEARS OF STRESS AND WELLBEING
4.1. Across five years in Australia
Australians’ levels of stress, distress, anxiety and depression were examined over the five years from 2011-
2015, with mixed results. While fewer Australians reported distress in 2015 (the lowest level recorded),
Australians’ anxiety and depression symptoms increased over the five years, with anxiety symptoms peaking in
2015. The results reported are within the normal range for each of the respective measures.

Figure 1: Aggregate Measures of Stress, Distress, Depression and Anxiety, 2011-2015

NOTE: Interpretation and scoring criteria for the PSDS, K10 and DASS-21 scales can be found in Appendix B.
Sample sizes: 2011 n=1537, 2012 n=1550, 2013 n=1548, 2014 n=1548, 2015 ne=1521. Total N=7672

                                                             Australian Psychological Society Stress and wellbeing in Australia survey 2015   13
(K-10)
                                                                                                                                         19.5
                                                                  15.9                                                                                     19
                                                                                    15.8                                18.4
                                                                                                      17.9
                           15.5        15.5                                                                                                                               17.1

                                  Stress & wellbeing
                           2011        2012            2013       2014              2015              2011             2012             2013              2014           2015

                                    Perceived Stress Scale       Five Year Average                          Kessler Psychological Distress Scale (K-10)          Five Year Average

                                       DASS-21 Depression                                                                  DASS-21 Anxiety
                                                                                                                                                                          6.3
                                                        8.7                                                                              5.9              5.7
                                                                                                      5.1               5.3
                                                                   8.3
                                         8.0                                         8.1

                            7.7

                     4.2. 2011Prevalence
                                   2012
                                         of2013
                                            various2014
                                                    levels of2015distress, depression
                                                                            2011   2012
                                                                                        symptoms,
                                                                                            2013
                                                                                                  and
                                                                                                   2014
                                                                                                        anxiety
                                                                                                            2015
                                                                                                                 symptoms
                                     DASS-21 Depression         Five Year Average                                      DASS-21 Anxiety              Five Year Average

                     Over the last five years (2011-2015), 35 per cent of Australians reported experiencing distress, 36 per cent
                     experienced depression symptoms and 26 per cent anxiety symptoms. Of those, 13 per cent experienced severe
                     levels of distress, 12 per cent severe to extremely severe depression symptoms and 11 per cent severe to
                     extremely
                      Figure 2 severe levels of anxiety symptoms.

                     Figure 2: Average Kessler Psychological Distress Scale (K-10) Category Prevalence, 2011-2015

                                               Kessler Psychological Distress Scale (K-10)

                                                                                                                                                   Mild (20-24), 14%
                                                      65% Australians
                                                      reported non-
                                                                                     35% Australians
                                                      significant levels
                                                                                     reported certain                                              Moderate (25-29), 8%
                                                      of distress
                                                                                     levels of distress
                                                      (score: 10-19)

                                                                                                                                                   Severe (30-50), 13%

                     NOTE: The percentages in the above figure represent the proportion of people falling into the predefined K10 Scale categories as
                     noted in the legend, ranging from normal to severe levels of distress.

                     Figure 3: Average DASS-21 Depression Scale Category Prevalence, 2011-2015

                     NOTE: The percentages in the above figure represent the proportion of people falling into the predefined DASS-21 Depression Scale
                     categories as noted in the legend, ranging from normal to extremely severe levels of depression symptoms.

14   Australian Psychological Society Stress and wellbeing in Australia survey 2015
Figure 4: Average DASS-21 Anxiety Scale Category Prevalence, 2011-2015

NOTE: The percentages in the above figure represent the proportion of people falling into the predefined DASS-21
Anxiety Scale categories as noted in the legend, ranging from normal to extremely severe levels of anxiety symptoms.

                                                                                                                                       The fourth
                                                                                                                                       most common
                                                                                                                                       cause of stress
                                                                                                                                       is ‘issues
                                                                                                                                       relating to
                                                                                                                                       maintaining
                                                                                                                                       a healthy
                                                                                                                                       lifestyle’

4.3. Causes of stress
The top stressors in the lives of Australians (see Figure 5 on the following page) have remained the same over
the life of survey. ‘Personal financial issues’, ‘health issues’, and ‘family issues’ have topped the survey year-on-
year. Interestingly, since 2012 when it was introduced as an item, the fourth most common cause of stress is
‘issues relating to maintaining a healthy lifestyle’.

In 2014, this topic was explored in-depth in the survey and many barriers to achieving a healthy lifestyle were
identified, such as unexpected life events, loss of motivation, expense and lack of time (for the full results,
please refer to the 2014 Stress and Wellbeing Survey report2).

2
    The 2014 full report is available on the APS website: https://www.psychology.org.au/Assets/Files/2014-APS-NPW-Survey-WEB-reduced.pdf

                                                               Australian Psychological Society Stress and wellbeing in Australia survey 2015       15
Stress & wellbeing
                           Figure 5: Prevalence of Stressors, 2011-2015

                                                                  Prevalence of Stressors (2011-2015)

                                                                                                                                               53 %
                                                                                                                                        48 %
                                 Personal financial issues (avg = 49%)                                                                        52 %
                                                                                                                                          49 %
                                                                                                                                    45 %
                                                                                                                                      45 %
                                                                                                                                      45 %
                                             Health issues (avg = 44%)                                                              43 %
                                                                                                                                   42 %
                                                                                                                                    44 %
                                                                                                                                     43 %
                                                                                                                                       46 %
                                             Family issues (avg = 45%)                                                                  47 %
                                                                                                                                      45 %
                                                                                                                                     43 %
                                                                           0%
                                                                                                                                40 %
                             ^Maintain a healthy lifestyle (avg = 40%)                                                           41 %
                                                                                                                               39 %
                                                                                                                               39 %
                                                                                                                                 41 %
                                                                                                                             38 %
                             Health of those close to you (avg = 38%)                                                        38 %
                                                                                                                            36 %
                                                                                                                            37 %
                                                                                                                     30 %
                                                                                                                      32 %
                                         Workplace issues (avg = 32%)                                                   34 %
                                                                                                                      32 %
                                                                                                                    31 %
                                                                                                                    31 %
                                                                                                                   28 %
                                             Relationships (avg = 31%)                                                 33 %
                                                                                                                    31 %
                                                                                                                    31 %
                                                                                                                    31 %
                                                                                                                26 %
                                             The economy (avg = 28%)                                            26 %
                                                                                                                   30 %
                                                                                                                26 %
                                                                                                            23 %
                                                                                                             25 %
                                      The political climate (avg = 25%)                                     24 %
                                                                                                                 29 %
                                                                                                             25 %
                                                                           0%
                                                                                                           21 %
                                           ^Mental health (avg = 23%)                                        24 %
                                                                                                           22 %
                                                                                                              25 %
                                                                                                                26 %
                                                                                                        21 %
                                         Friendship issues (avg = 25%)                                        25 %
                                                                                                                26 %
                                                                                                              25 %
                                                                                                    17 %
                                                                                                   16 %
                                      Environment issues (avg = 17%)                               16 %
                                                                                                     18 %
                                                                                                        20 %
     ^not asked in                                                                                 16 %
     2011                                                                                        13 %
                                              Study issues (avg = 16%)                               18 %
                                                                                                   16 %
     NOTE: In the figure                                                                             18 %
     above prevalence                                                                            15 %
     is classified as                                                                          13 %
     the percentage of                     Personal safety (avg = 14%)                          14 %
                                                                                                14 %
     respondents who                                                                            14 %
     indicated that a
     stressor affected                                                    0%           10%          20%           30%       40%         50%           60%
     them either
     ‘somewhat’, ‘quite
     a bit’ or ‘a great                                             2011        2012    2013      2014     2015         Average
     deal’.

16   Australian Psychological Society Stress and wellbeing in Australia survey 2015
4.4. Stress management
As well as highlighting what contributes to stress in our lives, the APS survey explores how people manage
stress and also identifies the stress management behaviours reported to be most effective.

4.4.1.   How do we manage stress?

The most popular ways of managing stress (see Figure 6 on the following page) have remained consistent
across the five years of the APS survey: ‘watching television or movies’, ‘focusing on the positives’, ‘spending
time with friends and/or family’, ‘listen to music’ and ‘reading’. There has been an increase over the five years
in the following as stress management behaviours (all figures as at 2015):

•   Eating - more than seven in 10 (66% in 2011 vs 75% in 2015);
•   Visit social media sites - one in two (37% in 2011 vs 51% in 2015);
•   Doing something relaxing (i.e. have a bath, go to a spa or have a massage) - close to one in two (31% in
    2011 vs 46% in 2015);
•   Video games - more than one in three (28% in 2011 vs 33% in 2015); and
•   Gambling - one in five (13% in 2011 vs 19% in 2015).

4.4.2.   How effective are our stress management activities and behaviours?

Across the five years the survey has been conducted the five most popular ways of managing stress (on
average) are also some of those rated the most effective (see Figure 7 on page 19), including:

•   Watching television or movies (85% prevalence; 73% effectiveness);
•   Spending time with friends and/ or family (81% prevalence; 83% effectiveness);
•   Focusing on the positives (81% prevalence; 79% effectiveness; first asked in 2012);
•   Listening to music (80% prevalence; 80% effectivenessfirst asked in 2012); and
•   Reading (75% prevalence; 78% effectiveness).

Note that even though ‘watch television or movies’ is the most popular way of managing stress it is not rated as
the most effective way to manage stress.

Of concern is that some of the non-productive ways of managing stress such as ‘smoke cigarettes’ (18 per cent
prevalence; 64 per cent effectiveness), ‘gamble’ (16 per cent prevalence; 47 per cent effectiveness) and ‘take
recreational drugs’ (8 per cent prevalence; 67 per cent effectiveness) were rated as most effective.

‘
          Of concern is that some
          of the non-productive
          ways of managing
          stress such as smoking,
          gambling and taking
          recreational drugs were
          rated as most effective

                                                  Australian Psychological Society Stress and wellbeing in Australia survey 2015   17
Stress & wellbeing
                           Figure 6: Ways of Managing Stress %, 2011-2015

                                                               Ways of Managing Stress (2011-2015)
                                                                                                                                                          79 %
                                                                                                                                                                    85 %
                                           Watch television (avg = 85%)                                                                                                88 %
                                                                                                                                                                      87 %
                                                                                                                                                                     86 %
                                                                            0%
                                                                                                                                                                81 %
                                    ^Focus on the positives (avg = 81%)                                                                                         81 %
                                                                                                                                                                81 %
                                                                                                                                                               80 %
                                                                                                                                                       75 %
                                                                                                                                                                 82 %
                             Spend time with friends family (avg = 81%)                                                                                          82 %
                                                                                                                                                                  83 %
                                                                                                                                                                81 %
                                                                            0%
                                                                                                                                                               79 %
                                           ^Listen to music (avg = 80%)                                                                                          81 %
                                                                                                                                                                80 %
                                                                                                                                                              78 %
                                                                                                                                              69 %
                                                                                                                                                          77 %
                                                       Read (avg = 75%)                                                                                   77 %
                                                                                                                                                         76 %
                                                                                                                                                         76 %
                                                                            0%
                                                                                                                                                     72 %
                                       ^Adjust expectations (avg = 73%)                                                                               73 %
                                                                                                                                                        75 %
                                                                                                                                                      73 %
                                                                                                                                             66 %
                                                                                                                                                    69 %
                                             Eat something (avg = 72%)                                                                                   76 %
                                                                                                                                                        75 %
                                                                                                                                                        75 %
                                                                                                                                      60 %
                                                                                                                                                    70 %
                                       Do something active (avg = 69%)                                                                               71 %
                                                                                                                                                       73 %
                                                                                                                                                     71 %
                                                                            0%
                                                                                                                                         63 %
                                 ^Consciously avoid people (avg = 65%)                                                                       67 %
                                                                                                                                            66 %
                                                                                                                                          64 %
                                                                                                                                          64 %
                                                                                                                                         63 %
                                                Do a hobby (avg = 64%)                                                                  62 %
                                                                                                                                            66 %
                                                                                                                                           65 %
                                                                                                                        47 %
                                                                                                                                   57 %
                                               Go shopping (avg = 57%)                                                                60 %
                                                                                                                                      60 %
                                                                                                                                       61 %
                                                                                                                               50 %
                                                                                                                                53 %
                                                       Sleep (avg = 54%)                                                              59 %
                                                                                                                                 54 %
                                                                                                                                   56 %
                                                                                                              37 %
                                                                                                                      41 %
                                     Social networking sites (avg = 46%)                                                  49 %
                                                                                                                           50 %
                                                                                                                            51 %
                                                                                                       31 %
                                                                                                                 39 %
                                        Something relaxing (avg = 41%)                                               43 %
                                                                                                                      44 %
                                                                                                                        46 %
                                                                                                                  40 %
                                                                                                                  40 %
                                               Drink alcohol (avg = 40%)                                           41 %
                                                                                                                 39 %
                                                                                                                  40 %
                                                                                                       28 %
                                                                                                       30 %
                                          Play video games (avg = 32%)                                    34 %
                                                                                                         33 %
                                                                                                         33 %
                                                                                              25 %
                                                                                                     28 %
                                        Something spiritual (avg = 30%)                                30 %
                                                                                                          33 %
                                                                                                         32 %
                                                                                        16 %
     ^Not asked in                                                                        18 %
                                           Smoke cigarettes (avg = 18%)                    19 %
     2011                                                                                 18 %
                                                                                          18 %
                                                                                      13 %
     NOTE: In the figure                                                               15 %
                                                    Gamble (avg = 16%)                 15 %
     above prevalence                                                                     18 %
                                                                                           19 %
     is classified as                                                            7%
     the percentage of                                                           7%
                                                  Take drugs (avg = 8%)            10 %
     respondents who                                                              9%
                                                                                  9%
     indicated that they
     used one of the
     stress relievers
                                                                         0%      10% 20% 30% 40% 50% 60% 70% 80% 90% 100%
     either ‘sometimes’,
     ‘fairly often’ or                                            2011      2012     2013         2014        2015               Average
     ‘very often’.

18   Australian Psychological Society Stress and wellbeing in Australia survey 2015
Figure 7: Prevalence % vs Effectiveness % of Stress Management, 2011-2015

                 Prevalence vs Effectiveness of Ways of Managing Stress
                                          Watch television or movies                                                                               85%
                                                                                                                                         73%
                                              ^Focus on the positives                                                                          81%
                                                                                                                                              79%
                             Spend time with friends and/or family                                                                              81%
                                                                                                                                                 83%
                                                      ^Listen to music                                                                         80%
                                                                                                                                               80%
                                                                   Read                                                                    75%
                                                                                                                                             78%
                                             ^Adjust my expectations                                                                     73%
                                                                                                                                          75%
                                                         Eat something                                                                  72%
                                                                                                                          55%
                                                 Do something active                                                                  69%
                                                                                                                                                81%
 ^Consciously avoid people and/or situations that are stressful                                                                    65%
                                                                                                                                      70%
                                           Spend time doing a hobby                                                               64%
                                                                                                                                               80%
                                                           Go shopping                                                      57%
                                                                                                                                  64%
                                                            Sleep more                                                    54%
                                                                                                                             60%
                                         Visit social networking sites                                             46%
                                                                                                                      52%
                                            Doing something relaxing                                           41%
                                                                                                                                               80%
                                                          Drink alcohol                                       40%
                                                                                                                      49%
                                                     Play video games                                   32%
                                                                                                                                    67%
                                               Do something spiritual                                 30%
                                                                                                                                             78%
                                                     Smoke cigarettes                       18%
                                                                                                                                  64%
                                                                Gamble                     16%
                                                                                                                    47%
                                              Take recreational drugs               8%
                                                                                                                                    67%

                                                             Prevalence        Effectiveness

^Not asked in 2011

NOTE: In the figure above prevalence is classified as the percentage of respondents who indicated that they used one of the stress relievers
either ‘sometimes’, ‘fairly often’ or ‘very often’ and rated them ‘moderately effective’, quite effective’ and ‘highly effective’ for effectiveness.
This is a summary across all five years.

                                                                  Australian Psychological Society Stress and wellbeing in Australia survey 2015         19
Stress & wellbeing
                     4.4.3. Relationship between ways of managing stress and experience of distress, anxiety and depression symptoms

                     When looking at those who report the highest levels of distress, depression and anxiety symptoms an interesting
                     pattern emerges in their reported choice of stress management strategies.

                     People with higher levels of distress and anxiety and depression symptoms were more likely than other
                     Australians to engage in a range of activities, including taking recreational drugs, smoking, drinking alcohol,
                     gambling, and playing video games to help manage their stress. For example, 31 per cent of those reporting
                     severe distress compared with three per cent reporting normal distress said they take recreational drugs as a
                     stress management strategy.

                     Figure 8: Stress Reliever by K10 Distress Category

                     NOTE: The figure above denotes the percentage of people in each of the four K10 distress classifications who engage in the listed
                     stress relief practices.

                     Figure 9: Stress Reliever by DASS-21 Depression Category

                     NOTE: The figure above denotes the percentage of people in each of the five DASS-21 Depression classifications who engage in the
                     listed stress relief practices.

20   Australian Psychological Society Stress and wellbeing in Australia survey 2015
Figure 10: Stress Reliever % by DASS-21 Anxiety Category

NOTE: The figure above denotes the percentage of people in each of the five DASS-21 Anxiety classifications who engage in the listed
stress relief practices.

4.4.4. How do we seek help for stress?

Overall, a very consistent pattern of findings for help-seeking behaviour emerged across the five years (see
Figure 11 below). Australians are still most likely to seek help from family and friends, followed by their GP, with
15 per cent reporting they sought help from a psychologist or other mental health specialist (e.g. psychiatrist).

Figure 11: Prevalence of Help Sought to Manage Stress, 2011-2015

                               Help Seeking Behaviour (2011-2015 average)
       51%

                      26%           25%
                                                  19%
                                                                 9%
                                                                                6%             6%            4%            2%

       None          Family        Friend        General     Psychologist ^Self-help Other mental            ^Social    Employee
                                              Practitioner /                programs         health       networking    Assistance
                                                 Doctor                    available via specialist (e.g. sites (e.g.    Program
                                                                             books or     psychiatrist)    facebook,
                                                                          internet sites                     twiter)

^not asked in 2011

NOTE: The percentages in the figure above represent the proportion of respondents who chose any of the forms of help sought, in a
free-choice format in which they could choose any, all or none of the options.

                                                              Australian Psychological Society Stress and wellbeing in Australia survey 2015   21
Stress & wellbeing
                     4.4.5.     How do we think stress affects us?

                     Stress continues to affect the mental and physical health of Australians. The majority of Australians (72%) feel
                     stress is having at least some impact on their physical health (see Figure 12 below), while 64 per cent believe it
                     is having an impact on their mental health.

                     Of those experiencing stress, four in 10 Australians believe it is having a moderate to very strong impact on their
                     physical health (39%) and mental health (37%). This is consistent with research that indicates that stress has a
                     deleterious effect on both physical and mental health.

                     Figure 12: Perceived % Impact of Stress on Physical Health

                                                        Physical Health (2011-2015 average)
                                                            33%
                                  29%

                                                                                      21%

                                                                                                                12%

                                                                                                                                          6%

                                Not at all              Slight impact           Moderate impact            Strong impact           Very strong impact

                     NOTE: The percentages in the figure above represent the proportion of respondents who feel that stress is affecting their mental
                     health, ranging from ‘Not at all’ to ‘Very strong impact’.

                     Figure 13: Perceived % Impact of Stress on Mental Health

                                                        Mental Health (2011-2015 average)
                                  37%

                                                            27%

                                                                                      18%

                                                                                                                12%
                                                                                                                                          7%

                                Not at all              Slight impact           Moderate impact            Strong impact           Very strong impact

                     NOTE: The percentages in the figure above represent the proportion of respondents who feel that stress is affecting their mental
                     health, ranging from ‘Not at all’ to ‘Very strong impact’.

                     4.5. Wellbeing

                     Overall levels of wellbeing (2011 to 2015) were measured by using the Warwick-Edinburgh Mental Wellbeing
                     Scale (WEMWBS). A higher score on the scale indicates a higher level of wellbeing. While there is no significant
                     difference in wellbeing between genders, on other key demographic variables, such as age, patterns of
                     significance and interest do emerge in relation to wellbeing.

22   Australian Psychological Society Stress and wellbeing in Australia survey 2015
4.5.1.      Across five years in Australia
Significant differences in mean wellbeing scores over time occurred between the years 2011 and 2013, where
the scores were significantly higher and lower than other years and the average respectively (see Figure 14
below). Although Australians’ levels of wellbeing have improved over the last two years they still remain lower
than when the survey began in 2011.

Figure 14: Mean Wellbeing Score, 2011-2015

                                                         WEMWBS Score
 50
                 49.2
 49
                                                                                                                         48.1
 48                                         47.6                                                        47.4

 47                                                                   46.8

 46

 45
                 2011                       2012                      2013                          2014                2015
                                      Mean WEMWBS score                        Five year average (47.8)

NOTE: WEMWBS score Minimum 14-Maximum 70

4.5.2.      By age

Year-on-year the youngest age group (18-25) has reported the lowest levels of wellbeing, whilst older people
have consistently reported the highest levels of wellbeing (56 and above).

Figure 15: Wellbeing Score by Age Group, 2011-2015

                                            Wellbeing by Age (2011-2015 Average)
 53

 52                                                                                                                         51.8

 51

 50
                                                                                                               49.4

 49

 48

 47                                 46.8
                                                           46.4                    46.5
              46.0
 46

 45

 44

 43
              18-25                 26-35                 36-45                   46-55                        56-65    66 and above

                                                   Wellbeing by age          Five year average (47.8)

NOTE: As measured on the Warwick Edinburgh Mental Wellbeing Scale, the above figure denotes the significant increase in levels of
wellbeing as age increases (p
Stress & wellbeing
                     4.5.3.     By living arrangements

                     Across the five years, sole parents fared worst on the Wellbeing scale (44.9 WEMBWS score compared to an
                     average of 46.6 for all other groups, p
4.5.5.     By primary employment

Unemployed people were found to be significantly worse off in terms of wellbeing when compared with
employed people, homemakers and retirees. Retirees had the highest measure of wellbeing across the five
years (see Figure 17 below).

Figure 17: Average Warwick-Edinburgh Mental Wellbeing Score by Primary Employment, 2011-2015

                                            Wellbeing by Employment (2011-2015 Average)
 52
            50.8

 50

                              47.9                 47.5                47.1
 48

 46                                                                                       45.7
                                                                                                                  44.5
 44                                                                                                                         43.3

 42

 40

 38
           Retired          Full-time         Part-time/Casual    Homemaker        Full-time student Part-time student   Unemployed
                                             Wellbeing by employment            Five year average (47.8)

NOTE: As measured on the Warwick Edinburgh Mental Wellbeing Scale, the above figure denotes the differing levels of wellbeing
associated with different employment conditions.

4.5.6.     By annual income
Across the five years, wellbeing increased with income. Those who earn more reported a significantly higher
level of wellbeing than those earning less. This is particularly noticeable when comparing the highest earners
($91,000 or more) and lowest earners ($30,000 or less). See Figure 18 below.

Figure 18: Mean Warwick-Edinburgh Mental Wellbeing Score by Income, 2011-2015

                                              Wellbeing by Income (2011-2015 Average)
 52
                                                                                                                          51.0
 51
                                                                                                           50.1
 50
                                                                                  49.0
 49
                                                           48.3
 48                                  47.7
             47.3
 47

 46

 45
       $15,000 to $30,000   $31,000 to $60,000      $61,000 to $90,000   $91,000 to $120,000 $121,000 to $150,000 More than $150,000
                                               Wellbeing by income            Five year average (47.8)

NOTE: As measured on the Warwick Edinburgh Mental Wellbeing Scale, the above table denotes the significant increase
levels of wellbeing as income band increases (p
Stress & wellbeing

                                                                                                  ‘                     Workplace
                                                                                                                        wellbeing
                                                                                                                        increased in
                                                                                                                        2015 compared
                                                                                                                        to 2014 but again
                                                                                                                        has not returned
                                                                                                                        to 2011 levels

                     4.5.7. Workplace wellbeing

                     Each year the survey has also looked at wellbeing in the workplace, as work can be a significant
                     contributor to stress, distress and a lack of wellbeing. Workplace wellbeing increased in 2015
                     compared to 2014 but again has not returned to 2011 levels. Job satisfaction and work-life balance
                     were also highest in 2011.

                     Table 10: Workplace Wellbeing

                      Wellbeing                                         2011            2012             2013             2014              2015          Average
                      Overall workplace wellbeing                       4.4*             4.3*              4.2            4.2*              4.3              4.3
                      Job Satisfaction (0-10)                           6.7*             6.6*              6.3            6.3*              6.5              6.6
                      Work-life balance Satisfaction                    6.4*              6.3              6.2            6.2*              6.3              6.3
                      (0-10)
                      Job Interesting (0-6)                              4.0             4.1*              4.0             4.0              4.0              4.1
                      Job Stressful (0-6 inversed)                      3.0*             2.8*              2.7             2.7              2.8              2.8
                      Appropriateness of salary (1-5)                    3.1              3.1              3.1             3.1              3.1              3.1
                      Likelihood of unemployment (1-4                   3.2*              2.7              2.8            2.8*              2.9              2.7
                      inversed)
                     *Significantly different at p
5. STRESS AND WELLNESS IN 2015
In addition to the measures used in the multi-year analysis, the 2015 survey contained a number of other
questions that looked more closely at what contributes to Australians’ levels of stress, how different groups
manage that stress and how well people feel in a range of areas.

5.1. Causes of stress in 2015
In 2015, a new item ‘issues with keeping up with social media networks’ was introduced to the list of stressors,
with more than one in ten Australians (12%) reporting that as a source of stress.

In contrast to the previous four years’ findings where women were more likely to be concerned about a range of
stressors, in 2015 the only difference between men and women was that women (40%) were more likely than
men (34%) to cite ‘Issues with the health of others close to you’ as a significant source of stress. People aged
46-55 years were more likely to report ‘issues with the health of others close to you’ as a source of stress than all
other age groups. Other points to note are:

1.       Young people are more likely than their older counterparts to find ‘environmental issues’ a source of stress
         (26 per cent of 18-25 year olds vs an average of the older groups 36 and above of 19 per cent, p
Stress & wellbeing
                     5.2.        Wellness in 2015
                     In 2015 for the first time, we asked Australians to rate themselves in six domains of wellness3 (physical, social,
                     emotional, spiritual, vocational and intellectual). Overall Australians are doing well across the different domains
                     that map onto a satisfying and healthy life; with three in five rating themselves moderately to extremely well
                     across these areas.

                     The most noticeable and significant finding from the wellness prevalence is that as people get older they rate
                     their physical wellness considerably lower when compared to their younger counterparts.

                     The six domains of wellness are:

                     •      Physical Wellness: the ability to carry out daily tasks with vigour
                     •      Social Wellness: the ability to have satisfying relationships and interactions with others
                     •      Emotional Wellness: the ability to control emotions and express them appropriately and comfortably
                     •      Spiritual Wellness: a guiding sense of meaning or value in life
                     •      Intellectual Wellness: the ability to learn, grow from experience, and utilise intellectual capabilities
                     •      Vocational Wellness: having interests, employment, volunteer work or other activities that provide personal
                            satisfaction and enrichment in daily life

                     3
                       The items are scored on a scale of 1 – ‘Not well at all’, to 5 – ‘Extremely well’, and transformed into a prevalence percentage of respondents who score
                     3 – ‘Moderately well’ and above.

28   Australian Psychological Society Stress and wellbeing in Australia survey 2015
Gender                   n
                              ‘
Table 11: Wellness Prevalence by gender, 2015

                                       Physical
                                       wellness
                                                  Spiritual wellness: a guiding sense of
                                                  meaning or value in life

                                                            Social
                                                           wellness
                                                                      Emotional
                                                                       wellness
                                                                                     Spiritual
                                                                                     wellness
                                                                                                 Intellectual
                                                                                                  wellness
                                                                                                                Vocational
                                                                                                                 wellness
 Male                (n=705)              64%               65%          63%           63%          72%           63%
 Female              (n=813)              64%               68%          66%           65%          74%           66%

Table 12: Wellness Prevalence by Age Group, 2015

 Age group                n            Physical             Social    Emotional      Spiritual   Intellectual   Vocational
                                       wellness            wellness    wellness      wellness     wellness       wellness
 18-25               (n=184)              67%               66%          61%           65%          74%           66%
 26-35               (n=290)              67%               65%          64%           64%          73%           64%
 36-45               (n=312)              67%               70%          67%           67%          76%           69%
 46-55               (n=269)              65%               64%          63%           62%          71%           62%
 56-65               (n=242)             60%*               68%          67%           65%          72%           66%
 66+                 (n=223)             57%*               64%          63%           62%          72%           63%
*Significantly different from other age groups at p
The FoMO factor
                    6. SPECIAL TOPIC: FEAR OF MISSING OUT
                    The special topic for the 2015 Survey
                    is the Fear of Missing Out (FoMO). The
                    FoMO survey, including adults and
                    teenagers, examines how entrenched
                    use of social media is in our lives and
                    gauges its impact on our lives. For
                    instance:

                    • Can Australians switch off from social
                      media without experiencing anxiety?
                    • Is staying constantly connected a
                      benefit or a burden?
                    • Is social media shaping how we
                      behave and relate?

                    6.1. Key findings
                    Social media use differed between age groups; while adults
                    averaged 2.1 hours per day connected to social media, teens reported spending an average of 2.7
                    hours per day. The proportion of teens (25%) and adults (6%) who were ‘constantly’ on social media
                    was different. The impact on teens of social media is much greater than its impact on adults.

                    Teens connected to social media more frequently (5 or more times a day, i.e. heavy users of social
                    media) are significantly more likely to experience all aspects of FoMO than adults connected to social
                    media five or more times a day (see Figure 20 at right).

                    6.2.     Teen social media use
                    Fifty six per cent of Australian teens are heavy social media users, with 25 per cent Australian teens
                    reporting being connected to social media constantly (see Figure 21 on the following page). There were
                    no significant differences between age groups or gender in the frequency of connecting to social media.

30   Australian Psychological Society Stress and wellbeing in Australia survey 2015
The impact
                                                                                                               on teens of
                                                                                                               social media
                                                                                                               is much
                                                                                                               greater than
                                                                                                               its impact on
                                                                                                               adults
Figure 20: FoMO for Heavy Social Media Users, 2015

NOTE: In the figure above all teen scores for FoMO are significantly higher than the respective adult scores

                                                               Australian Psychological Society Stress and wellbeing in Australia survey 2015   31
The FoMO factor
                    Figure 21: Time Spent Connected to Social Media by Teens Age Groups and Gender, 2015

                                                                    Time Spent Connected to Social Media by Age and Gender

                                          29%
                              28%
                                                                                                                       27%

                                                25%                                                                          25%
                                                                                                                                         24%
                        23%                                                                                                        23%
                                                                                                                 22%
                                    21%
                                                                                            20%
                                                                                                                                                            19%
                                                                                      18%         18% 18% 18%
                                                                                                                                               17%

                                                                                                                                                                        15%
                                                       14%
                                                                         13%
                                                                               13%
                                                                   12%
                                                                                                                                                      11%         11%
                                                             10%

                                                                                                                                                                              6%             6%
                                                                                                                                                                                        5%        5%
                                                                                                                                                                                   4%

                               Constantly             More than 10 times per day About 5-10 times per day        About 1-4 times per day           Several times a week            Once a week

                                                                                     Age 13-15      Age 16-17   Male     Female          Average

                    NOTE: The above figure represents the percentage of how frequently teens connect to social media when on-line, with results split by gender
                    and age group, sample size (n=206).

                    Over half of Australian teens connect to social media 15 minutes before bed every night. Almost four in 10
                    connect in the presence of others and within 15 minutes of waking up every day. Almost one in four Australian
                    teens reported using social media when they were eating breakfast and lunch seven days a week (see Table 13
                    below).

                    Table 13: Social Media Average Usage by Teens During Periods of the Day, 2015

                      Time of day             Number of day(s) spent on social media
                                                                                      Not one day        1 day         2 days        3 days          4 days         5 days         6 days     7 days
                      Fifteen minutes before you go to sleep                              15%             11%           6%                7%            2%              5%          2%            53%
                      Fifteen minutes after waking up                                     28%             11%          12%                4%            3%              4%          2%            37%
                      When eating breakfast                                               42%             14%           9%                4%            3%              5%          0%            24%
                      When eating lunch                                                   32%             11%          15%                6%            1%              11%         1%            24%
                      When eating dinner                                                  51%             13%           6%                4%            2%              8%          2%            15%
                      In the company of others                                            21%             11%           9%                8%            4%              10%         1%            37%
                    NOTE: The table above denotes the number of days that a proportion of teens use social media during break periods such as lunch and dinner,
                    as well as prior to sleep and after waking.

32   Australian Psychological Society Stress and wellbeing in Australia survey 2015
6.3. Teen social media experience

There are significant differences in how different groups of teens (heavy vs light users) perceive how social
media affects them. Each group reports that social media helps them connect to like-minded individuals.
However, on every other measure, heavy social media users (5+ times per day) are significantly more likely to be
affected by their social media experience.

For example, heavy social media users are significantly more likely than light users to rate that they feel
uncomfortable when they can’t access their social media accounts (heavy 78% per cent vs light 44%).

Frequency of use has a significant impact on the way teens interact online and how they feel about themselves
and their friends. Heavy social media users feel their relationships are stronger; they can more effectively seek
help through social media, set
goals and feel part of a global
                                       Figure 22: Attitudes Toward Social Media Use in Teens, 2015
community.
                                                                           Experience of Social Media by Usage (Teens)
Conversely, as Figure 22 at right
shows, the less time teens spend                   *I find the use of social media has helped strengthen my                                                                        91%
                                                                                                                                                                             84%
                                                                          relationships
on social media, the less they                                                                                                                                         76%
                                           I am afraid that I will miss something if I don’t stay connected to                                                                 90%
feel burnt out by it, the less they                            my online social networks
                                                                                                                                                                         79%
                                                                                                                                                             65%
feel they are missing out, the less
                                                I feel included or connected to like-minded people through                                                                   86%
they are concerned that people                     participating in online forums and content-sharing sites
                                                                                                                                                                          82%
                                                                                                                                                                      77%
will post ugly pictures of them,          *I use social media to connect with other youth around the globe                                                                 83%
and they are less likely to feel bad           who share a common interest, hobby, or activity of mine                                                             71%
                                                                                                                                                                       78%

about themselves if people didn’t         *I feel empowered or find it easier to seek help when I need (e.g.                                                             81%
                                                                                                                                                                    72%
‘like’ their social media posts.                   to manage stress) through the use of social media                                                       61%
                                                                                                                                                                         80%
                                                 I love posting photos of me and my friends on social media                                                       70%
                                                                                                                                                           59%
                                             *I feel worried or uncomfortable when I can’t access my social                                                              78%
                                                                                                                                                            63%
                                                                    media accounts                                                           44%
                                                I feel left out or excluded after seeing photos of my friends                                                      71%
                                                                                                                                                            63%
                                                            together at something I wasn’t invited to                                                52%
                                           I get stressed out about how I look when I post pictures on social                                                     70%
                                                                                                                                                           60%
                                                                        media                                                                  47%
                                           I feel my brain ‘burnout’ with the constant connectivity of social                                                    69%
                                                                                                                                                           60%
                                                                         media                                                                   50%
                                         I worry about people posting ugly pictures of me and tagging me in                                                      68%
                                                                                                                                                           60%
                                                                       them                                                                      50%
                                           I feel bad about myself when nobody comments on or “likes” my                                                     64%
                                                                                                                                                      55%
                                                                       photos                                                                44%
                                              I find it difficult to relax or sleep after spending time on social                                        61%
                                                                                                                                                      57%
                                                                         networking sites                                                          51%
                                            *I use social media as a motivational tool to help me to achieve                                           58%
                                                                                                                                                   51%
                                                       health goals (e.g. starting an exercise plan)                                         44%

                                                                             Heavy Social Media Users           Average   Light Social Media Users

                                        *All items except ‘I feel included or connected to like-minded people through participating in online forums and content-
                                        sharing sites’ are significantly different at p
The FoMO factor

                                                      ‘                 Just under half of
                                                                        Australian teens
                                                                        (approximately 45%)
                                                                        feel that their peers are
                                                                        having more rewarding
                                                                        experiences than them

                    6.4.     Teen FoMO
                    FoMO is having an effect on the lives of Australian teens.

                    •    50 per cent of teens experience FoMO.
                    •    On average, 59 per cent of teens feel the need to keep track of their friends when they are on holiday.
                    •    51 per cent on average feel that it is important to post status updates when they are having a good time.
                    •    Just under half of Australian teens (approximately 45%) feel that their peers are having more rewarding
                         experiences than them and 46 per cent also wonder if they are spending too much time keeping up with
                         what is going on with others.

                    Generally, there are no significant differences between male and female teens when looking at the effects of
                    FoMO. However, female teens (60%) are more worried about missing a planned get together with their friends
                    than male teens (46%).

                    For teen males, FoMO is consistent across age groups (48% for males aged 13-15, and 50% for males aged 16-
                    17). However, as they get older females become more affected by FoMO (38% for females aged 13-15, and 66%
                    for females aged 16-17).

                    Heavy social media users are on are on all measures more likely to experience FoMO than light social media
                    users.

34   Australian Psychological Society Stress and wellbeing in Australia survey 2015
You can also read