Predicting Secondary Structure of Protein Using Hybrid of Convolutional Neural Network and Support Vector Machine - inass
←
→
Page content transcription
If your browser does not render page correctly, please read the page content below
Received: September 4, 2020. Revised: October 31, 2020. 232

Predicting Secondary Structure of Protein Using Hybrid of Convolutional Neural
 Network and Support Vector Machine

 Vincent Michael Sutanto1 Zaki Indra Sukma2 Afiahayati Afiahayati1*

 1
 Department of Computer Science and Electronics, Universitas Gadjah Mada, Indonesia
 2
 Business Intelligence Data Engineering Division, Gojek, Indonesia
 * Corresponding author’s Email: afia@ugm.ac.id

 Abstract: Protein secondary structure prediction is one of the problems in the Bioinformatics field, which conducted
 to find the function of proteins. Protein secondary structure prediction is done by classifying each sequence of protein
 primary structure into the sequence of protein secondary structure, which fall in sequence labelling problems and can
 be solved with the machine learning. Convolutional Neural Network (CNN) and Support Vector Machine (SVM) are
 2 methods that often used to solve classification problems. In this research, we proposed a hybrid of 1-Dimensional
 CNN and SVM to predict the secondary structure of the protein. In this research, we used a novel hybrid 1-Dimensional
 CNN and SVM for sequence labelling, specifically to predict the secondary structure of the protein. Our hybrid model
 managed to outperform previous studies in term of Q3 and Q8 accuracy on CB513 dataset.
 Keywords: Bioinformatics, Convolutional neural network, Protein secondary structure prediction, Support vector
 machine.

 In Bioinformatics, the structure of proteins is
1. Introduction often determined using several experimental
 procedures, namely X-Ray Crystallography, Nuclear
 Protein is an impactful part of organisms which
 Magnetic Resonance Spectroscopy (NMR), and
greatly affects its functions. Protein has many
 Computational Methods. Prediction of the secondary
functions, namely facilitating chemical reactions,
 structure of proteins using computational methods
regulating cell activity, antibodies, cell-binding
 can be resolved by predicting each position in the
structural elements, and motor elements [1]. It is also
 protein primary structure sequence (20 types of
well known that protein structure is influencing the
 amino acids) into its secondary structure sequence (α-
mechanical functions and interactions between
 helix, 310-helix, B-bridge, B-strand, π-helix, Bend,
proteins, resulting in certain biological phenomenon
 B-turn, and Loop / Irregular). In machine learning,
[2].
 the process of predicting each position from a
 Proteins affect the function of cells of organisms
 sequence and producing a new sequence is often
through the process of protein synthesis, thus it can
 referred to as sequence labelling.
be said that the properties of living things are
 One common approach is to use Convolutional
determined by proteins. The process of protein
 Neural Network (CNN), as it is well known for its
synthesis is carried out through several stages. The
 performance in spatial-related task and its ability to
Deoxyribonucleic Acid (DNA) chains are opened
 extract and enrich features from a sequence. However,
and one of the chains is transcribed into Messenger
 in protein secondary structure prediction the CNN is
Ribonucleic Acid (mRNA). Furthermore, Ribosomes
 often combined with another technique, as in
translate the Ribonucleic Acid into amino acid
 example Generative Stochastic Network [3],
sequences. The amino acids then fold and form the
 Multilayer Shift-and-Stitch and CNN (MUST-CNN)
secondary structure of the protein.
 [4], Deep-CNF [5], and Multi-scale CNN [6].

International Journal of Intelligent Engineering and Systems, Vol.14, No.1, 2021 DOI: 10.22266/ijies2021.0228.23
Received: September 4, 2020. Revised: October 31, 2020. 233

Another approach is by using SVM with Gaussian the sequences. This research is an extended version
kernel because of its ability in classifying data with a of the authors’ thesis [14, 15].
large number of features as shown in several studies This study has made specific contributions as
related to protein secondary structure prediction [7- follows: (1) A new hybrid architecture of 1-
8]. However, these methods share the same common Dimensional CNN and SVM has been introduced in
unsolved problem in predicting the secondary sequence labelling domain, and we used the
structure of the protein, which is a low accuracy score technique to predict the secondary structure of the
in both Q3 and Q8. Because of that, we tried to proteins. (2) The hybrid model managed to
increase the accuracy score by proposing a new outperform MUST-CNN [4], DeepSeqVec [16],
hybrid method of CNN and SVM to predict the DeepProf with SeqVec [16], Deep-CNF [5], Multi-
secondary structure of the protein. scale CNN One-Hot Encoded [6], and Bi-RNN
 A combination of CNN and SVM has been Single Model [17] in term of Q8 accuracy. In term of
widely used to solve a classification task and showed Q3 accuracy, our model managed to outperform
a good performance in comparison with plain CNN SVM with Genetic Algorithm [7], SVM with
[9-11]. However, most of the researches Sequence Features [8], DeepSeqVec [16], and
implemented 2-Dimensional CNN as they were DeepProf with SeqVec [16].
dealing with image classification instead of sequence We organised this paper as follows: Chapter 2
labelling. Thus, it cannot be used to solve the explains the domain problem of predicting the
sequence labelling task, as CNN has to move in 1 secondary structure of the protein, Chapter 3 shows
direction instead of 2 direction when convoluting numbers of related studies, Chapter 4 explains the
through sequences. Some studies [12-13] also used conventional and the hybrid architecture proposed in
the hybrid CNN and SVM to do text classification, this study, Chapter 5 explains the results of this
but in contrast, we used it to do a sequence labelling research, Chapter 6 discussed the findings from the
instead of classifying entire sequence into one results, and Chapter 7 shows the conclusion and
specific class. possibilities for future work.
 In this research, we proposed a hybrid of 1-
Dimensional CNN and SVM to do a sequence 2. Related work
labelling task, which is predicting the secondary
 Various machine learning models have been used
structure of proteins. 1-Dimensional CNN is used to
 for predicting the secondary structure of the protein.
extract and enrich the features, bringing the data into
 Some works are highly related to this study, namely
higher dimensional space and retrieving important
 Generative Stochastic Network [3], MUST-CNN [4],
features. We also used the CNN to capture long-range
 and Support Vector Machine [7-8]. We also
interdependencies between each residue in
 compared our work with other studies, namely
sequences. However, there is a disadvantage when
 DeepSeqVec [16], DeepProf +SeqVec [16], Deep-
using 1-Dimensional CNN for sequence labelling
 CNF [5], Multi-scale CNN [6], and Bi-RNN Single
task. The convolution and the pooling process of the
 Model [17].
1-Dimensional CNN will cause the sequence length
 Zhou and Troyanskaya predicted the secondary
to be reduced. Therefore, in this study, we
 structure of proteins using the Generative Stochastic
implemented the Multilayer Shift-and-Stitch
 Network (GSN) architecture combined with CNN [3].
technique [4] so that the length of the sequences does
 GSN was used to study the probability of the
not decrease after the convolution and pooling stages.
 relationship between the output and input data
Afterwards, we exploit the capability of SVM
 obtained from the Markov chain. 6128 sequences of
to classify data with high dimensionality, as it is safe
 CullPDB dataset were used in this study and divided
to increase the number of features that will be fed into
 into 5600 training data, 256 validation data, and 272
the SVM because the regularisation parameter of
 test data. The GSN architecture with 3 convolutional
SVM will decide which of these features are
 layers produced Q8 accuracy of 0.721 ± 0.006% with
impactful and which are not. The 1-Dimensional
 CullPDB test data and Q8 accuracy of 0.664 ±
model managed to capture the relation of each
 0.005% with CB513 benchmark dataset. Our study
sequence’s residue and increase the data’s features,
 used the dataset provided by the authors of this study
while the SVM showed a better performance when
 [3].
replacing the dense layer in classifying high
 Z. Lin, J. Lanchantin, and Y. Qi predicted the
dimensional data. The SVM processes the large
 secondary structure of proteins using a combination
feature map data generated by CNN and predicts
 of MUST-CNN [4]. The architecture used a
secondary protein structure labels for each position in
 technique called Multilayer-Shift-and-Stitch, which

International Journal of Intelligent Engineering and Systems, Vol.14, No.1, 2021 DOI: 10.22266/ijies2021.0228.23
Received: September 4, 2020. Revised: October 31, 2020. 234

were used to tackle the reduced data resolution technique. This study [16] also used different CNN
problem that occurs because of the convolution and architecture to ours.
pooling stages in CNN. Two models were formed in Wang, J. Peng, J. Ma, and J. Xu used Deep-CNF
this study, namely a small model with 189 feature to predict the secondary structure of the protein [5].
maps and a large model with 1024 feature maps. The Deep-CNF is a combination of Conditional Random
models were trained on 4prot dataset and CullPDB Fields and deep convolutional neural networks
dataset and tested on 4prot dataset and CB513 dataset aiming to capture relationship in a sequence and also
respectively. The small and large models were tested the correlation between each nearby residue. This
on 4prot dataset, achieving Q8 accuracy of 0.706 and model was trained with CullPDB dataset and used 21
0.767 respectively. The large model was also tested orthogonal encodings and 21 PSSM as its features.
with CB513 dataset and achieved Q8 accuracy of This study [5] differs from our paper by the CNN
0.684. Our study is an improved implementation of architecture, which theirs were a combination of
this study [4], as we tried to combine the MUST- Conditional Random Fields and Deep CNN, while
CNN architecture with SVM. ours were MUST-CNN and SVM.
 Y. Wang, J. Cheng, Y. Liu, and Y. Chen predicted Multi-scale CNN was a model by J. Zhou, H.
the secondary structure of the protein on the CB513 Wang, Z. Zhao, R. Xu, and Q. Lu [6]. The model was
dataset using the SVM RBF kernel [7]. Amino acid trained using CullPDB dataset and tested on the one-
sequences and Position-Specific Scoring Matrix hot encoded feature of CB513 dataset. This technique
(PSSM) were used as inputs for the SVM. Sliding used a connecting highway between two neighbours
Window with a size of 13 was used to retrieve 260 of convolutional layers to keep local context that has
features vector. PSSM was used as it can store the been retrieved by the lower layers while also getting
evolution information of proteins. Grid search the relation of long-range sequence. The Multi-scale
method and genetic algorithms were used to optimize CNN managed to score 68.3% in Q8. This model
the parameters of SVM. The models reached Q3 differs with our model, which the previous study [6]
accuracy up to 76.11% for the use of genetic used a highway connector between each
algorithms and 76.08% for the use of grid search. Y. convolutional layer and we didn’t use such a
Chen, Y. Liu, J. Cheng, and Y. Wang also conducted technique.
the prediction of the secondary structure of proteins Bi-RNN Single Model was used by A. R.
with SVM [8]. Sliding Window of 13 was used to Johansen, C. K. Sønderby, S. K. Sønderby, and O.
capture the input feature (Position-Specific Scoring Winther to predict the secondary structure of the
Matrix combined with Sequence Feature) for SVM. protein [17]. This study implemented a combination
CB513 Dataset was used in this study, which 440 are of layers, such as the fully-connected layer, Bi-
used as a training data and 53 as test data. The model directional Recurrent Neural Network layer, and
achieved a Q3 accuracy of 78%. These study [7-8] Conditional Random Field Layer [17]. The model
differs from our paper as they use SVM as the main was trained on CullPDB dataset and tested on CB513
architecture while our study proposed the SVM as a dataset. The model reached a Q8 accuracy of 68.5%.
part of a hybrid architecture. This study [17] implemented the most distant and
 Heinzinger, A. Elnaggar, Y. Wang, C. Dallago, D. complex architecture compared to ours.
Nechaev, F. Matthes, and B. Rost predicted the
secondary structure of the protein using DeepSeqVec 3. Protein secondary structure prediction
and DeepProf with SeqVec [16]. These models
 Protein is a macromolecule formed by a sequence
predicted the secondary structure of proteins by
 of different amino acids linked by peptide bonds and
combining CNN and sequence embedding, with the
 covalent bonds. Amino acids themselves are often
only differences is the second model is an upgraded
 referred as the primary structure of a protein. There
version of the first model. The embedding used in
 are 20 types of amino acids that compose proteins.
DeepSeqVec models increased the number of
 Table 1 shows the symbols, abbreviations and amino
features each position of the sequences into 1024, and
 acids of these amino acids. The secondary structure
the DeepProf + SeqVec to 1074 (50 addition from 20
 of a protein can be predicted using its primary
orthogonal input, 20 evolutionary information, 7 state
 structure. The problem of predicting the secondary
transition probability from hidden markov model,
 structure of proteins based on their primary structure
and 3 local alignment features). These models scored
 is included in the sequence labelling domain.
Q8 accuracy of 62.5 ± 0.6 for DeepSeqVec model
 Sequence labelling Classification is done by
and 66.0 ± 0.5 for DeepProf with SeqVec model. This
 predicting the Y label of a secondary protein structure
study [16] used sequence embedding features as
 sequence at position i, based on the input in the form
additional features while our study didn’t use such a
International Journal of Intelligent Engineering and Systems, Vol.14, No.1, 2021 DOI: 10.22266/ijies2021.0228.23
Received: September 4, 2020. Revised: October 31, 2020. 235

 Table 1. Symbols, abbreviations, and name of amino Table 2. 8 classes and 3 classes of protein secondary
 acids structure
 Symbol Abbreviation Name 8 Class Name 8 Class 3 Class 3 Class
 A Ala Alanina Symbol Name Symbol
 α-helix H Helix H
 C Cys Cysteine 310-helix G
 D Asp Aspartic Acid π-helix I
 E Glu Glutamic Acid B-Strand E Sheet E
 F Phe Phenylalanine B-bridge B
 Loop/Irreguler L Coil / C
 G Gly Glycine
 B-Turn T Loop
 H His Histidine Bend S
 I Ile Isoleucine
 ∑ =
 K Lys Lysine 3 = , ∈ { , , } (1)
 ∑ = ∑ =
 L Leu Leucine
 M Met Methionine ∑ =
 8 = ∑ = ∑ =
 , ∈ { , , , , , , , }(2)
 N Asn Asparagine
 P Pro Proline
 Q Gln Glutamine 4. Data and method
 R Arg Arginine 4.1 Datasets
 S Ser Serine
 T Thr Threonine In this study, we used filtered CullPDB dataset
 V Val Valine [3] and the CB513 dataset [18] as an input and
 training target for the hybrid of CNN and SVM (see
 W Trp Tryptophan
 Fig. 2). The filtered CullPDB dataset consists of 5365
 Y Tyr Tyrosine
 sequences of protein primary structure with a length
 of 700 for each sequence. We divided the data into
 4292 training data and 1073 validation data. We used
 the CB513 Dataset as a test data. This dataset consists
 of 514 sequences of protein primary structure and a
 length of 700 for each sequence. These datasets
 contain features and label for each length of
 sequence: 21 Position-Specific Scoring Matrix and
 21 Orthogonal Input Profile as the input feature, and
 One-hot encoded label of 8 different class of protein
 secondary structure as the output label.

 4.2 Convolutional neural network

 Figure. 1 Protein primary structure with its secondary Convolutional Neural Network (CNN) [19] is an
 structure pairs artificial neural network that is specifically designed
 to solve spatial problems. The hidden units contained
of X from the protein primary structure sequence at in CNN often have the same dimensions or size as the
the same position (Fig. 1). The secondary protein processed data.
structure itself consists of 8 structural classes that can The hidden units convolve on the data and store
be grouped into 3 main classes, namely the Helix, relationship information from the data. The
Sheet, and Coil / Loop as shown in Table 2. The information formed by each hidden unit will be stored
prediction results are evaluated by looking at the Q3 as a feature-maps, with the number of feature maps
and Q8 accuracy values as shown by Eq. (1) and Eq. that are formed will be as many as the number of
(2), where i is the row index of the confusion matrix, hidden units used. The pooling stage is then carried
j is the column index of the confusion matrix, and P out on the existing feature maps, retrieving dense
is the value of (i, j) of the confusion matrix. The information from the feature maps. Convolution
results are also evaluated by looking at the precision process with kernel on the data with 2-dimensional
and recall scores. input and produce as the output can be written as [19]:

International Journal of Intelligent Engineering and Systems, Vol.14, No.1, 2021 DOI: 10.22266/ijies2021.0228.23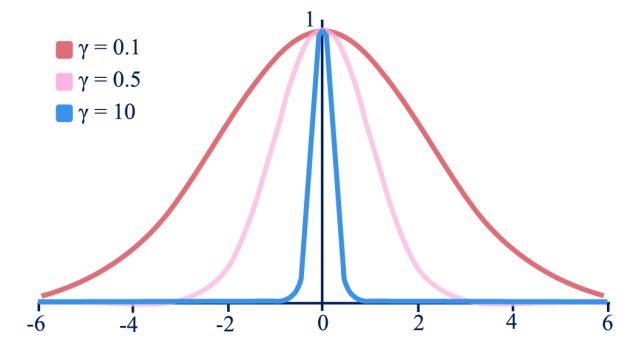
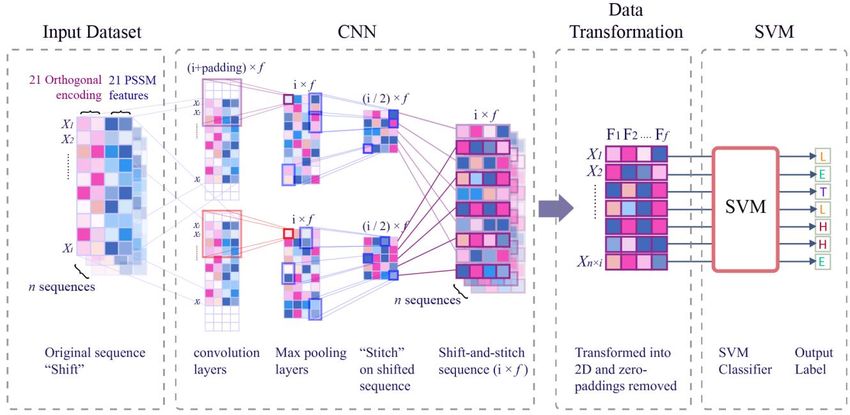
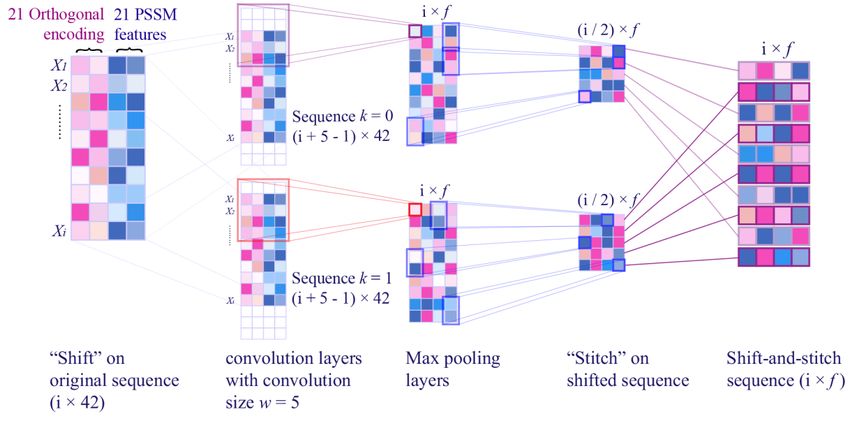
Received: September 4, 2020. Revised: October 31, 2020. 236

 Figure. 2 General Architecture of CNN-SVM Hybrid

 Figure. 3 Shift-and-stitch technique on a single sequence

 ( , ) = ∑ ∑ ( + , + ) ( , ) (3) after the pooling stage has completed. “Stitch" is
 done by combining the two sequences from the
 A technique called Shift-and-stitch was "Shift" stage, so the resolution of the sequence
introduced to avoid reduction of resolution caused by becomes 700 × f. The dense layer then processes the
convolution and pooling stages in CNN [20]. This "shift-and-stitch" sequences, followed by outputting
technique has been modified to be a technique called the predicted result by the output layer. In this study,
Multilayer Shift-and-Stitch [4], so it can be applied in the Multilayer Shift-and-Stitch CNN technique [4]
sequence labelling task. The shift-and-stitch was implemented, fine-tuned and ran using Keras
technique (see Fig. 3) works by duplicating each [21]. Keras library was chosen as its widely used as a
sequence with a resolution of 700 × 42 as much as the deep learning tool and its ability to run on GPU.
pooling size used (we determined the pooling size p
= 2). Then, we give zero-paddings as much as w - 1 4.3 Support vector machine
for each sequence (at the front and at the back of each
sequence, where w denotes the convolution size and Support Vector Machine (SVM) [22] is one of the
k denotes the order of the sequence). The process of classifications in the machine learning fields. The
 main idea of SVM is to find a hyperplane that is used
adding zero-padding to both sequences is called
"Shift". Afterwards, f number of 1-Dimensional as a decision surface so the gap between one class and
convolutional kernels are applied to each sequence, another class is maximized. In general, SVM works
followed by the pooling process. These 2 steps will by following these steps: firstly, the features of the
cause each sequence having a resolution of 350 × f. data are mapped into high-dimensional space using
 kernel functions. Secondly, the data is separated
"Stitch" aims to make the sequence length return to
the same length as the original length and is applied using the best hyperplane. The best hyperplane is
 obtained by maximizing the distance to the
International Journal of Intelligent Engineering and Systems, Vol.14, No.1, 2021 DOI: 10.22266/ijies2021.0228.23
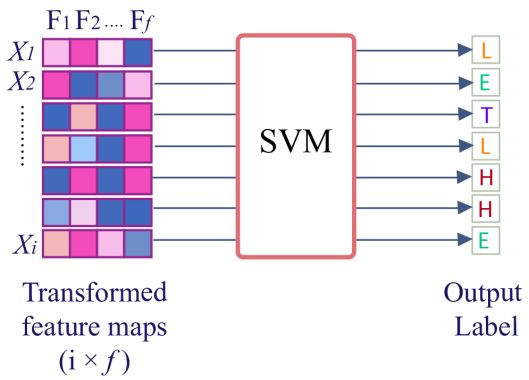
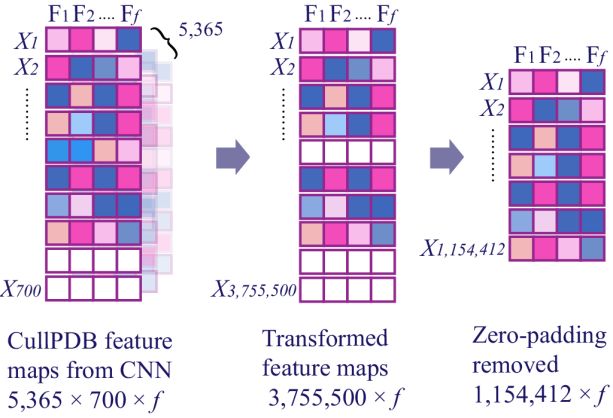
Received: September 4, 2020. Revised: October 31, 2020. 237

 Figure. 4 Separating hyperplane with maximum margin
 Figure. 6 SVM trained on transformed feature maps from
 CNN and gives label as an output

 each sequence was fed into the SVM and had its label
 predicted by the model, as shown in Fig. 6. We chose
 ThunderSVM [23] as we are dealing with data with
 large features and large in quantities.

 4.4 Hybrid CNN-SVM

 This study proposed a hybrid of CNN and SVM to
 predict the secondary structure of the protein. The
 Figure. 5 Effects of γ value on gaussian curve hybrid architecture used in this research was designed
 by combining 1-Dimensional CNN with SVM is
hyperplane between each closest sample (Supporting illustrated by Fig. 7. Multilayer Shift-and-Stitch
Vector) from each class (see Fig. 4). CNN [4] was chosen as it is able to extract and enrich
 A regularisation parameter C is used in SVM to the relationship patterns of the protein primary
find the best margin from the hyperplane. A proper structures sequences, and also keeping the data
value of C has to be searched so that the SVM finds resolution. We fine-tuned the CNN and then modified
the balance between maximal margin and minimal it, so instead of giving orthogonal label as an output,
misclassification. A high value of C indicates that the the models produce feature maps. By doing this step,
model will receive more penalty when the model we project the data into higher dimensional spaces.
failed to classify data appropriately. On the contrary We aimed to exploit the high dimensional space by
low value of C indicates that the model will tolerate using SVM as the classifier. Thus, the feature maps
few misclassified data. The kernel used in this study produced by the modified CNN had to be transformed
is the Radial Basis Function (RBF). RBF was chosen so it can be used for training by the SVM.
because of its to classify data on datasets that have The modified CNN model produced 3-
many features or have high dimensions. Apart from dimensional array feature maps as an output, and
the C parameter RBF's prediction results are also therefore, a transformation must be applied so the
influenced by the γ parameter as shown in Eq. (4). feature maps can be used by the SVM model (Fig. 8).
 For example, sequences of feature-maps with a size
 ( , ) = exp(− ‖ − ‖2 ) (4) of 5,365 × 700 × f have to be stacked in the first place,
 making it one long sequence with a size of 3,755,500
 Fig. 5 shows how the value of γ from Eq. (4) × 512. Furthermore, zero-padding is then removed
affects the gaussian curve. A high value of γ will be from the sequence as the SVM does not need to
resulting in more curvature on the decision predict any zero-paddings. The transformation was
boundaries. Otherwise, a small value of γ will be done so that the SVM could train and test the data
resulting in smoother decision boundaries. The exact seamlessly. The transformed feature maps were then
value of C and γ have to be found so that the SVM used as an input for the SVM models. SVM was
can generalize the data properly. chosen as a replacement of the dense layers as it has
 In this study, SVM was used to predict the shown several good performances when it comes to
secondary structure of proteins by using transformed predicting data with a high dimension of features [6-
feature maps from CNN’s last shift-and-stitch layer 7]. Moreover, some studies have shown that SVM is
as the input. f number of features from every index of as powerful as dense layers when it comes to

International Journal of Intelligent Engineering and Systems, Vol.14, No.1, 2021 DOI: 10.22266/ijies2021.0228.23
Received: September 4, 2020. Revised: October 31, 2020. 238

 Figure. 7 Detailed architecture of Hybrid CNN-SVM

 layers, dropout rate, activation function, and
 dense layers hidden units (see Table 3).
 We then fine-tuned the models by looking for the
 best combination of 3 parameters, which are
 convolution layers, convolution size, and feature
 maps size, with their value tabulated in Table 4. We
 provided the detailed results of the CNN models in
 Table 5. Table 5 shows that increasing the number of
 feature maps did increase the accuracy score for some
 models, but at the same time did not increase the
 accuracy score for the rest.
 Thus, we conclude that the number of feature
Figure. 8 Feature maps from CNN being transformed and maps does not give significant effects in this study.
 cleaned from zero-padding The convolution size also seems doesn't have any
 impact on increasing the accuracy score. Each model
recognizing patterns [22,24]. Thus, instead of using with the same number of convolution layers and
dense layers in CNN, we are using SVM as a feature maps show a no increasing nor decreasing
substitute. We then fine-tuned, trained, and tested the trend. However, increasing the number of
models. The SVM will produce a secondary structure convolution layers does increase the accuracy for the
class output, which will then be evaluated using the
accuracy methods Q3 and Q8. The Q3 and Q8 Table 3. CNN’s fixed parameters
accuracy methods are the accuracies obtained by Parameter Value
calculating the number of correct predictions divided Dense Layers 1
by the total number of test data.
 Dense Layer Neurons 512
5. Results Input Dropout 0.2
 Dropout 0.5
 There are several stages conducted in this study: Activation Function { ReLU, Softmax }
searching for optimal parameter values for the CNN,
modifying the CNN model so it can produce input
 Table 4. CNN’s fine-tune parameters
data for the SVM, and searching for optimal
 Parameter Value
parameter values for the SVM. We decided to
determine some unchangeable parameters value for Convolution Layers { 2, 3, 4}
the CNN, namely pooling size, the number of dense Convolution Size { 6, 7, 8, 9, 10 }
 Feature maps { 512, 1024}

International Journal of Intelligent Engineering and Systems, Vol.14, No.1, 2021 DOI: 10.22266/ijies2021.0228.23
Received: September 4, 2020. Revised: October 31, 2020. 239
Table 5. CNN’s performance measures Table 6. Measurements of fine-tuned CNN
Convolution Convolution Feature Accuracy Label Total True Precisi Recall
Layers Size map (%) Label Positive on
2 6 512 67.701 H 26,157 24,045 0.8378 0.9193
2 7 512 67.509 E 18,016 14,525 0.7574 0.8062
2 8 512 67.990 L 17,920 11,576 0.5527 0.646
2 9 512 68.012 T 10,013 5,325 0.53 0.5318
2 10 512 68.097 S 8,316 1,909 0.4792 0.2296
3 6 512 68.521 G 3,132 834 0.454 0.2663
3 7 512 68.329 B 1,181 29 0.3867 0.0246
3 8 512 68.387 I 30 0 0 0
3 9 512 68.442 Total 84,765 58,243
3 10 512 68.291
4 6 512 68.467 Table 7. SVM’s fine-tune parameters
4 7 512 68.711 Parameter Value
4 8 512 68.535 C { 0.01, 0.1, 1, 10 }
4 9 512 68.594 γ { 0.001, 0.01, 0.1, 1
4 10 512 68.344
Table 8. SVM’s fine-tune parameters
2 6 1024 67.918
Parameters
2 7 1024 67.799 Accuracy (%)
C γ
2 8 1024 67.731
0.01 0.001 0.035
2 9 1024 67.890
0.01 0.01 57.048
2 10 1024 67.750
0.01 0.1 68.353
3 6 1024 68.445
0.01 1 67.549
3 7 1024 68.266
0.1 0.001 55.826
3 8 1024 68.450
0.1 0.01 68.299
3 9 1024 68.468
0.1 0.1 68.548
3 10 1024 68.341
0.1 1 68.626
4 6 1024 68.486
1 0.001 68.284
4 7 1024 68.492
1 0.01 68.48
4 8 1024 68.434
1 0.1 68.636
4 9 1024 68.223
1 0.5 68.689
4 10 1024 68.174
1 0.75 68.682
majority of models with the same convolution size 1 1 68.721
and number of feature maps. The results show that 1 1.25 68.735
the highest accuracy was achieved when the number 1 1.5 68.734
of the convolution layers, convolution size, and 10 0.001 68.46
feature maps were 4, 7, and 512 respectively. 10 0.01 68.527
Afterwards, we modified the best model by 10 0.1 68.665
removing the dense layer, resulting in the model
10 1 68.085
giving 512 feature maps as an output. Note that by
doing this, we increase the number of features up to
12 times (from 42 features into 512 features). We use of 1,154,412 × 512. We also applied the same steps
SVM capabilities to exploit these high dimensional for CB513 dataset, which had a size of 514 × 700 ×
features, but firstly the feature maps produced by the 512 after being transformed by the modified CNN
modified CNN need to be transformed so it can be model. We then transformed the CB513 data into a 2-
used by the SVM. The CullPDB data produced from dimensional matrix, resulting in the data had a size of
the modified model. 84,765 × 512. Notice that it is not 3,755,500 × 512
Had a size of 5,365 × 700 × 512, which then (CullPDB) and 359,800 × 512 (CB513) as we
transformed into a 2-dimensional matrix with the size removed the zero-padding from both datasets. Labels
of both datasets were also transformed by the same
International Journal of Intelligent Engineering and Systems, Vol.14, No.1, 2021 DOI: 10.22266/ijies2021.0228.23Received: September 4, 2020. Revised: October 31, 2020. 240
MUST-CNN [4] and, in this study, we tried to
maximize the potencies of the model by fine-tuning,
increasing the dimension of the features, and
replacing the dense layers with SVM.
The best CNN model encountered common
problems when classifying imbalanced data, which
was failing to classify labels with low occurrences.
As tabulated in Table 6, the model failed to classify
several minor labels as shown by low recall score for
label S, G, B, and I. We believe that the CNN’s
convolution layers only managed to capture the
features of the labels with high occurrences while
ignoring labels with lower occurrences. We tried to
Figure. 9 Line chart of accuracy by C and γ tackle this issue by doing class weighting and random
sampling, yet the model still failed to capture the
Table 9. Measurements of fine-tuned CNN-SVM hybrid minor labels' signature features. There is also a
Label Total True Precision Recall possibility where the minor classes don't have a
Label Positive signature feature that differs them from the other
H 26,157 23,739 0.8534 0.9076 classes. We also suspect that the missing of low-level
E 18,016 14,412 0.7629 0.8 feature information from lower layers might be the
L 17,920 11,845 0.5480 0.661 cause of the CNN model failing to classify minor
T 10,013 5,339 0.5291 0.5332 classes in higher layers. In the other words, our model
S 8,316 1,986 0.4907 0.2388 might be able to capture long-range
G 3,132 896 0.4075 0.2861
interdependencies but failed to retrieve local context.
The use of SVM instead of dense layers surprisingly
B 1,181 46 0.4259 0.039
increased the Q8 accuracy, up to 0.024% higher than
I 30 0 0 0 the fine-tuned CNN model (see Table 10). However,
Total 84,765 58,263 the SVM suffered the same problem as CNN, which
is failing to classify minor labels (see Table 9). Once
steps with the addition of argmax operation, resulting again, we tried to weight the training data, hoping to
in a 2-dimensional matrix with the size of 1,154,412 tackle the imbalanced data issue but ended up failing
× 1 for the CullPDB dataset and 84,765 × 1 for the to get a model with high accuracy. We believe our
CB513 dataset. Fig. 8 illustrates how the SVM also suffers the same issue because it used
transformation was done with CullPDB dataset as an feature maps from the CNN model as an input, which
example. mostly contains features from labels with high
We selected the Radial Basis Function as the occurrences.
kernel for SVM. We also conduct a kind of grid- Furthermore, our models obtained higher Q8
search, aiming to find the best combination of several accuracy compared to various models [4-6,16-17].
values of C and γ as tabulated in Table 7. From Fig. Our models managed to outmatch previous related
9, we noticed an increasing trend in accordance with study that used MUST-CNN architecture [4]. The
increasing values of C and γ. We also saw that when study has the most similarity with our study’s CNN
C = 1 and γ = 1 the model managed to outmatch the model. However, our non-hybrid CNN model scored
other models. Thus, we fine-tuned the SVM for the 0.311% higher Q8 score than the previous study by
second time, this time using 1 as the value of C and scoring Q8 68.711% in CB513 dataset (see Table 10).
the values of γ were set to be close at 1 {0.5, 0.75, We suspect that it is happened because of by using a
1.25, 1.5} (see Table 8). The model reached its top different architecture on the same technique will
performance when the value of C = 1 and the value result in different prediction capabilities.
of γ = 1.25. The detailed performance of the best Consequently, our hybrid model scored higher Q8
model is tabulated in Table 9. score compared to a previous study [4], scoring
68.735% in Q8 accuracy or about 0.355% higher
6. Discussion (roughly 283 true positives labels differences with the
We have introduced a combination of CNN and previous study). Thus, proof that the SVM is capable
SVM for predicting the secondary structure of the of increasing the classifier's ability to predict.
protein. The CNN architecture was inspired by Our proposed architecture scored 0.435% higher
in Q8 accuracy to a study that used Deep-CNF [5].
International Journal of Intelligent Engineering and Systems, Vol.14, No.1, 2021 DOI: 10.22266/ijies2021.0228.23Received: September 4, 2020. Revised: October 31, 2020. 241 We suspect that this previous study [5] has head-to- We also converted the prediction results into 3 head capabilities compared to MUST-CNN study [4], class of secondary structure of the protein and while our model has a slightly better performance compared it with several related studies as tabulated when compared to them. Moreover, our model scored in Table 11. Our model performs better than studies higher Q8 accuracy score than Multi-scale CNN [6]. that used SVM [6-7] and study that used sequence Our model’s CNN architecture differs from this embedding [16], scoring Q3 accuracy of 81.49% for Multi-scale CNN study in terms of the existence of CNN-SVM hybrid model. Our model performed highway connector between each convolutional layer. better than studies that used SVM [6-7]. These We realised that it might be possible for our model to studies used the sliding window as an input receiver score higher by applying a connecting-highway for the SVM, which limits the models to capture technique as used by the previous study [6]. relation of sequences’ distant features. Our model Our hybrid model outperforms DeepSeqVec and didn’t suffer the problem, and we suspect that it has DeepProf+SeqVec model [16] by 2.735% and happened because the convolution process in our 6.235%. We notice that our study used the same model managed to capture the sequences’ distant feature maps size (1024) as theirs and got similar Q8 features. We notice that the limitation of both accuracy results. However, they showed an increase previous studies in capturing distant relation cause up to 3.8% by combining embedding with several our model to outperform theirs. The Previous study different features. We suspect that the previous study [16] also converted its Q8 accuracy result into Q3 [16] produced a different result compared to our accuracy, with our model having higher accuracies study purely because of the different implementation than theirs (in line with Q8 accuracy). of CNN architecture (as we were using the MUST- CNN technique and previous study use their own 7. Conclusion CNN architecture, proofing that the MUST-CNN is a We have proposed and demonstrated the reliable technique to be used in sequence labelling possibility of combining CNN and SVM to do a task). Finally, we also outperform a study that sequence labelling task, specifically to predict the implemented Bi-RNN Single Model as their secondary structure of the protein. We used CB513 architecture [17]. This architecture was way more dataset in this study. Orthogonal encoding and complex compared to ours, while our architecture Position Specific Scoring Matrix (PSSM) were used still managed to score a higher Q8 accuracy score, as features. We used Shift-and-Stitch technique in the beating theirs by 0.235%. CNN to tackle the resolution problems that occur Table 10. Comparison of different models’ performance because of convolution and pooling stages. We then on CB513 dataset (Q8) modified the CNN by removing its dense layers, Model Q8 (%) resulting in the CNN producing feature maps of the dataset. This step was meant to transform the data DeepSeqVec [16] 62.5 ± 0.6 into higher dimensional space and enrich the features. DeepProf+SeqVec [16] 66.0 ± 0.5 Afterwards, we trained the SVM with the feature Deep-CNF [5] 68.3 maps produced from previous steps. The SVM was Multi-scale CNN One-Hot Encoded [6] 68.3 used as it is capable to classify data with high MUST-CNN [4] 68.4 dimensional features. We fine-tuned both CNN and Bi-RNN Single Model [17] 68.5 SVM parameters to find the best combinations that Fine-tuned CNN (Ours) 68.711 produce the best accuracy. We showed that our CNN Fine-tuned CNN-SVM (Ours) 68.735 managed to capture long-range interdependencies between each residue in sequences. Using SVM as an Table 11. Comparison of different models’ performance alternative of dense layers in classifying high on CB513 dataset (Q3) dimensional data enables the model to achieve a Model Q3 (%) higher accuracy score by up to 0.024% in Q8 accuracy. Our hybrid model achieved Q3 accuracy of DeepSeqVec [16] 76.9 ± 0.5 81.49% Q8 accuracy of 68.735% on CB513 dataset. SVM-GA [6] 76.11 In future works, it is possible to add more features SVM-SF [7] 78.0 like relative and absolute solvent accessibility. DeepProf + SeqVec [16] 80.7 ± 0.5 Fine-tuned CNN-SVM (Ours) 81.49 Conflicts of Interest The authors declare no conflict of interest. International Journal of Intelligent Engineering and Systems, Vol.14, No.1, 2021 DOI: 10.22266/ijies2021.0228.23
Received: September 4, 2020. Revised: October 31, 2020. 242

Author Contributions Conf. (ITNEC), Chongqing, China, pp. 502-505,
 2016.
 Conceptualization, Afiahayati; methodology, [8] Y. Chen, Y. Liu, J. Cheng, and Y. Wang,
Vincent Michael Sutanto, Zaki Indra Sukma, and “Prediction of protein secondary structure using
Afiahayati; software, Vincent Michael Sutanto, Zaki
 SVM-PSSM Classifier combined by sequence
Indra Sukma, and Afiahayati; validation, Vincent
 features”, In: Proc. of 2016 IEEE Advanced
Michael Sutanto, Afiahayati; formal analysis, Information Management, Communicates,
Vincent Michael Sutanto, Afiahayati; writing - Electronic and Automation Control Conf.
original draft preparation, Vincent Michael Sutanto; (IMCEC), Xi'an, China, pp. 103-106, 2016.
writing - review and editing, Afiahayati; supervision, [9] Afiahayati, E. Anarossi, R. D. Yanuaryska, F. U.
Afiahayati. Nuha, S. Mulyana, “Comet Assay Classification
 for Buccal Mucosa’s DNA Damage
References Measurement with Super Tiny Dataset Using
[1] M. Zamani and S. C. Kremer, “Protein Transfer Learning”, Intelligent Information and
 secondary structure prediction through a novel Database Systems: Recent Developments,
 framework of secondary structure transition Studies in Computational Intelligence, Vol. 830,
 sites and new encoding schemes”, In: Proc. of pp. 279-289, 2020.
 IEEE International Conf. on Computational [10] D. U. N. Qomariah, H. Tjandrasa, and C.
 Intelligence in Bioinformatics and Fatichah, “Classification of Diabetic
 Computational Biology (CIBCB 2016), Chiang Retinopathy and Normal Retinal Images using
 Mai, Thailand, pp. 1-7, 2016. CNN and SVM”, In: Proc. of 2019 12th
[2] T. L. Blundell, S. Bedarkar, E. Rinderknecht, International Conf. on Information &
 and R. E. Humbel, “Insulin-like growth factor: a Communication Technology and System (ICTS),
 model for tertiary structure accounting for Surabaya, Indonesia, pp. 152-157, 2019.
 immunoreactivity and receptor binding”, In: [11] T. Okamoto, T. Koide, S. Yoshida, H. Mieno, H.
 Proc. of the National Academy of Sciences of the Toishi, T. Sugawara, M. Tsuji, M. Odagawa, N.
 United States of America, Vol. 75, No. 1, Tamba, T. Tamaki, B. Raytchev, K. Kaneda, and
 pp.180-184, 1978. S. Tanaka, “Implementation of Computer-Aided
[3] J. Zhou and O. G. Troyanskaya, “Deep Diagnosis System on Customizable DSP Core
 Supervised and Convolutional Generative for Colorectal Endoscopic Images with CNN
 Stochastic Network for Protein Secondary Features and SVM”, In: Proc. of TENCON 2018
 Structure Prediction”, In: Proc. of the 31st - 2018 IEEE Region 10 Conf., Jeju, Korea
 International Conf. on Machine Learning (South), pp. 1663-1666, 2018.
 (ICML 2014), Bejing, China, pp. 745-753, 2014. [12] Z. Wang and Z. Qu, “Research on Web text
[4] Z. Lin, J. Lanchantin, and Y. Qi, “MUST-CNN: classification algorithm based on improved
 A Multilayer Shift-and-Stitch Deep CNN and SVM”, In: Proc. of 2017 IEEE 17th
 Convolutional Architecture for Sequence-based International Conf. on Communication
 Protein Structure Prediction”, In: Proc. of the Technology (ICCT), Chengdu, China, pp. 1958-
 Thirtieth AAAI Conf. on Artificial Intelligence 1961, 2017.
 (AAAI-16), Phoenix, Arizona, pp. 27-34, 2016. [13] Y. Chen and Z. Zhang, “Research on text
[5] S. Wang, J. Peng, J. Ma, and J. Xu, “Protein sentiment analysis based on CNNs and SVM”,
 Secondary Structure Prediction Using Deep In: Proc. of 2018 13th IEEE Conf. on Industrial
 Convolutional Neural Fields”, Scientific Reports, Electronics and Applications (ICIEA), Wuhan,
 Vol. 6, No. 18962, 2016. China, pp. 2731-2734, 2018.
[6] J. Zhou, H. Wang, Z. Zhao, R. Xu, and Q. Lu, [14] V. M. Sutanto, Prediksi Struktur Sekunder
 “CNNH_PSS: protein 8-class secondary Protein Menggunakan Convolutional Neural
 structure prediction by convolutional neural Network dan Support Vector Machine (in
 network with highway”, BMC Bioinformatics, English: Protein Secondary Structure Prediction
 Vol. 19, No. 60, 2018. using Convolutional Neural Network and
[7] Y. Wang, J. Cheng, Y. Liu, and Y. Chen, Support Vector Machine), Bachelor Thesis,
 “Prediction of protein secondary structure using Universitas Gadjah Mada, Indonesia, 2020.
 support vector machine with PSSM profiles”, In: [15] Z. I. Sukma, Prediksi Struktur Sekunder Protein
 Proc. of 2016 IEEE Information Technology, Menggunakan Convolutional Neural Network
 Networking, Electronic and Automation Control (in English: Protein Secondary Structure
 Prediction using Convolutional Neural
International Journal of Intelligent Engineering and Systems, Vol.14, No.1, 2021 DOI: 10.22266/ijies2021.0228.23
Received: September 4, 2020. Revised: October 31, 2020. 243

 Network), Bachelor Thesis, Universitas Gadjah
 Mada, Indonesia, 2017.
[16] M. Heinzinger, A. Elnaggar, Y. Wang, C.
 Dallago, D. Nechaev, F. Matthes, and B. Rost,
 “Modeling aspects of the language of life
 through transfer-learning protein sequences”,
 BMC Bioinformatics, Vol. 20, No. 723, 2019.
[17] A. R. Johansen, C. K. Sønderby, S. K. Sønderby,
 and O. Winther, “Deep Recurrent Conditional
 Random Field Network for Protein Secondary
 Prediction”, In: Proc. of the 8th ACM
 International Conf. on Bioinformatics,
 Computational Biology, and Health Informatics,
 Boston, Massachusetts, pp. 73-78, 2017.
[18] J. A. Cuff and G. J. Barton, “Application of
 multiple sequence alignment profiles to improve
 protein secondary structure prediction”,
 Proteins, Vol. 40, No. 3, pp.502-511, 2000.
[19] Goodfellow, Y. Bengio, and A. Courville, Deep
 Learning, 2016.
[20] P. Sermanet, D. Eigen, X. Zhang, M. Mathieu,
 R. Fergus, and Y. LeCun, “OverFeat: Integrated
 Recognition, Localization and Detection using
 Convolutional Networks”, In: Proc. of 2nd
 International Conf. on Learning
 Representations (ICLR 2014), Banff, Canada,
 2014.
[21] F. Chollet, Keras, 2015.
[22] C. Cortes and V. Vapnik, “Support-vector
 networks”, Mach Learn, Vol. 20, pp. 273-297,
 1995.
[23] Z. Wen, J. Shi, Q. Li, B. He, and J. Chen,
 “ThunderSVM: a fast SVM library on GPUs and
 CPUs”, The Journal of Machine Learning
 Research, Vol. 19, No. 1, pp. 1-5, 2018.
[24] B. Schölkopf, C. Burges, and V. Vapnik,
 “Extracting Support Data for a Given Task”, In:
 Proc. of the First International Conference on
 Knowledge Discovery and Data Mining, Menlo
 Park, California, pp. 252-257, 1995.

International Journal of Intelligent Engineering and Systems, Vol.14, No.1, 2021 DOI: 10.22266/ijies2021.0228.23
You can also read