Influence Factors of Understanding Business Process Models
←
→
Page content transcription
If your browser does not render page correctly, please read the page content below
Influence Factors of Understanding Business
                  Process Models

                     Jan Mendling1 and Mark Strembeck2
                1
                 BPM Cluster, Faculty of Information Technology
                 Queensland University of Technology, Australia
                             j.mendling@qut.edu.au
               2
                 New Media Lab, Institute of Information Systems
       Vienna University of Economics and Business Administration, Austria
                         mark.strembeck@wu-wien.ac.at

      Abstract. The increasing utilization of business process models both
      in business analysis and information systems development raises several
      issues regarding quality measures. In this context, this paper discusses
      understandability as a particular quality aspect and its connection with
      personal, model, and content related factors. We use an online survey
      to explore the ability of the model reader to draw correct conclusions
      from a set of process models. For the first group of the participants we
      used models with abstract activity labels (e.g. A, B, C) while the second
      group received the same models with illustrative labels such as “check
      credit limit”. The results suggest that all three categories indeed have
      an impact on the understandability.

1   Introduction
Even though workflow and process modeling have been used extensively over the
past 30 years, we know surprisingly little about the act of modeling and which
factors contribute to a “good” process model in terms of human understandabil-
ity. This observation contrasts with the large body of knowledge that is available
for the formal analysis and verification of desirable properties, in particular for
Petri nets. To guarantee a certain degree of design quality of the model artifact
in a wider sense, several authors propose guidelines for the act of modeling [1, 2]
but yet with little impact on modeling practice. Clearly, an empirical research
agenda is required for acquiring new insights into quality [3] and usage aspects
[4] of process modeling.
     Following this line of argument, a recent empirical study provides evidence
that larger, real-world process models tend to have more formal flaws (such as
deadlocks) than smaller models [5, 6]. One obvious hypothesis related to this
phenomenon would be that human modelers lose track of the interrelations of
large and complex models due to their limited cognitive capabilities [7], and then
introduce errors that they would not insert in a small model. There are other
factors beyond size that presumably affect the understandability of a process
model such as the degrees of sequentiality, concurrency, or structuredness [8].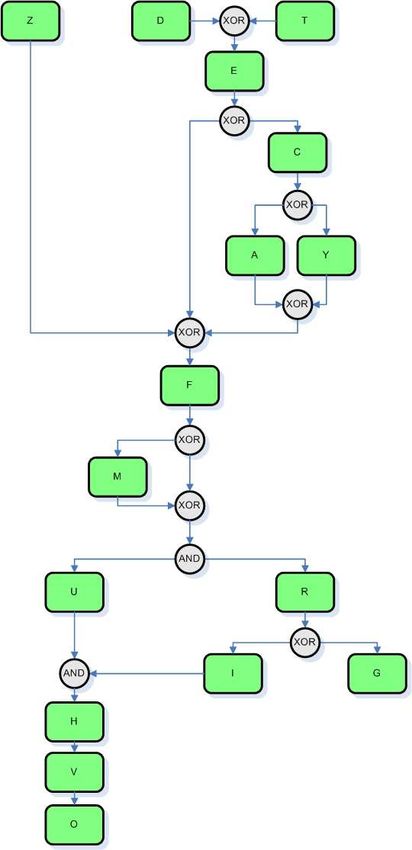
Validating such hypothetical relationships empirically would not only represent
a major step forward towards understanding quality of process models beyond
verification, but also provide a sound theoretical basis for defining guidelines for
process modeling in general.
Since only little research has been conducted on quality aspects of process
models so far [3, 9], we approach this area with an experimental design focusing
on the understandability of process models (not of process modeling languages).
By having a online questionnaire filled out, we aim to gain insight into empirical
connections between personal and model characteristics and the ability of a
person to understand a process model properly. In particular, we want to find out
how the textual content of the activity labels might influence understandability.
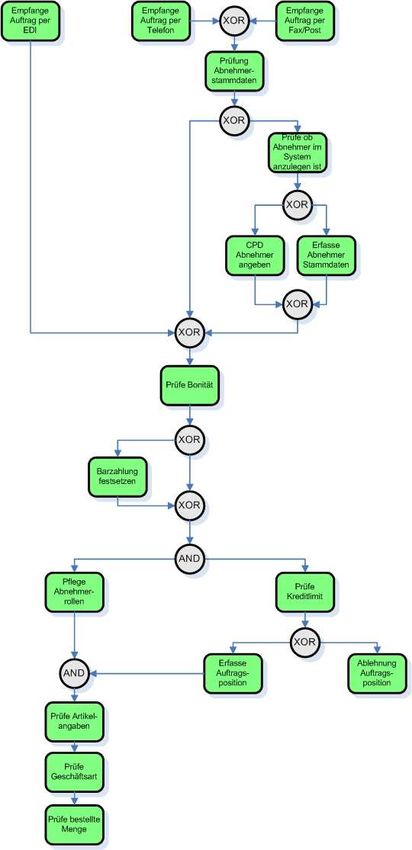
Figures 1 and 2 show two process model variants that were included in the
questionnaire.
Our contribution related to process model understandability is twofold. First,
we operationalize understandability and identify three categories of factors, i.e.
personal, structural, and textual, that potentially influence model understand-
ability. Second, we present the findings from an experiment that tested the rela-
tive importance of these factors. Indeed, all three categories appear to be relevant
according to a logistic regression model for the experiment data. Against this
background, the remainder of the paper is structured as follows. In Section 2 we
discuss related work and identify a lack of empirically validated insight on the
understandability of process models. Then, Section 3 introduces the research de-
sign, in particular, the conceptualization of the questionnaire and the data that
we gather. In Section 4 we present the results of the statistical analysis. Sec-
tion 5 concludes the paper, discusses limitations of the findings, and identifies
open questions that need to be addressed by future research.
2 Related Work on Understandability
There are basically three streams of research related to our work in the concep-
tual modeling area: top-down quality frameworks, bottom-up metrics related to
quality aspects, and empirical surveys related to modeling techniques.
One prominent top-down quality framework is the SEQUAL framework [10,
11]. It builds on semiotic theory and defines several quality aspects based on
relationships between a model, a body of knowledge, a domain, a modeling lan-
guage, and the activities of learning, taking action, and modeling. In essence,
syntactic quality relates to model and modeling language; semantic quality to
model, domain, and knowledge; and pragmatic quality relates to model and mod-
eling and its ability to enable learning and action. Although the framework does
not provide an operational definition of how to determine the various degrees of
quality, it has been found useful for business process modeling in experiments
[12].
The Guidelines of Modeling (GoM) [2] define an alternative quality frame-
work that is inspired by general accounting principles. The guidelines include
the six principles of correctness, clarity, relevance, comparability, economic ef-Fig. 1. Model 4 with Text (in German) Fig. 2. Model 4 with Letters ficiency, and systematic design. This framework was operationalized for Event- driven Process Chains (EPCs) and also tested in experiments [2]. Furthermore, there are authors [3] advocating a specification of a quality framework for con- ceptual modeling in compliance with the ISO 9126 standard for software quality [13]. A respective adaptation to business process modeling is reported in [14]. Our experiment addresses partial aspects of these frameworks. In particular, we focus on understandability of process models as an enabler of pragmatic quality (SEQUAL) and clarity (GoM). This requires us not only to ask about under- standability, but also check whether models are interpreted correctly. This is in line with research of [15] who experimented on conclusions that people can draw from models. In a more general design setting, the work on cognitive dimensions stresses understanding as one important interaction of a user with a model [16].
Several authors have published work on bottom-up metrics related to qual-
ity aspects of process models, stemming from different research and partially
isolated from each other [17–25] , or see [8] for an overview. Several of these
contributions are theoretic without empirical validation. Most authors doing ex-
periments focus on the relationship between metrics and quality aspects: [23]
study the connection mainly between count metrics – for example, the number
of tasks or splits – and maintainability of software process models; [26] vali-
dates the correlation between control flow complexity and perceived complexity;
and [6, 8] use metrics to predict control flow errors such as deadlocks in process
models. The results reveal that an increase in size of a model appears to have
a negative impact on quality. This finding has an impact on the design of our
questionnaire. To gain insights that are independent of process size, we keep the
number of tasks constant and study which other factors might have an impact
on understandability.
    Finally, there are some empirical surveys related to modeling techniques.
[27] study how business process modeling languages have matured over time.
While this is valuable research it does not reveal insights on single, concrete
process models. The same holds for [28] who study the usability of UML. [29]
approach understandability, not of individual process models, but on the level of
the modeling language. They find that EPCs seem to be more understandable
than Petri nets. Inspired by this survey we decided to use an EPC-like notation
in our questionnaire to minimize the impact of the notation on understandability.
    To summarize, there is essentially one relation that seems to be confirmed by
related research, and that is that larger models tend to be negatively connected
with quality. The aim of our questionnaire is to enhance this rather limited body
of knowledge.

3   Research Design

Related to understandability, we identify the following six research questions
related to the factors that might influence understandability of process models
[29, 8, 30, 11, 9]:

1. What personal factors (beyond general psychological and intellectual factors)
   have an influence?
2. Which model characteristics (e.g. number and type of splits) contribute to
   a good understandability?
3. How is understandability related to the textual content that is described in
   the model?
4. How does the modeling purpose (e.g. documentation versus enactment) re-
   late to understandability?
5. Which differences in understandability exist when observing semantically
   equivalent models described in different modeling languages?
6. What is the impact of different visual layout strategies or graph drawing
   algorithms on understandability?
We approach these questions with an experimental design focusing on per-
sonal, model, and content characteristics (question 1, 2, and 3). Furthermore,
we strive to neutralize the influence of the other factors: related to question 4,
we gathered a set of process models from practice that capture different do-
mains such as order processing and price calculation. All models were created
for documentation purposes (question 4). Based on the observation by [29] that
EPCs appear to be easier to understand than Petri nets, we chose an EPC-like
notation without events (question 5). The participants received a short informal
description of the semantics similar to [31, p.25]. Finally, we drew all models in
the same top-to-bottom style with the start element at the top and end element
at the bottom (question 6).
The experiment was conducted in three phases. First, we collected a set of
six process models from practice that could be displayed on an A4 page. For
each of these models we constructed a variant where the activity labels were
replaced by capital letters as identifiers. The models were similar to model 4
depicted in Figures 1 and 2. For the 6 models we identified 6 yes/no questions
related to the structure and the behavior specified by the model. These ques-
tions together with questions on personal experience and knowledge of process
modeling were packed into two variants of the questionnaire, one for models
with textual activity labels, one for models with letters. Second, we developed a
website for conducting the survey as an online questionnaire. We chose an online
questionnaire to get practitioners with modeling experience involved more eas-
ily. Furthermore, we were able to record the answer times, randomly define the
presentation order of the 6 models, and we could randomly assign a question-
naire variant to the participant. Participation was voluntary. As an incentive
the participants received feedback about their performance. Finally, the data
was analyzed using the statistical software package SPSS.
3.1 Data gathered in the Survey
In the survey we gathered the following data related to the participants:
– theory: The participants had to answer six theoretical yes/no questions
without before seeing the models about selected topics related to process
modeling such as choices, concurrency, loops, and deadlocks. theory cap-
tures the sum of correct answers to these questions.
– duration: The participants were asked for how long they have been involved
with business process modeling. The variable was measured ordinally on four
levels: less than one month, less than a year, less than three years, and longer
than three years.
– intensity: The participants had to indicate how often they work with pro-
cess models. There were four options to answer: daily, monthly, less frequent
than monthly, never.
– time: This variable measures the time that the participants invested in an-
swering the questionnaire.
– text: This variable indicates whether the activities had textual labels (value
1) or only abstract letters (value 0).– pscore: This variable is calculated based on the answers given by the par-
ticipant to the model related questions. It captures the number of correct
answers by the person. The maximum value is 36 for six questions on six
models. This variable serves as an operationalization of understandability
related to a person.
Furthermore, we calculated some model metrics from the set proposed by [8].
These include:
– size: This variable refers to the number of nodes of the process model graph.
– diameter gives the length of the longest path from a start node to an end
node in the process model.
– structuredness of the process graph is one minus the number of nodes in
structured blocks divided by the number of nodes.
– separability relates the number of cut-vertices to the number of nodes.
– token split sums up all concurrent threads that can be activated by AND-
splits and OR-splits in the process.
– cyclicity relates number of nodes on cycles to all nodes.
– heterogeneity gives the type entropy of the connectors.
– sound indicates whether the process model is sound according to [32].
– mscore: This variable is calculated based on the answers given by the partic-
ipants to the model related questions. It captures the sum of correct answers
for this model. This variable serves as an operationalization of understand-
ability related to a model.
Finally, we also measured aspects related to the textual labels of the model and
correct answers to individual questions:
– textlength gives the string length of all textual activity labels in the
process model.
– correctanswer captures for each individual question answered by a par-
ticipant whether it was answered correctly (value 1) or not (value 0). This
variable serves as an operationalization of understandability related to a
model aspect.
We distributed the link to the experiment via the German mailing lists
EMISA and WI as well as among students that followed courses on process
modeling at the Vienna University of Economics and Business Administration.
Typically both academics and practitioners with an interest in conceptual mod-
eling and information systems development are registered with these lists. The
questionnaire was started by 200 persons and completed by 46. From these 46 we
excluded 4 people who spent less than 10 minutes (time) on the questionnaire
since we assumed that to be the minimum time to provide meaningful answers.
These 42 persons and their answers to the 36 questions establish the sample
for our statistical analysis below. Altogether, 1512 answers are recorded in the
sample. 65% of the participants had more than three years experience in process
modeling.3.2 Hypothetical Relations between Factors and Understandability Before conducting the statistical analysis we make hypothetical connections be- tween the different variables explicit. In particular, we identify hypotheses related to personal factors, model factors, and content factors: P1 A higher pscore of participants should be connected with higher values in theory, duration, intensity, and time. M1 A higher mscore of models should be associated with lower values in size, diameter, token split, and heterogeneity since these metrics might indicate that the model is easier to comprehend. M2 A higher mscore of models should be connected with higher values in structuredness, separability, and sound since these metrics might be associated with models that are easier to comprehend. C1 A higher sum of correctanswer should be connected with abstract labels (value of 0 in text), basically our questions refer to structural properties of the model. C2 A correctanswer (value of 1) should be connected with a lower value in textlength, since it becomes harder to match the elements mentioned in the question with the elements in the graphical model. In the following section we will use statistical methods to assess these hypotheses. 4 Results In this section we present the results of our survey. First, we discuss the distri- bution of personal, model, and content factors as well as their correlation with the corresponding score. Then, we use logistic regression to gain insight into the relative importance of the different factors for predicting whether a question would be answered correctly. 4.1 Personal Factors Figure 3 gives an overview of the pscore that the different participants achieved in the survey. The mean value was 25.21 for 36 questions which means that on av- erage 70% of the questions were answered correctly. The best participant had 34 questions correct and two questions wrong. The correlation with some variables of P1, i.e. duration, intensity, and time, was weakly positive, but not signif- icant. In contrast to that, the Pearson correlation between pscore and theory was positive and significant (p=0.01) with a value of 0.491. This might indicate that theoretical process modeling knowledge helps to answer questions correctly. Furthermore, theory was positively and significantly (p=0.01) correlated with intensity of process modeling experience (0.438).
100%                                                                100%

           80%                                                                 80%
  PSCORE

                                                                      MSCORE
           60%                                                                 60%

           40%                                                                 40%

           20%
                                                                               20%
            0%
                                                                                0%
                  1   5   9   13   17   21   25   29   33   37   41                    1    2    3           4   5   6

                                    PERSON                                                           MODEL

             Fig. 3. pscore of participants                                           Fig. 4. mscore of model

4.2          Model Factors

Figure 4 gives an overview of the mscore that the different participants achieved
per model. The mean percentage was 70% across the models. The model with
the lowest mscore had on average 60% correct answers. This model had loops
and parallel execution paths. From the variables mentioned in M1 and M2 only
separability had a significant correlation according to Spearman with mscore
of 0.886 (p=0.019). This strongly confirms the hypothetical impact direction of
M2. The other variables showed a direction of correlation as expected, but with-
out a sufficient significance. As an exception, structuredness had zero correlation
in our sample.

4.3          Content Factors

Table 1 gives an overview of the sum of correctanswer disaggregated by
text. This table directly relates to hypothesis C1. The difference between both
questionnaire types is quite narrow, such that the hypothesis cannot be con-
firmed. Furthermore, we calculated the correlation between correctanswer
and textlength. The Pearson correlation coefficient of -0.836 on a significance
level above 0.01 supports the hypothesis. Apparently, it becomes harder to match
the elements mentioned in the question with the elements in the graphical model
when the text labels get larger.

Table 1. Sum of correctanswer for the two model variants (text=0 is abstract
letters and text=1 textual labels

                                                  text correct all  %
                                                     0 608 828 73.43%
                                                     1 493 684 72.08%
4.4 Prediction of Correct Answers
Up to now, we have studied bivariate correlations between different hypothetical
factors and different score variables as proxies for understandability. In this sec-
tion we investigate the combined capability of the factors to explain the variance
of the dependent variable correctanswer. This variable captures whether a
single question related to a model was answered correctly by a participant. As
the dependent variable is binary, we use a logistic regression (logit) model. The
idea of a logit model is to model the probability of a binary event by its odds,
i.e., the ratio of event probability divided by non-event probability. These odds
pi
are defined as logit(pi ) = ln( 1−p i
) = B0 + B1 x1,i + . . . + Bk xk,i for k input
variables and i observations, i.e. EPC i in our context. From this follows that
eB0 +B1 x1,i +...+Bk xk,i
pi =
1 + eB0 +B1 x1,i +...+Bk xk,i
The relationship between input and dependent variables is represented by an
S-shaped curve of the logistic function that converges to 0 for −∞ and to 1
for ∞. The cut value of 0.5 defines whether event or non-event is predicted.
Exp(Bk ) gives the multiplicative change of the odds if the input variable Bk is
increased by one unit, i.e. Exp(Bk ) > 1 increases and Exp(Bk ) < 1 decreases
error probability.
The significance of the overall model is assessed by the help of two statistics.
Firstly, the Hosmer & Lemeshow Test should be greater than 5% to indicate
a good fit based on the difference between observed and predicted frequencies
[33]. Secondly, Nagelkerke’s R2 ranging from 0 to 1 serves as a coefficient of
determination indicating which fraction of the variability is explained [34]. Fur-
thermore, each estimated coefficient of the logit model is tested using the Wald
statistic, for being significantly different from zero. The significance should be
less than 5%. We calculate the logistic regression model based on a stepwise
introduction of those variables that provide the greatest increase in likelihood.
For more details on logistic regression, see [33].
Figure 5 shows the result of the logistic regression estimation. The best model
is derived in step 4 since it covers the largest set of variables such that all
have a significance in the Wald statistic better than 5%. The Nagelkerke’s R2
for this step 4 model is 0.293 indicating that quite a considerable share of the
overall variance can be explained. Still, the Hosmer & Lemeshow Test is below
5% which signals that there seem to be other factors that are not covered by
the model. The model includes four variables, namely theory, separability,
textlength, and duration. While textlength appears to have a negative
effect on correctanswer as expected by C2, the other variables have a positive
impact on the correctness of answering a question. This confirms the hypotheses
P1 and M2. It is interesting to note that the step 4 model includes factors that
are related to all three influences that we identified, i.e. personal, model, and
content factors with the model factor separability having the greatest relative
impact.Variables in the Equationf
B S.E. Wald df Sig. Exp(B)
Step 1a THEORY .148 .009 300.694 1 .000 1.160
Step 2b SEPARABILITY 1.012 .384 6.966 1 .008 2.752
THEORY
.121 .013 86.815 1 .000 1.129
Step 3c TEXTLENGTH -.001 .000 2.831 1 .092 .999
SEPARABILITY 1.088 .387 7.908 1 .005 2.969
THEORY .133 .015 80.452 1 .000 1.142
Step 4d TEXTLENGTH -.001 .000 3.946 1 .047 .999
SEPARABILITY .935 .396 5.582 1 .018 2.548
THEORY .120 .016 52.634 1 .000 1.127
DURATION .006 .003 3.073 1 .080 1.006
Step 5e TEXTLENGTH -.001 .000 2.815 1 .093 .999
DIAMETER -.015 .010 2.493 1 .114 .985
SEPARABILITY 1.185 .428 7.677 1 .006 3.270
THEORY .140 .021 45.103 1 .000 1.150
DURATION .008 .004 4.601 1 .032 1.008
a. Variable(s) entered on step 1: THEORY
b. Variable(s) entered on step 2: SEPARABILITY
c. Variable(s) entered on step 3: TEXTLENGTH
d. Variable(s) entered on step 4: DURATION
e. Variable(s) entered on step 5: DIAMETER
f. Stepwise procedure stopped because removing the least significant variable result in a previously fitted
model.
Fig. 5. Logistic regression function estimated for the sample
5 Conclusions
In this paper we have used an online questionnaire to acquire insight into the
empirical connection between different influential factors and process model un-
derstandability. In particular, we focused on several personal, model, and content
related impact factors. By the help of a correlation analysis we found that the
personal factor theory (0.491), the model factor separability (0.886 Spear-
man), and the content factor textlength (-.836) were significantly correlated
with the different proxies for understandability. A multi-variate logistic regres-
sion analysis confirmed the importance and impact direction of these three vari-
ables, and also included duration in the statistical model. Altogether, the sur-
vey supports the hypothesis that personal, model, and content related factors
influence the understandability of business process models. This has strong im-
plications for business process modeling initiatives in organizations. First, there
is apparently a need for guidelines that lead to understandable process models
in terms of structure and text labels. Second, there is a need for training since
experienced modelers perform better in understanding.
The research design used in this paper has some limitations. Firstly, we only
investigated three categories of influence factors of understandability. Future
research will have to analyze other categories as well. Given the considerablenumber of impact factors that might be important ([9] mention at least six)
it will be difficult to study the relative importance of these factors. Secondly,
our experiment covered only a limited set of six models and a limited set of 42
participants. Future surveys need to have more models tested by each participant
for comprehending the relative importance of the different model metrics. This
implies challenges with motivation and fatigue. Finally, more participants are
needed to clearly identify which personal factors have the greatest impact on
understanding a process model.
Acknowledgement
The author would like to thank Wolfgang Hammel, Gerald Schneider, Yvonne
Tima, and Maria Weiler for their help in designing the questionnaire and con-
ducting the experiment.
References
1. Hoppenbrouwers, S.S., Proper, H.E., van der Weide, T.: A Fundamental View on
the Process of Conceptual Modeling. In: ER 2005, Proceedings. LNCS 3716. (2005)
128–143
2. Becker, J., Rosemann, M., v. Uthmann, C.: Guidelines of Business Process Mod-
eling. In van der Aalst, W., Desel, J., Oberweis, A., eds.: Business Process Man-
agement. LNCS 1806. (2000) 30–49
3. Moody, D.: Theoretical and practical issues in evaluating the quality of conceptual
models: current state and future directions. Data & Knowl. Eng. 55 (2005) 243–276
4. Davies, I., Green, P., Rosemann, M., Indulska, M., Gallo, S.: How do practitioners
use conceptual modeling in practice? Data & Knowl. Eng. 58 (2006) 358–380
5. Mendling, J., Moser, M., Neumann, G., Verbeek, H., Dongen, B., Aalst, W.: Faulty
EPCs in the SAP Reference Model. In S. Dustdar, J.F., Sheth, A., eds.: BPM 2006,
Proceedings. LNCS 4102. (2006) 451457
6. Mendling, J., Verbeek, H., Dongen, B., Aalst, W., Neumann, G.: Detection and
Prediction of Errors in EPCs of the SAP Reference Model. Data & Knowl. Eng.
(2007) accepted for publication.
7. Simon, H.: Sciences of the Artificial. 3rd edn. The MIT Press (1996)
8. Mendling, J.: Detection and Prediction of Errors in EPC Business Process Models.
PhD thesis, Vienna University of Economics and Business Administration (2007)
9. Mendling, J., Reijers, H., Cardoso, J.: What makes process models understandable?
In Alonso, G., Dadam, P., Rosemann, M., eds.: BPM 2007, Proceedings. LNCS
4714. (2007) 48–63
10. Lindland, O., Sindre, G., Sølvberg, A.: Understanding quality in conceptual mod-
eling. IEEE Software 11 (1994) 42–49
11. Krogstie, J., Sindre, G., Jørgensen, H.: Process models representing knowledge for
action: a revised quality framework. Europ. J. of Inf. Systems 15 (2006) 91–102
12. Moody, D., Sindre, G., Brasethvik, T., Sølvberg, A.: Evaluating the quality of
process models: Empirical testing of a quality framework. In Spaccapietra, S.,
March, S.T., Kambayashi, Y., eds.: ER 2002, Proceedings. LNCS 2503. (2002)
380–39613. ISO: Information technology - software product evaluation - quality characteristics
and guide lines for their use. ISO/IEC IS 9126 (1991)
14. Güceglioglu, A.S., Demirörs, O.: Using software quality characteristics to measure
business process quality. In van der Aalst, W., Benatallah, B., Casati, F., Curbera,
F., eds.: BPM 2005, Proceedings. LNCS 3649. (2005) 374–379
15. Gemino, A., Wand, Y.: Evaluating modeling techniques based on models of learn-
ing. Commun. ACM 46 (2003) 79–84
16. Green, T., Petre, M.: Usability analysis of visual programming environments: A
’cognitive dimensions’ framework. J. Vis. Lang. Comput. 7 (1996) 131–174
17. Lee, G., Yoon, J.M.: An empirical study on the complexity metrics of petri nets.
Microelectronics and Reliability 32 (1992) 323–329
18. Nissen, M.: Redesigning reengineering through measurement-driven inference. MIS
Quarterly 22 (1998) 509–534
19. Morasca, S.: Measuring attributes of concurrent software specifications in petri
nets. In: METRICS ’99, Proceedings (1999) 100–110
20. Reijers, H., Vanderfeesten, I.: Cohesion and coupling metrics for workflow process
design. In Desel, J., Pernici, B., Weske, M., eds.: BPM 2004, Proceedings. LNCS
3080. (2004) 290–305
21. Cardoso, J.: Evaluating Workflows and Web Process Complexity. In: Workflow
Handbook 2005. (2005) 284–290
22. Balasubramanian, S., Gupta, M.: Structural metrics for goal based business process
design and evaluation. Business Process Management Journal 11 (2005) 680–694
23. Canfora, G., Garcı́a, F., Piattini, M., Ruiz, F., Visaggio, C.: A family of exper-
iments to validate metrics for software process models. Journal of Systems and
Software 77 (2005) 113–129
24. Aguilar, E.R., Ruiz, F., Garcı́a, F., Piattini, M.: Towards a Suite of Metrics for
Business Process Models in BPMN. In Manolopoulos, Y., Filipe, J., Constantopou-
los, P., Cordeiro, J., eds.: ICEIS 2006, Proceedings (III). (2006) 440–443
25. Laue, R., Gruhn, V.: Complexity metrics for business process models. In Abramow-
icz, W., Mayr, H.C., eds.: BIS 2006, Proceedings. LNI 85. (2006) 1–12
26. Cardoso, J.: Process control-flow complexity metric: An empirical validation. In:
IEEE SCC 06, Proceedings. (2006) 167–173
27. Rosemann, M., Recker, J., Indulska, M., Green, P.: A study of the evolution of the
representational capabilities of process modeling grammars. In Dubois, E., Pohl,
K., eds.: CAiSE 2006, Proceedings. LNCS 4001 (2006) 447–461
28. Agarwal, R., Sinha, A.: Object-oriented modeling with UML: a study of developers’
perceptions. Communications of the ACM 46 (2003) 248–256
29. Sarshar, K., Loos, P.: Comparing the control-flow of epc and petri net from the
end-user perspective. In Aalst, W., Benatallah, B., Casati, F., Curbera, F., eds.:
BPM 2005, Proceedings. LNCS 3649. (2005) 434–439
30. Lange, C., Chaudron, M.: Effects of defects in uml models: an experimental inves-
tigation. In Osterweil, L., Rombach, H., Soffa, M., eds.: ICSE 2006, Proceedings.
(2006) 401–411
31. Mendling, J., Aalst, W.: Towards EPC Semantics based on State and Context. In
M. Nüttgens and F.J. Rump and J. Mendling, ed.: EPK 2006, Proc. (2006) 25–48
32. Mendling, J., Aalst, W.: Formalization and Verification of EPCs with OR-Joins
Based on State and Context. In Krogstie, J., Opdahl, A., Sindre, G., eds.: CAiSE
2007, Proceedings. LNCS 4495. (2007) 439–453
33. Hosmer, D., Lemeshow, S.: Applied Logistic Regression. 2nd edn. (2000)
34. Nagelkerke, N.: A note on a general definition of the coefficient of determination.
Biometrika 78 (1991) 691–692You can also read