Mobility, exposure, and epidemiological timelines of COVID-19 infections in China outside Hubei province - Nature
←
→
Page content transcription
If your browser does not render page correctly, please read the page content below
www.nature.com/scientificdata

               OPEN           Mobility, exposure, and
Data Descriptor               epidemiological timelines of
                              COVID-19 infections in China
                              outside Hubei province
                              Xiao Fan Liu      1
                                                    , Xiao-Ke Xu2 ✉ & Ye Wu3,4 ✉

                              The 2019 coronavirus disease (COVID-19) is pseudonymously linked to more than 100 million cases in
                              the world as of January 2021. High-quality data are needed but lacking in the understanding of and
                              fighting against COVID-19. We provide a complete and updating hand-coded line-list dataset containing
                              detailed information of the cases in China and outside the epicenter in Hubei province. The data are
                              extracted from public disclosures by local health authorities, starting from January 19. This dataset
                              contains a very rich set of features for the characterization of COVID-19’s epidemiological properties,
                              including individual cases’ demographic information, travel history, potential virus exposure scenario,
                              contacts with known infections, and timelines of symptom onset, quarantine, infection confirmation,
                              and hospitalization. These cases can be considered the baseline COVID-19 transmissibility under
                              extreme mitigation measures, and therefore, a reference for comparative scientific investigation and
                              public policymaking.

                              Background & Summary
                              In the global fight against the COVID-19 pandemic, high-quality data are needed for clinical understanding,
                              mathematical modeling, and policymaking considerations. However, official statistics reported in most coun-
                              tries are presented as aggregated data, e.g., newly confirmed cases by day and without critical details of individ-
                              ual cases, thus hindering their scientific values1. On the contrary, starting January 18, 2020, the Chinese health
                              authorities, e.g., local health commissions, began to report detailed epidemiological information of confirmed
                              COVID-19 infections publicly. We monitored the disclosure channels of 27 provincial and 264 urban health
                              authorities, collected all the public reports, extracted any information about individual cases, and curated the
                              dataset in the presentation, with the help of 15 research assistants.
                                  Our data are updated regularly. As of November 20, 2020, 12667 cases are identified with detailed epide-
                              miological information, accounting for 71.1% of a total of 17814 infections in China outside Hubei Province.
                              The information contained in the dataset includes the case’s demographic information, e.g., gender, age, and
                              occupation; travel history, e.g., trace and timeline of mobility; exposure to known infections, e.g., when, where,
                              how, and to whom exposed; timelines of case admission, e.g., dates of quarantine, symptom onset, hospital
                              admission, and infection confirmation; and other information, such as clinical symptoms, mentioned in the
                              public disclosure.
                                  The cases reported outside the epicenter provide unique and crucial value for the study of disease spreading.
                              The COVID-19 epidemic in China outburst in Wuhan and spread outside of the city to Hubei Province and other
                              parts of the country with the help of large-scale human mobility during the traditional New Year holiday. The
                              Chinese government swiftly enforced a series of nationwide travel bans, which restricted mobility between cities,
                              starting with Wuhan on January 23, then Hubei Province and the entire country a few days later2. Despite these
                              extreme mitigation strategies, the disease still managed to spread in more than 260 cities in China3. The highly

                              1
                                Web Mining Laboratory, Department of Media and Communication, City University of Hong Kong, Hong Kong
                              Special Administrative Region, China. 2College of Information and Communication Engineering, Dalian Minzu
                              University, Dalian, 116600, China. 3Computational Communication Research Center, Beijing Normal University,
                              Zhuhai, 519087, China. 4School of Journalism and Communication, Beijing Normal University, Beijing, 100875,
                              China. ✉e-mail: xuxiaoke@foxmail.com; wuye@bnu.edu.cn

  Scientific Data |   (2021) 8:54 | https://doi.org/10.1038/s41597-021-00844-8                                                                 1
www.nature.com/scientificdata/                                                                      www.nature.com/scientificdata

                            coordinated nationwide travel bans can be regarded as a rare emergence measure, under which disease can only
                            spread locally. Therefore, the virus transmission paths and individual cases’ epidemiological timelines that can be
                            further constructed from the curated data are a baseline for the further comparative study of COVID-19 spread-
                            ing in different countries, populations, and under different mitigation policies.

                            Methods
                            Data sources.       Most of the provincial and urban level health authorities in China began to report detailed
                            information regarding COVID-19 cases admitted in their jurisdiction, starting from mid-January. The reports
                            were published via official websites and social media platforms. We collect the reports from 27 provincial and
                            264 urban health authorities in China outside Hubei province, starting January 19, 2020. The list of disclosure
                            channels of local health authorities is available in our dataset4.

                            Information extracted. A typical example of a case report reads as follows.
                                   Patient Yue, female, 42, resident in Building C, XX housing estate, Tianjia’an District, Huainan City,
                                Anhui Province. She arrived in Huainan from Hefei on January 20. She had close contacts with confirmed
                                cases Fu and Yue in Fengtai County from 23–30 January. Showed fever symptom on February 1, admitted
                                to Chaoyang Hospital on February 4, tentatively diagnosed with COVID-19 on February 5, confirmed on
                                February 6. The patient is currently quarantined and treated in the destined hospital with mild clinical
                                symptoms.

                               Five categories of detailed information can be extracted from the above disclosure, i.e., demographic infor-
                            mation, past mobility trace, exposure to the virus or potential contact with known infection(s), the timeline of
                            symptom onset, hospitalization, infection confirmation, etc., and clinical symptoms.
                               Specifically, demographic information includes age, gender, occupation, and place of regular residency. The
                            regular residence place may or may not be the patient’s hometown but can be their place of work or school. For
                            example, the demographic information extracted from the sample case is female, 42 years of age, a missing occu-
                            pation, and a regular resident in Tianjia’an District.
                               The end of January 2020 was the time of Chinese New Year, during which many people who work away from
                            their hometowns would return home for family gatherings. Therefore, mobility traces are abundant in reported
                            cases. A trace includes any known travel history of the patient, including the departure place, transit place, and
                            destination, usually where the patient was admitted to a hospital. The date when the patient arrived at the destina-
                            tion is also logged. The sample case’s mobility trace includes the departure place Hefei City, destination Huainan
                            City, and the arrival date January 20.
                               The local health authorities reported the potential exposure to the virus and contacts to known infections
                            with emphasis. The disclosure of such information intends to warn the public for potential exposure to the infec-
                            tion, high-risk venues, or activities. Cases are very often reported to have multiple risky activities. Therefore,
                            these activities form a time window of virus exposure. We also log the place, activity, and any person involved in
                            each activity. The demographic and mobility information of any contact is searched in other reports. If there is
                            a unique match, their case IDs and relationship are extracted and coded. In the sample case, the patient had an
                            exposure window from January 23 to January 30, and the two known contacts were found in other records, with
                            familial relationship to the patient, e.g., mother and son.
                               The quarantine (self or mandatory) dates, symptom onset dates, hospitalization dates, and confirmation dates
                            are extracted. Epidemiological timelines vary between different ways that the cases were discovered. We group
                            the discovery methods into three types.

                              1. If a case went for medical help by themselves, we classify it as a self-discovery. The epidemiological timeline
                                 of a self-discovery usually has four stages: self-quarantine (optional) – symptom onset – hospitalization –
                                 case confirmation – public disclosure. Note that the date of hospitalization is the date when the case went
                                 for medical help for the first time.
                              2. If the case was discovered during large scale screenings, we consider it as a passive discovery. The epide-
                                 miological timeline of a passive discovery is usually: case confirmation – public disclosure. The dates of
                                 symptom onset are sometimes retrospected.
                              3. If the case was discovered during a mandatory quarantine, we record it as a quarantine discovery. The
                                 epidemiological timeline of a quarantine discovery can be mandatory quarantine – symptom onset (op-
                                 tional) – case confirmation – public disclosure. When the symptom onset field is missing or later than case
                                 confirmation, the case is usually an asymptotic infection.

                               For example, the sample case is a self-discovery case, with no quarantine date, the symptom onset date
                            February 1, the hospitalization date February 4, and the case confirmation date February 6.
                               The local health authorities reported the clinical symptoms of the cases in some cases. About 90 differ-
                            ent symptoms or a level of severity were mentioned. We classify them into 16 categories. The sample case was
                            reported with only a mild level of severity with no particular symptom.

                            Coding procedure.          Fifteen research assistants helped with the following five-step information extracting
                            procedure.

                              1. Workload division. The dataset is equally divided into seven proportions. Each proportion is assigned to a
                                 group with two research assistants.

Scientific Data |   (2021) 8:54 | https://doi.org/10.1038/s41597-021-00844-8                                                                   2
www.nature.com/scientificdata/ www.nature.com/scientificdata
Category Data field Data format
ID Province_City-SerialNumber
Age Number
Demographic information Gender Male/Female
Occupation Text
Place_Residency Text (Province_City)
Place_Departure Text (Province_City/“local”)
Place_Transit Text (Province_City)
Mobility trace
Place_Destination Text (Province_City)
Arrival_Date Date
Earliest_Possible_Date Date
Latest_Possible_Date Date
Place_and_Event Text
Exposure to virus
Venue Text
With_Whom Text
Contact_ID_Relationship Text (ID(relationship)&...)
Place_Admission Text (Province_City)
Method_Discovery “Self ”/“Passive”/“Quarantine”
Date_Quarantine Date
Place_Quarantine “Quarantine camp”/“Home”/“Hospital”
Epidemiological timelines Date_Symptom_Onset Date
Date_Hospitalisation Date
Place_Hospitalisation Text
Date_Confirmation Date
Date_Disclose Date
Symptom Text
Clinical symptoms
Symptom_Severity “Stable”/“Mild”/“Severe”
Original_Text_CN Text
Other information
Original_Text_EN Text
Table 1. Data fields and their content formats.
2. Preliminary coding. Each group first codes 30 random records in their assignments. The two members in
the group discuss and reach a consensus on any dispute in their coding.
3. Coding. For each group, the two members independently code the data. Their codings are regularly re-
viewed by bulks of 200–300 records (the workload of one or two days).
4. Consistency check. Upon any dispute in the bulk encodings, a coder from another group is asked to solve
the inconsistency. The solutions are fed back to the initial coders to solve the inconsistency.
5. Coding unification. Finally, the phrasing and formats of all data fields are reviewed. Any coding mistakes
are corrected, and subtle differences in phrasings are unified.
Data Records
The line-list data are available at the figshare repository4. They are also simultaneously updated in our GitHub
repository5. The data consist of 28 fields in 6 groups. Data fields and their content formats are shown in Table 1.
The field names are self-explanatory. When a data field is not reported, an “NA” is filled. Dates are coded in format
mm/dd/yyyy. The possible values of some data fields are elaborated as follows.
• Occupation. There are 154 different occupations mentioned in the original reports. The original phrases in the
public disclosures are retained.
• Place_Departure. If a case has no travel history, this field is labeled “local.”
• Arrival_Date. Arrival date is the last known travel date of the case. Local health commissions trace the travel
history of cases with their own standards. Some arrival dates can be earlier than one month before the public
disclosure date.
• Place_and_Event. Reported activities that could potentially expose the patient in a high-risk environment.
Data contents include the place and/or event of the activities. The most probable event is selected when mul-
tiple events are present.
• Venue. The coded venue for potential exposure activities. If the public disclosure from local health authorities
mentioned the place of potential exposure explicitly, they are categorized into “Social place,” “Family,” “Work-
place,” “Public transportation,” “School,” and “Hospital.” Otherwise, if “Indoor,” “Outdoor,” and “Public place”
were mentioned, we record the venues as is.
• With_Whom. Possible values include “Classmates”, “Colleagues”, “Confirmed cases”, “Suspected cases”, “Fam-
ily members”, “Fellow passengers”, “Friends”, “Returnee from XX” “Returnee from other place”, “XX person-
nel”, and “non-local personnel”, where XX is the name of a place.
Scientific Data | (2021) 8:54 | https://doi.org/10.1038/s41597-021-00844-8 3www.nature.com/scientificdata/ www.nature.com/scientificdata
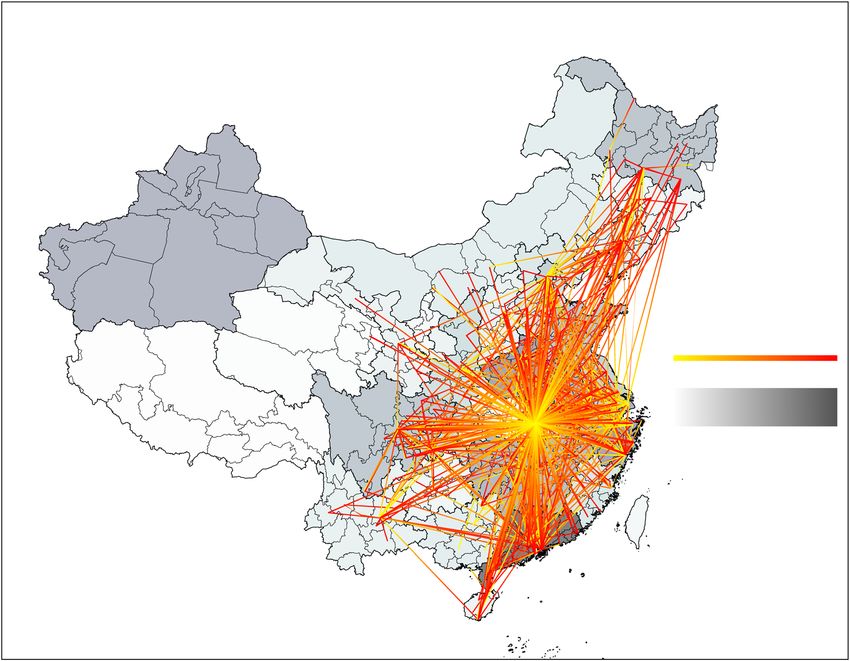
Fig. 1 Statistical validation of several data fields. (a) The age and gender distributions of the cases. (b) The
cumulative numbers of symptom onset, hospitalisation, infection confirmation, and public disclosure between
January 10 and November 20.
• Contact_ID_Relationship. Types of relationships include “Husband”, “Wife”, “Son”, “Daughter”, “Mother”,
“Father”, “Sister”, “Brother”, “Uncle”, “Aunt”, “Nephew”, “Niece”, “Grandmother”, “Grandfather”, “Grandson”,
“Granddaughter”, “Son-in-law”, “Father-in-law”, “Mother-in-Law”, “Daughter-in-Law”, “Relative”, “Girlfriend”,
“Boyfriend”, “Neighbour”, “Colleague”, “Other contact”.
• Method_Discovery. Depending on the orders of epidemiological events in the individual cases’ timeline, cases
are grouped into self-discovery, passive discovery, and quarantine discovery. For self-discovery cases, their
symptom onset date, hospitalization date, and confirmation date are chronological; for passive discovery
cases, their dates of confirmation are prior or the same to hospitalization date and quarantine date; for quar-
antine discovery cases, their quarantine date should be prior or the same to confirmation date.
• Symptom. The phrasings of symptoms are rather diverse in the original reports, with a total of about 90 differ-
ent phrases. We further classify these phrases into 16 categories, including asymptomatic and the symptom,
sign, and diagnoses related to the somatosensory, respiratory, digestive, nerve, and circulatory systems. Even-
tually, only 10 categories appear in the data. Note that for cases reported asymptomatic, they may or may not
show symptoms eventually.
• Original_Text_EN. The English version of the original case disclosures is translated using Google translate
services.
Technical Validation
Completeness of cases with detailed information. The Chinese health authorities report daily
increases and accumulated numbers of COVID-19 infections. Best efforts were made to ensure that the number
of cases collected each day can add to the reported cases. As of November 20, 2020, 12667 cases are recorded in
our dataset, accounting for 71.1% of the 17814 total infections. The reasons for missing cases in each province/
prefecture are summarized and reported in the dataset4.
Statistical inspection of data fields. Here we plot the statistics of several essential data fields for visual
inspection of data correctness. Figure 1(a) shows the age and gender distributions of the 12667 reported cases.
The cases are concentrated in the mid-aged population, and that male infections are more than female infections.
Figure 1(b) shows the numbers of symptom onset, hospitalization, infection confirmation, and public disclosure
each day. Noticeable delays can be observed between symptom onset, hospitalization, and infection confirmation.
The number of publicly reported cases surpassed that of confirmed cases at the end of January. Most of the cases
reported but with no infection confirmation date were hospitalized with a suspected infection. Figure 2 shows
the mobility traces of reported cases. Their departure, transit, and destination cities are linked with gradient color
lines. Provinces are colored according to the numbers of cases collected in our dataset.
Inter-coder reliability measures. Table 2 summarizes the number of possible values C, the percentage
agreement between the two independent coders, Cohen’s kappa (κ)6, and the percentage of missing values for
each of the data fields. The inconsistencies inside groups are solved before the dataset is published in the repos-
itory. Note that only the percentage of agreement is reported for the data fields with over 1,000 possible values.
Scientific Data | (2021) 8:54 | https://doi.org/10.1038/s41597-021-00844-8 4www.nature.com/scientificdata/ www.nature.com/scientificdata
Fig. 2 Mobility traces reported as of Nov 20, 2020. Lines with gradient color indicate the cases’ movements
before arriving at the destination cities. Provinces in China are colored by their numbers of collected case
reports. Note: only provinces and municipalities with reported cases are shown on the map; Hubei Province is
not colored.
Usage Notes
Data integration. Two previously published datasets7,8 can be potentially integrated with our dataset. The
dataset published along Zhang et al.7 recorded COVID-19 cases in China outside Hubei, starting from December
24, 2019, to February 9, 2020. Compared to this dataset, our dataset contains more detailed demographic infor-
mation (with occupation and place of residence), travel history (departure, transit, destination cities, and arrival
dates rather than yes/no), virus exposure (detailed scenarios and explicit contact persons rather than yes/no), and
epidemiological timelines (with additional quarantine places and time, dates of case confirmation, and methods
of case discovery). Our dataset also spans a longer time. The data fields in Xu et al.8 also intersect with our data
fields, containing cases not only from China but also from the other parts of the world. However, since their data
were sourced from health authorities’ brief reports, e.g., with only daily numbers and simple statistics such as
gender, useful individual cases’ epidemiological information is sparse. For example, the missing rate of the date of
symptom onset is 95.6% in their data compared to 46.4% in our dataset, as of November 20, 2020.
Data update plan. The datasets will be updated on a bi-weekly basis. We plan to maintain and update the
dataset whenever there is new confirmed local COVID-19 cases in China, until the pandemic ends. Meanwhile,
we encourage the community to collaborate with us in this endeavor, by submitting data correction issues on the
GitHub repository or join us in the coding group.
Possible downstream tasks. The rich and complete individual case information in our dataset enables
many possible downstream tasks that can be performed using our dataset. Apart from basic disease statistical
properties such as the gender and age distributions of infections, the symptoms and the severity thereof, we iden-
tify three potentially valuable directions which require extra efforts in further manipulating the dataset, e.g., the
reconstructions of epidemiological timelines, human-to-human transmission events and the spatial-temporal
spreading trajectories of COVID-19.
Reconstruction of transmission events. The reconstruction of a transmission event requires the identification
of an infector and an infectee. We have prepared close contact events between known infections as well as their
relationships. However, the order of the case infections is not explicit and could only be inferred from their
travel history and potential virus exposure scenarios. A possible way to identify an infector is that this case must
have previous travel history or close contacts to any infections, e.g., our previous effort9. There are scenarios in
Scientific Data | (2021) 8:54 | https://doi.org/10.1038/s41597-021-00844-8 5www.nature.com/scientificdata/ www.nature.com/scientificdata
Percentage Percentage
Category Data field C agreement Cohen’s kappa (κ) missing
Age 97 98.1 0.98 13.0
Gender 2 99.0 0.98 9.3
Demographic information
Occupation 181 96.3 0.85 86.2
Place_Residency 565 87.1 0.85 32.3
Place_Departure 428 89.4 0.87 45.2
Place_Transit 365 92.1 0.78 85.2
Mobility trace
Place_Destination 333 89.2 0.82 45.5
Arrival_Date 309 92.7 0.87 50.4
Earliest_Possible_Date 115 94.8 0.83 89.0
Latest_Possible_Date 175 96.1 0.95 49.8
Place_and_Event 19 74.3 0.63 59.6
Exposure to virus
Venue 9 89.9 0.74 77.2
With_Whom 9 90.0 0.80 68.3
Contact_ID_Relationship >1000 94.4 — 76.2
Place_Admission 420 78.6 0.85 0.0
Method_Discovery 3 91.6 0.90 30.5
Date_Quarantine 287 92.9 0.83 64.5
Place_Quarantine 3 93.8 0.90 56.5
Epidemiological timelines Date_Symptom_Onset 175 97.5 0.97 46.4
Date_Hospitalisation 195 96.8 0.95 39.9
Place_Hospitalisation >1000 95.6 — 44.9
Date_Confirmation 287 94.3 0.94 22.6
Date_Disclose 304 95.1 0.95 1.0
Symptom 16 96.8 — 62.5
Clinical symptoms
Symptom Severity 3 94.4 0.90 67.3
Table 2. Inter-coder reliability measures as of Nov 20, 2020.
which multiple cases have close contacts during the same period. The identification of transmission chains in a
multiple-contact scenario is a long-recognized problem in epidemiology studies. We refer the readers to some of
the previous studies, e.g., using statistical inference to determine the transmission chain10, or just using the first
symptomatic infection as the infector for the whole cluster, e.g.11,12. The successful identification of transmission
events would help the study of disease transmission risks in different scenarios and among people with different
demographic features.
Reconstruction of epidemiological timelines. Epidemiological timelines, e.g., the delays between symptom onset,
seeking health care and case reporting13, incubation period14, duration of virus shedding15, and serial interval16
are critical to understanding the temporal dynamics of COVID-19. Our data provide detailed records of the dates
of possible exposure, symptom onset, quarantine, hospitalization, and confirmation of COVID-19 infections,
which are the essential elements in the reconstruction of the epidemiological timelines. A small proportion of this
dataset has been useful in discovering serial intervals of COVID-1916 and mitigation policies17. Another possible
task is identifying asymptotic infections, who would have their dates of disease confirmation before symptoms
onset or even without symptom onset. In this release of the dataset, we have also roughly classified the means of
case discovery to self-discovery, passive discovery, and quarantine discovery, which can further help the recon-
struction tasks.
Spatial-temporal spreading trajectories. Our dataset contains detailed travel history, including the places of
departure, transit, and destination, as well as the arrival date. This information can be used to map the trajectories
of COVID-19 spreading on the map. Using these trajectories with the whole Chinese population’s mobilization
pattern during the 2020 Chinese New Year period3, one can further study the intensity of virus spreading between
cities and precisely infer the proportion of the infected population in each geographical area, e.g., our previous
effort18.
Emergency monitoring with artificial intelligence. The authors would also like to take the opportunity
and discuss the use of artificial intelligence in emergency response. Public disclosure from governments is becom-
ing common and transparent in the world. Being able to extract information from the public announcements
and integrate information from multiple sources is crucial to coordinated emergency response. The extraction of
information from open texts, such as dates, places, names, and symptoms are typical named entity recognition
task in natural language processing in artificial intelligence. In the effort of preparing this dataset, we have tried
several established methods to identify desired targets from the text automatically. However, the precision is
Scientific Data | (2021) 8:54 | https://doi.org/10.1038/s41597-021-00844-8 6www.nature.com/scientificdata/ www.nature.com/scientificdata
very low, partly due to the considerably different standards of reporting, phrasing, and degrees of disclosure, and
therefore, we stick to manual coding for this dataset. On the one hand, we recognize that there is still a long way to
go to apply artificial intelligence methods in not-well-defined tasks such as the present one. On the other hand, we
hope that the original reports and the extracted information can be used as a training dataset and advance future
natural language processing algorithms.
Code availability
No computer code was used in the data curation process.
Received: 27 August 2020; Accepted: 28 January 2021;
Published: xx xx xxxx
References
1. Vespignani, A. et al. Modelling covid-19. Nat. Rev. Phys. 2, 279–281 (2020).
2. Tian, H. et al. An investigation of transmission control measures during the first 50 days of the covid-19 epidemic in china. Sci. 368,
638–642 (2020).
3. Chinazzi, M. et al. The effect of travel restrictions on the spread of the 2019 novel coronavirus (covid-19) outbreak. Sci. 368, 395–400
(2020).
4. Liu, X. F., Xu, X. K. &Wu, Y. COVID-19 Case Reports in China. figshare https://doi.org/10.6084/m9.figshare.12656165 (2020).
5. Liu, X. F., Xu, X. K. & Wu, Y. COVID-19 Case Reports in China. GitHub, https://github.com/abcdefg3381/COVID-19_China_case_
reports (2020).
6. Cohen, J. A coefficient of agreement for nominal scales. Educ. psychological measurement 20, 37–46 (1960).
7. Zhang, J. et al. Evolving epidemiology and transmission dynamics of coronavirus disease 2019 outside hubei province, china: a
descriptive and modelling study. The Lancet Infect. Dis. 20, 793–802 (2020).
8. Xu, B. et al. Epidemiological data from the covid-19 outbreak, real-time case information. Sci. Data 7, 106 (2020).
9. Xu, X.-K. et al. Reconstruction of transmission pairs for novel coronavirus disease 2019 (covid-19) in mainland china: Estimation
of super-spreading events, serial interval, and hazard of infection. Clin. Infect. Dis. ciaa790 (2020).
10. Cauchemez, S. et al. Household transmission of 2009 pandemic influenza a (h1n1) virus in the united states. New Engl. J. Medicine
361, 2619–2627 (2009).
11. Reichler, M. R. et al. Household transmission of ebola virus: Risks and preventive factors, freetown, sierra leone, 2015. J. Infect. Dis.
218, 757–767 (2018).
12. Liu, Y., Eggo, R. M. & Kucharski, A. J. Secondary attack rate and superspreading events for sars-cov-2. The Lancet 395, e47 (2020).
13. Sun, K., Chen, J. & Viboud, C. Early epidemiological analysis of the coronavirus disease 2019 outbreak based on crowdsourced data:
a population-level observational study. The Lancet Digit. Heal. 2, e201–e208 (2020).
14. Lauer, S. A. et al. The incubation period of coronavirus disease 2019 (covid-19) from publicly reported confirmed cases: Estimation
and application. Annals Intern. Medicine 172, 577–582 (2020).
15. He, X. et al. Temporal dynamics in viral shedding and transmissibility of covid-19. Nat. Medicine 26, 672–675 (2020).
16. Du, Z. et al. Serial interval of covid-19 among publicly reported confirmed cases. Emerg. Infect. Dis. 26, 1341 (2020).
17. Du, Z. et al. Effects of proactive social distancing on covid-19 outbreaks in 58 cities, china. Emerg. Infect. Dis. 26 (2020).
18. Du, Z. et al. Risk for transportation of coronavirus disease from wuhan to other cities in china. Emerg. Infect. Dis. 26, 1049 (2020).
Acknowledgements
The authors thank Prof. Jonathan Jian-hua Zhu, Dr. Lin Wang, Dr. Zhanwei Du, and Dr. Yang Wang, for their
helpful discussion. This work was partially supported by the National Natural Science Foundation of China
(61773091, 11875005, 61976025, 11975025) and Major Project of The National Social Science Fund of China
(19ZDA324).
Author contributions
All authors contributed to the collection and curation of the data and the writing and editing of the manuscript.
Competing interests
The authors declare no competing interests.
Additional information
Correspondence and requests for materials should be addressed to X.-K.X. or Y.W.
Reprints and permissions information is available at www.nature.com/reprints.
Publisher’s note Springer Nature remains neutral with regard to jurisdictional claims in published maps and
institutional affiliations.
Open Access This article is licensed under a Creative Commons Attribution 4.0 International
License, which permits use, sharing, adaptation, distribution and reproduction in any medium or
format, as long as you give appropriate credit to the original author(s) and the source, provide a link to the Cre-
ative Commons license, and indicate if changes were made. The images or other third party material in this
article are included in the article’s Creative Commons license, unless indicated otherwise in a credit line to the
material. If material is not included in the article’s Creative Commons license and your intended use is not per-
mitted by statutory regulation or exceeds the permitted use, you will need to obtain permission directly from the
copyright holder. To view a copy of this license, visit http://creativecommons.org/licenses/by/4.0/.
The Creative Commons Public Domain Dedication waiver http://creativecommons.org/publicdomain/zero/1.0/
applies to the metadata files associated with this article.
© The Author(s) 2021
Scientific Data | (2021) 8:54 | https://doi.org/10.1038/s41597-021-00844-8 7You can also read