To put pedestrian first in the heart of Buenos Aires. Pedestrian Priority in the Central Area.
←
→
Page content transcription
If your browser does not render page correctly, please read the page content below
To put pedestrian first in the heart of Buenos Aires.
         Pedestrian Priority in the Central Area.

Héctor Lostri, Undersecretary of Urban Planning; Fernando Alvarez de Celis, General Director of
Urban planning; Susana Eguía, Consultant architect; María Emilia Persico, Consultant architect.
 Subsecretaría de Buenos Aires-Ministerio de Desarrollo Urbano- Gobierno de la Ciudad de
Buenos Aires (Subsecretariat of Urban Planning of the Ministry of Urban Development, Buenos
   Aires Government). 291 Carlos Pellegrini Street-Buenos Aires City-Argentina. Zip Code:
C1009ABE. Telephone: 541143238168. E-mail address: ssplaneamiento@buenosaires.gob.ar

Abstract
The City of Buenos Aires as a centre of governmental, economics, cultural activities, daily
receives about three million people, doubling its population. A half the amount is concentrated in
the central area, where the 23% of working places is located.
The dominance of motorized transportation, excess traffic and bottlenecks affect the quality of
public spaces, making critical the infrastructure capacity for mobility, causing extremely slow
intra-urban displacements. Short journeys are also affected by the lack of safe routes for cycling
and reduced opportunities for adequate and comfortable walking.
The use of public space as a place of free parking for cars, hindering the transfer of passengers
to public transport and the ability to walk, stress the dominance of vehicular traffic at the
expense of pedestrian space. The central area shows an increasing deterioration and
congestion of the sidewalk, with high risk of accidents and exposure to air and noise pollution,
with no possibility for the amenity and diversity of urban life.
Pedestrian Priority Programme in the Central Area: Reconquista and Suipacha streets.
Responding to the Urban Environment Plan guidelines, the Pedestrian Priority Programme aims
to put pedestrians first, focusing heavily on generating bold changes to public spaces to
strengthen the diversity of activities, and promote social and functional recovery. The most
significant interventions, undertaken by the Ministry of Urban Development, were carried out in
Reconquista and Suipacha streets. The initiatives will also join other streets in the neighborhood
and secondary centralities.
Carabelas, Reconquista and Suipacha become streets of coexistence, involving the architectural
appropriateness of urban space, where pedestrians are preferential users. Bicycles circulation is
allowed in lanes for that purpose, restricting car traffic flow to the minimum necessary.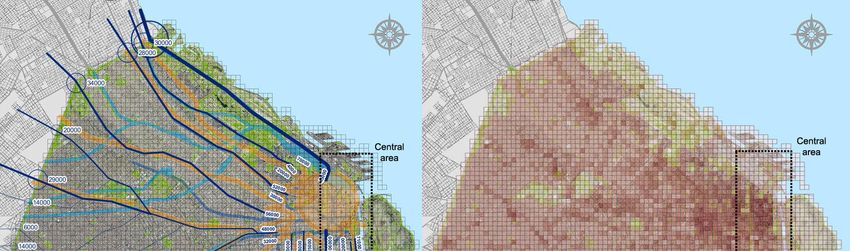
Biography of the authors
Hector Lostri
Undersecretary of Urban Planning of the Ministry of Urban Development of Buenos Aires
Government. Architect at the University of Buenos Aires. Postgraduate in Urban Economics at
School of Economics, University Torcuato Di Tella. Postgraduate in land markets as Theory and
Tools for Policy Management at University of General Sarmiento in agreement with Lincoln
Institute of Land Policies. Specialization in Land Markets at the University Torcuato Di Tella.
Specialization in Production and Technology, oriented to Business Organization and Technical
Management at Faculty of Architecture, Design and Urbanism, University of Buenos Aires.
Fernando Alvarez de Celis
General Director of Urban Planning and coordinator of the Intelligence Systems Unity (USIT),
Subsecretariat of Urban Planning of the Ministry of Urban Development of Buenos Aires
Government. Geographer of the University of Buenos Aires. Master in Urban Economics,
University Torcuato Di Tella. Since 2003 he has coordinated regional studies and surveys in
different areas of Buenos Aires Government. Professor at various academic centers.
Susana Eguia
Consultant architect. Subsecretariat of Urban Planning of the Ministry of Urban Development of
Buenos Aires Government. Graduated at the University of Buenos Aires. Specialization in
Bioclimatic Design. Master in Sustainable Buildings and Energy Efficiency. Professor and
researcher. Faculty of Architecture, Design and Urbanism, University of Buenos Aires.
María Emilia Persico
Consultant architect. Subsecretariat of Urban Planning of the Ministry of Urban Development of
Buenos Aires Government. Graduated at the University of Buenos Aires. Specialization in Urban
Planning. Master in Urban Planning. Professor at Faculty of Architecture, Design and Urbanism,
University of Buenos Aires.
To put pedestrian first in the heart of Buenos Aires.
         Pedestrian Priority in the Central Area.
Héctor Lostri, Undersecretary of Urban Planning; Fernando Alvarez de Celis, General Director of
Urban planning; Susana Eguía, Consultant architect; María Emilia Persico, Consultant architect.
 Subsecretaría de Buenos Aires, Ministerio de Desarrollo Urbano, Gobierno de la Ciudad de
Buenos Aires (Subsecretariat of Urban Planning of the Ministry of Urban Development, Buenos
   Aires Government). 291 Carlos Pellegrini Street-Buenos Aires City-Argentina. Zip Code:
C1009ABE. Telephone: 541143238168. E-mail address: ssplaneamiento@buenosaires.gob.ar

Urban mobility in Buenos Aires City
Urban mobility, like any complex issue of the city, requires an integrated vision that deepens the
relations established between mobility and city. The transformation of the patterns of mobility
means the transformation of the territory and the reformulation of the economic, social and
physical dynamics. When we think about urban mobility we think about the whole city. Given
this, we have to reflect on what is the scope of the mobility concept, its limitations, its relation
with de environment and the objectives that we have to face from urban planning.
The mobility concept refers to the capacity and need of a person to move in the territory to fulfill
its own needs or those who arise from the interaction with the social group in which he or she
lives and works. The development of the motorized transport has allowed the economic
development of the cities and the actions of planning has tended to facilitate its predominance in
the urban environment. The result is an exponential increase of its use, and therefore of its
negative effects: injuries from road traffic accidents, noise annoyances and disturbances,
respiratory problems due to air pollution, stress, fatigue, social exclusion, etc Furthermore,
motorized transport is a major contributor to climate change as it emits green house gases. At
present the motorized vehicle solves our mobility problems, but also involves a lot of
environmental and urban problems that have to be solved too.
Consequently, in the last decades the concept of mobility has changed. In the new paradigm of
mobility, each mode of transport must be thought considering the impact that it produces in its
immediate urban environment. The transportation of people and goods isn’t the only objective of
urban transport plans any more. The new concept of mobility considers ways of transport that
use less energy, do not spoil the public space and increase the participation of pedestrian and
cyclist. Gehl (2010, pp. 6) states that:
   Cities must urge urban planners and architects to reinforce pedestrianism as an
   integrated city policy to develop lively, safe, sustainable and healthy cities. It’s equally
   urgent to strengthen the social function of city space as a meeting place that contributes
   toward the aims of social sustainability and an open and democratic society.
In this way, pedestrian and cycling improvements are a priority for the urban planning area of
Buenos Aires government. We conceptualize sustainable mobility like the set of human
movements in the territory that make possible the development of economic activities and the
satisfaction of the cultural, social, environmental and biological requirements without
compromising the immediate and global environment. Sustainable mobility is a concept that
provides quality of life for all people.
Sustainable mobility
With the objective of reducing the impact of high urbanization and motorized transport, the
Ministry of Urban Development of Buenos Aires City has created the Sustainable Mobility Plan.
The Sustainable Mobility Plan comprises several programs that have been developed
considering the best world experiences and the contribution of important experts. The plan is
based on the following guidelines: public transport priority, healthy mobility, road safety, and
arranging of the transit.
The following are the programs included in the Sustainable Mobility Plan:
Priority of the public transport Program: This program contributes to improve the public transport
system in order to reduce the use of particular vehicles. It consists of the following initiatives:
Exclusive bus Lane: The principal target is to move the buses towards the avenues and the
particular cars to the side streets, prioritizing the public transport and arranging the transit. The
exclusive lanes were created in the avenues where only buses can circulate.
Metrobus: A BRT (bus rapid system) was integrated to one of the widest and most important
avenues: Juan B. Justo Ave. The BRT combines the quality of rail transit with the flexibility of a
bus transit. It provides a faster and more efficient public service.
Healthy Mobility Program: The projects of this program encourage non contaminant modes of
transport and help to improve human health. It consists of the following initiatives:
Ecological bus: The current buses will be replaced with a new hybrid buses which were
developed by the city government. This initiative will reduce air pollution and noise annoyances.
Buenos Aires better by bicycle: A comprehensive project for integrating bicycling infrastructure
into the city’s street network, including on and off road facilities and ancillary facilities such as
bicycle parking, signing and other amenities.
Pedestrian Priority: In order to improve the quality of public space some street were redesigned
to accommodate all modes including walking and cycling. This program reinforces the social
function of public space as a meeting place.
In the present work we developed in depth the interventions realized in the context of the Priority
Pedestrian Program.
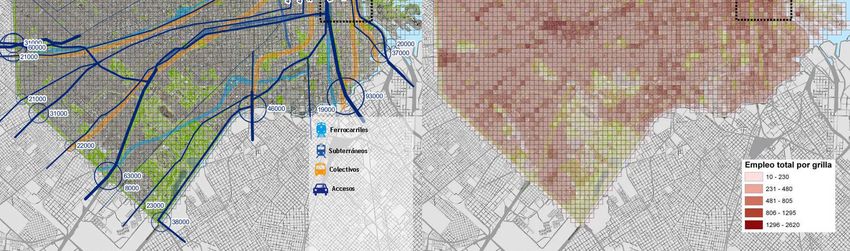
Figure 1 Sustainable Mobility Plan.Pedestrian Priority Program Through this program Ministry of urban Development is improving the conditions of the public space and the pedestrian accessibility. The action taken has transformed the public space becoming it more human and recovering the social function of the public space. This program considers the public space as meeting place where the people can stop and rest. According to these objectives we defined pedestrian streets, called pedestrian priority street, enlarged and leveled sidewalks to help the pedestrian circulation without obstacles, improved the street furniture and lighting and planted new trees. Significant project has been finished like Carabelas, Reconquista and Suipacha Street. Main action may be summarized as follows: Enlarge sidewalk: The pedestrian accessibility and the circulation was made more comfortable because of improving the sidewalk design. Pedestrian priority: In the central area of Buenos Aires the accessibility of motorized transport was limited in order to make easier the pedestrian accessibility. Improve urban environment: The roadways and the sidewalks were leveled and new furniture was designed so as to give new value to city space. The Pedestrian Priority Program is carried out successfully in the whole city of Buenos Aires. Different actions were defined for every area of the city, considering the special features such as functional, patrimonial, social and environmental peculiarities. Due to the complexity that it presents, for this paper there have been selected the interventions realized in the Central Area of Buenos Aires, which is defined by the Rio de la Plata at east side, the 9 de Julio highway at west side, and by the mains centers of modal exchange: Plaza Constitución at south side and Retiro at north side (Figure 2). Objectives of the program Improve environment quality (reduce noise annoyance, air pollution, etc). Increase accessibility and connectivity. Progressive displacement of public transport to the avenues. Enlarge the pedestrian space. Implement a public bike system. Reduce parking area on roadways. Regulation of loading and unloading of goods. Increase and renewal street furniture. Preservation of cultural heritage and identity. Revitalization of commercial and service areas. Buenos Aries Central Area Buenos Aires city is the Argentina’s capital and its strategic geographic location on the Atlantic Ocean turns it into the main connection between Argentina and the rest of de world. It means that Buenos Aires has an important participation in Argentina’s economy and holds many complex functions like government entities, financial companies, commercial activity and private and public utility. Most of these activities are located in the central area of Buenos Aires and its economical and political centrality is reflected in the employment: 23% of the jobs of the city concentrate on this particular area (Figure 3).
Therefore, it means a high population density. In Argentina, we are 40 millions people; 13 million
of them live in the city of Buenos Aires and its metropolitan area. That m eans the 32% of them
live on the 1% of our country surface. Approximately 2.800.000 persons live in Buenos Aires
City. Every day over 3.000.000 people enter in the city from its metropolitan area to get their
works and almost 1.500.000 enters into the central area.
Figure 2 Der. Left Side: Satellite imagery of the Central Area of Buenos Aires. Right side:
Pedestrian Priority Streets.
In this way the urban transport and the public space of the city, especially the central area, is
saturated. In parallel, in the last 10 years the motorized transit has increased very much and
consequently the problems associated to the motorized vehicles density. These have a direct
impact on the quality of life and may be summarized as follows:
The increase of the number of cars, cabs, buses and trucks of transport of goods circulating
along the city has generated a raise of the transport congestion and therefore noise annoyances
and disturbance. The public space is used as available free place for parking, stops and passenger’s transferences. There is an abuse in the way of using the public space because of the absence of traffic control. The health consequences of urban transportation include air pollution, noise, variety of mental and social affects, contribution to global warming and fossil fuel depletion. Furthermore the buses, cabs and cars are designed with old technology that doesn’t contribute to reduce the contamination of the environment The sidewalks aren’t sufficiently wide to allow the pedestrian walk safely and comfortably and therefore there aren’t places where the people can stop and rest. The narrow sidewalk combined with the narrow street and the transport congestion increase risk of accident for pedestrian denying the social function of the public space. Figure 3. Left side: Access to Central Area of Buenos Aires. Right side: Work places location. Compactness According to the urban indicators developed by Urban Ecology Agency of Barcelona, the compactness is the relationship between the built-up volume and the public space surface (Rueda, 2006). This indicator provides valuable information about the need of increase public space in the city and shows the priority areas that must have new public space. An area with high compactness means that this area needs new pedestrian streets and new squares. The Figure 4 shows the compactness in Buenos Aires. The central area is the most compact part of the city and there aren’t enough public space and available sites where to put new public space.
Figure 4. Compactness in the Central Area of Buenos Aires.

Carabelas, Reconquista and Suipacha streets
Considering the traffic congestion, the high compactness, the lack of free space to put new
square and the need of improving pedestrian mobility, the transport network of the central area
will be structured into superblocks. According to Rueda, the director of Urban Ecology Agency of
Barcelona, a superblock is composed of a set of basic roads forming a polygon or inner area
that contains within it several blocks. The inner streets area is considered like complete streets
and the main vehicular traffic goes through the avenues. In order to allow the access to the
workplace or residence the maximum allowable speed is 10 km/hour which is perfect compatible
with walking.
The Figure 5 shows the compactness in the central area, the superblock projected and the
Pedestrian Priority streets. Carabelas, Reconquista and Suipacha streets were the first
Pedestrian Priority streets because they were localized in the most compactness area and
therefore the need of public space was major. Increase the number of Pedestrian Priority streets
is the main objective in order to complete the superblock plan for the Central Area. The Figure 6,
Figure 7 and the Figure 8 show the interventions realized in the streets.
Figure 5 Left Side: High compactness in the Central Area of Buenos Aires. Middle: Projected
       superblocks. Right side: Pedestrian Priority Street according to the compactness.

Figure 6 Left side: Carabelas street before the intervention. Right side: Carabelas street after the
                                           intervention.
Figure 7 Reconquista street before the intervention. Figure 8 Reconquista street after the intervention.
Figure 9 Left side: Suipacha street before the intervention. Right side: Suipacha street after the
intervention.
Environmental sustainability
Urban indicators of environmental sustainability were selected to evaluate in a simple manner
the environmental benefit of the Pedestrian Priority Program. The urban indicators of
environmental sustainability are necessary tools to plan a more sustainable city. The indicators
used with major frequency gather together in three categories:
Public space indicators
Mobility and accessibility indicators
Urban metabolism indicators
The table 1 shows the urban indicators selected to realize the analysis of the public space.
The environmental and urban evaluation of the Pedestrian Priority streets is tackled from the
analysis of the combination of following variables: climate, morphology, materiality, presence of
vegetation and waterbodies that affect the conditions of the microclimate, acoustic comfort, and
the quality of the air. All these variables determine the comfort needed for a pedestrian.
The comparative analysis between the previous situation and the later situation allows
identifying the progress produced in the conditions of air quality, the thermal comfort and the
improving of the surface destined to walk.Public space urban indicators
Reduction of the public space surface destined for the
motorized transportation and adaptation of the roadway to the
pedestrian needs.
Potential of thermal habitability in urban spaces.
Tree endowment.
Mobility and accessibility urban indicators
Accessibility to public transport stops.
Accessibility to Public Bike Systems.
Urban metabolism indicators
Air pollution
Acoustic pollution
Table 1 Urban indicators of environmental sustainability.
Mobility and accessibility urban indicators
Reduction of the public space surface destined to the motorized transportation and
adaptation of the roadway to the pedestrian needs.
The strong presence of the motorized vehicles in the city generates an environmental impact
derived from the massive employment of energies originated from fossil fuels. Therefore the
urban space is affected by air pollution emissions and chemical residues, vibrations and high
sonorous levels that degrade the quality of the air and the acoustic ambience. These have
negative consequences in the human health and spoil the relation of the citizen with the
pedestrian public space.
According to Rueda the urban space used for roadways shouldn’t be more than 25% (Rueda,
2006). The objective of this indicator is reducing the environmental impact and increasing the
number of meeting place by reducing the amount of cars that circulate along the city.
Potential of thermal habitability in urban spaces.
Katzschner (1998) states that the ideal conditions of the urban climate should be the following:
(…)the atmospheric situation with important changes in time and space that provides
not homogeneous thermal conditions for the man in a distance radio up to 150 meters.
It must offer conditions that avoid concentrations of air pollution and thermal stress,
across ventilation and shades at warm stations or wind protection and access to the
sun at cold stations.This definition identifies the following aspects: Habitability in exterior spaces considering the pedestrian scale: The indicator recognizes the impact that the climatic variables have on the pedestrian and surrounding buildings. Relation between the habitability, time and space condition: Given that is not possible to be provided with ideal habitability conditions in all the exterior urban spaces during all the time, we need to integrate new design resources destined to generate area with comfortable habitability conditions. Distance between microclimatic islands of comfort: The definition establishes the creation of urban spaces with favorable microclimate for the pedestrian and the distance between themselves shouldn’t be more than 150 meters. Urban ventilation: The car and building emissions can be concentrated in areas with high density so the air quality is affected. Therefore, its necessary encourage the urban ventilation in order to allow the dispersion of the pollutants. Thermal stress: The evaluation of the potential of thermal habitability in urban spaces needs to determine indexes of comfort that contemplate the impact of temperature, relative humidity, solar radiation and wind. In order to do this, the incidence of building morphology and the materiality of the urban space in the microclimate conditions must be analyzed from the following variables: spatial configuration, materials and vegetation, climate and user profile. Urban Trees The obstruction of the solar radiation in paving constitutes one of the principal factors to decrease radiant temperatures in the public space. The trees and green spaces in the cities decrease significantly the temperature so much for the shade that they generate as for its transpiration and evaporation capacity. In this way, the urban trees benefits and modifies the microclimate because of the modification of the quantity of solar radiation that comes to paving, the influences of the movement of the air, the humidity, the temperature and the run-off caused by the strong rains. The quantity of required trees must be calculated according to the shade projection and the foliage characteristic. It is necessary to achieve as minimum of 50 % of comfort for a typical summer day at midday, when the incidental radiation is maximum. Mobility and accessibility urban indicators Accessibility to public transport stops The objective of this indicator is characterizing the pedestrian spatial accessibility to the public transport. It allow generating information about the potentiality of use and the functionality of the network of urban public transport, being a buses or tube, thought its proximity to the areas where the population concentrates for work or residence. The public transport network is considered accessible when the displacement on foot to the nearest stop does not take more than five minutes, what is equivalent to a 300 meters distance (Rueda, 2006). Accessibility to Public Bike Systems This indicator allows evaluating the real utility of the network of existing bicycles and determining the sectors which doesn’t have accessibility to bike network. The Public Bike Systems is considered to be accessible when the displacement to the nearest bike lane does not take more than 5 minutes on foot and 1 minute by bike (Rueda, 2006).
Urban metabolism indicators
Air pollution
The quality of the air of Buenos Aires is affected principally for its urban traffic that constitutes a
huge source of pollutants. The air pollution is mitigated only by the favorable geographical
location and the winds that come from the river. The carbon monoxide that registers in the
central area during the working day, which almost invariable average level ranges about 9ppm,
put the pedestrian and the storekeeper’s health at risk.
Acoustic pollution
The principal acoustic pollution source in the central area is the urban traffic. The urban noise
annoyances produce negative effects in the human health like alterations in the pulsations,
modification of the respiratory rhythm, muscular tension or blood pressure. Although these
effects disappear when the noise stops, it generates a nervousness disease affecting the
conduct. One of the most well-known irreversible impacts is the loss of audition when the person
is exposed to an intensity of noise superior to 90 db.
The Figure 10 and the Table 2 show the results of the analysis for Reconquista Street. The
Figure 11 and the Table 3 show the results for Suipacha Street.

                250
                         211,68                                                                 R0              R          % Variation

                200                 CO2 Emissions tons per year                                      Surface destined

                                                                                                     for pedestrian %
                150                                  120                                                                 Radiant temperature
                                                           Noise Levels Db                            92,22     90,2        Summer ºC
                                                                             Surface destined
                100
                                                           60                 for roadways %
                                                                                         34                                39,6 30,4
                 5                6,16                                       7,78 9,8

                     0
                                                                                                                    -3
                                                                  -50
                                                                                                                                       -30,26
                -50
                                            -97,00

                -100

  Figure 10 Comparative between the situation before the intervention in Reconquista street (R0)
   and after the intervention (R1) indicating the percentages of change between both situations.
Results
Origin of the Impacted
Impact
impact factor Before After %
Units
(R0) (RS1) Improvement
CO2 Emissions (Ton. / year) 211,68 6,16 97%
Emission and
radiant Air quality Reduction of the
temperature Average temperature T ºC Average
39,6ºC 30.74 -22%
of the air % (change %
of materiality)
Urban Public
transport Acoustic
Noises Noise levels Decibel 60 a 120 Until 60 50%
quality
Useful life and Without
Vibrations Buildings % void 100%
pathologies fact
Percentage pedestrian surface % 7.78% 9.80% +34%
Motorized
Cars street
Transport circulation % 92.22% 90.2% -3%
Load /
unload
Table 2 Environmental and economical improvements identified in Reconquista Street before (R0)
and after (R1) the intervention.
700
568,3
600
CO2 Emissions
tons per year S0 S1 % Variation
500
400
300
Noise Levels Db Surface destined Radiant
Surface destined temperature
for roadways %
200 120 Summer ºC
for pedestrian %
6 90,2 87,51
100 30 9, 21,54 58 4
12,49 -24
-3,04
0
-50
-100 -97
Figure 11 Comparative between the situation before the intervention in Suipacha street (S0) and
after the intervention (S1) indicating the percentages of change between both situations.Results
Origin of Impacted
Impact
the impact factor %
Units Before (S0) After (S1)
Improvement
CO2 Emissions (Ton. / year) 568.30 30 95%
Reduction of the
Average
T ºC
temperature of the 35.55ºC -14%
Average / %
Emission air % (change of
and radiant Air qualitity materiality)
temperature 41.5ºC
Temperature
Urban reduction for
T ºC
Public change of 33.5ºC -19.2%
Average / %
transport materiality and
vegetation
Acoustic
Noises Noise level Decibel 60 a 120 Until 60 50%
quality
Useful life and Without
Vibrations Buildings % void 100%
pathologies fact
Percentage pedestrian surface +
% 9.80 12.49 +21.5%
Reconquista intervention
Motorized
Cars street
Transport circulation % 90.2% 87.51% -3 %
load /
unload
Table 3 Environmental and economical improvements identified in Suipacha Street before (S0) and
after (S1) the intervention.
Social Sustainability
Functional aspects
The creation of Pedestrian Priority Streets makes possible the creation of new nodes which
could encourage the development of new activities and new meeting place in the middle of the
city.
The new configuration generates spaces less determined by the presence of the car and
therefore more comfortable and secure for the pedestrian. The maximum allowable speed of 10
km/hour enables the coexistence of all modes of transport, the local needing of transportation,
bicycling and walking.
The Pedestrian Priority Program has allowed increasing the area destined to public space and
walking to 12.49% vis-à-vis the initial situation. Table 4 shows the cumulated increase of the
intervention carried out in the context of the program.
Even if the motorized road area is still important, the progress demonstrated in the
environmental parameters guarantee the development of new activities and functions.road
Intervention m2 %
motorized
Total area public space 773.327 100%
Total area existing pedestrian streets 58.739 7,59% 92.40%
Total area pedestrian public space +Carabelas 60.208 7,78% 92.22%
Pedestrian Priority Street.
Total area pedestrian public space + Carabelas
Pedestrian Priority Street+ Reconquista Pedestrian 75.862 9,80% 90.2%
Priority Street.
Total area pedestrian public space + Carabelas
Pedestrian Priority Street+ Reconquista Pedestrian 96.632 12,49% 87.51%
Priority Street+ Suipacha Pedestrian Priority Street.
Table 4 Evaluation and evolution of the pedestrian space.
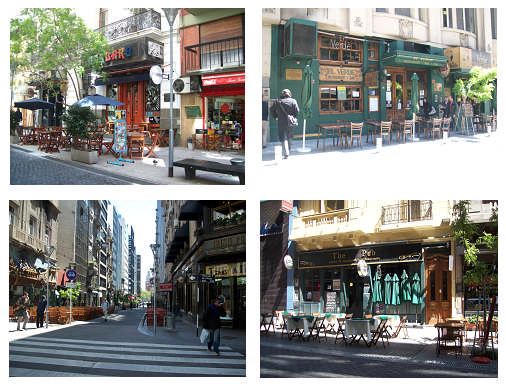
Social aspects
The Pedestrian Priority Streets and its surrounding area is stimulated by the presence of the
pedestrian during all day and late in the night. The area has become a reference point where the
people can get together and spend their time there. Therefore the Pedestrian Priority Street has
substantially strengthened the economic activities like offices, shops, bars and restaurants. A
new kind of public space is configured with miscellany and diversity of functions and multiple
connections between the activities.
Figure 12 Reconquista Street after the intervention. New economic activities and new functions.Economic Sustainability
The Pedestrian Priority Program has contributed to improve the urban and environmental quality
therefore the land value and the building rents have considerably increased. The revitalization of
the urban heritage, that privilege walking and cycling, regenerates the use of the public space
with better environmental conditions which increase new opportunities of investment.
In the specific case of Reconquista, the works cost U$S 862.897 and the intervention is valued
11 times than its cost: U$S 11.453.868. The parcels located along Reconquista street add
8.955 m2 of shops and restaurants and its valuation reaches the u$s 4 millions.
The average sale price of the shops located around Reconquista Street was u$s 2.096 per m2
before the intervention in 2008. This value increased 22% in the next year, reaching the u$s
2.539 per m2. Regarding the flats, they have increased its value 12.3%. In 2008 the average
sale price was u$s 1.884 per m2 and the next year reaches u$s 2.116 el m2.
The table Table 5 shows the added value of Reconquista Street and the Figure 13 the variation
of the average sale price of shops and flats.
3500,0
3192,7
2889,8
3000,0
2462,1 2504,8 2457,9
2500,0 2382,6
2239,9
1985,0
2000,0 1886,1
1500,0
1.599,5
1.507,4 1.547,1
1.365,4 1.417,8 1.389,6 1.388,8
1.319,1
1.253,0
1000,0
500,0
0,0 Junio Septiembre Diciembre Marzo Junio Septiembre Diciembre Marzo Junio
2007 2008 2009
Reconquista Average city
surroundings
Figure 13 Value of constructed m2 in Reconquista Street.
Price before Price after
the the Total Value Intervention value constructed
intervention Total value
intervention (%) (%) m2
(U$S m2) (U$S m2)
Shops 2.093,8 2.558,8 22,1 11,1 8.955 U$S 2.003.099
Flats 1.883,9 2.116,1 12,3 6,2 85.134 U$S 9.450.768
Total value U$S 11.453.868
Total value of Reconquista Street
works U$S 862.897
City added value U$S 10.590.970
Table 5 Reconquista Street added value.Conclusion The analysis of the economic and environmental impact realized on the streets Reconquista, Suipacha and Carabelas allows to appreciate the benefits of the Pedestrian Priority Program, which provides the basis for the success of future projects with similar characteristics. The new complete streets are more comfortable for walking and less determined by the presence of the car. Environmental sustainability It is possible to observe a big reduction of the noise annoyance and air pollution because of the restriction in the transport transit to a minimal access, allowing only the entry of particular vehicles. The parking in the street was removed; therefore horns, harmful emission, and vibrations have disappeared. Improving of air quality The sources of mobile emission in narrow streets with buildings of big height on both sides favour a major concentration of particulates and gases vis-à-vis to the wider avenues because of the difficulties in the dispersion of the air pollutant. The restriction of the transport transit in the Pedestrian Priority Streets involved the reduction of 97 % in the levels of the pollutants produced by the transport transit, which affected the air quality. Reduction of the noise pollution The reduction of noise impact is considered about a 50%, reaching acceptable values inside the levels of acoustic comfort. Social Sustainability Each Pedestrian Priority Street is constituted like a meeting place, generating points of social activity and promoting the diversity in the function of the area: offices, shops, bars and restaurants. The area is activated by the presence of the pedestrian during the day and in the night. Economic Sustainability The intervention in Reconquista, Suipacha and Carabelas Streets has allowed the development of economic activities, and the improvement of land value and rents. The renovation of the public space like a meeting place creates new opportunities of investments and contributes to the general development of the area.
Bibliography
Rueda, D., 2006. Plan Especial de Indicadores de Sostenibilidad Ambiental de la Actividad
Urbanística de Sevilla, [online]. Place: [Accessed 15 July 2010].
Consejería de Medio Ambiente y Ordenación del Territorio. Comunidad de Madrid. Ruido
ambiental, [online]. Place: [Accessed November 2009].
Osses Alvarado, M.E., 2000. Modelo de emisiones vehiculares, MODEM. Departamento de
Ingeniería Mecánica, Universidad de Chile. Unidad de Medio Ambiente y Energía. SECTRA,
[online]. Place:< https://www.u-cursos.cl> [Accessed November 2009].
Ochoa de la Torre, J.M., 1999. Balance Energético del Espacio Microclimático. In: La
vegetación como instrumento para el control microclimático. Tesis Doctoral. Escola Tècnica
Superior d'Arquitectura de Barcelona. Universitat Politècnica de Catalunya, [online]. Place:<
http://tdx.cat/bitstream/handle/10803/6124/01JMot01de12.pdf?sequence=1>           [Accessed:
November 2009].
Gehl, Jan, 2010. Cities for people. Editorial Island Press.
Katzschner, Lutz, 1998. Open space design strategies based on thermal comfort analysis.
University of Kassel, Kassel, Germany, [online]. Place:  [Accessed November 2009].
Subsecretaría de Planeamiento Urbano del Ministerio de Desarrollo Urbano, Gobierno de la
Ciudad de Buenos Aires, 2011. Subsecretaría de Planeamiento Urbano. Ministerio de Desarrollo
Urbano. GCBA. [online] Available at:
You can also read