Irish Water - Technical Report on Introduction of Specific Usage Prohibitions in All Areas Served via the National Public Water Supply
←
→
Page content transcription
If your browser does not render page correctly, please read the page content below
5th June 2020

                 Irish Water –
                 Technical Report on Introduction of
                 Specific Usage Prohibitions in All Areas
                 Served via the National Public Water
                 Supply
                 Under Section 56(16) of the Water Services Act 2007 (S.I. 30 2007) and Water
                 Services Act 2007 (Commencement) Order 2007 (S.I. No. 528 of 2008), art. 2
IW/FF/LDB/0115

                   1 | Irish Water | [Type Document Title]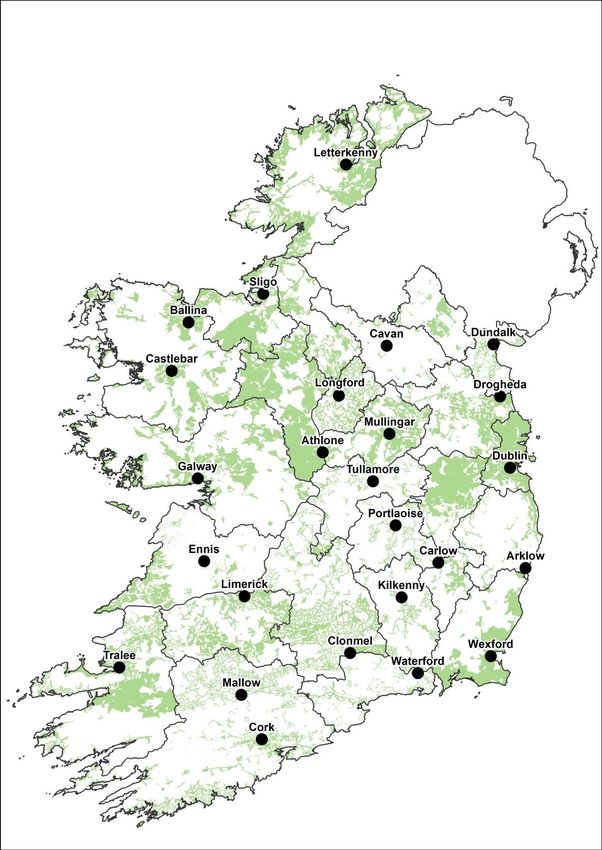
1. Note of Technical Expertise
Angela Ryan MSC BEng (Hons) C. Eng. MIEI
I am a Water Resource Specialist, working within the Asset Management
Section of Irish Water. I am a Civil Engineer by training and hold a BEng (Hons)
in Civil Engineering and an MSc in Civil and Environmental Engineering. I am a
Chartered Engineer and Member of Engineers Ireland. I am the Project
Manager for Irish Water’s National Water Resources Plan (NWRP).
Miriam Grant MEng BEng (Hons)
I have 7 years experience covering both water operations and planning with
recent experience covering analysis of water supply and demand balance and
projections for schemes across the country, as part of preparation of the NWRP.
I am a Civil Engineer by training and hold a BEng (Hons) in Civil Engineering
and a Masters in Engineering Management. I am a Member of Engineers
Ireland.
The NWRP will develop a roadmap for Irish Water to ensure supply demand
balance for all of our 535 Water Resource Zones (WRZs) nationally, and will
ensure that we can deliver our statutory obligations in terms of a safe reliable
water supply with sufficient provisions for growth, in line with national
government policy. The project includes source yield assessments, resource
modelling, treatment capacity, water resource planning, growth assessment,
supply demand scenario analysis and target headroom analysis for all water
resource zones nationally, which, in turn, allows Irish Water to identify where
any serious deficiencies of water available for distribution exist or are likely to
exist. The NWRP will also enable for drought and critical period planning.
As part of the work of assessing each WRZ supply / demand balance, the lack
of resilience in many of our schemes currently has been confirmed. This is
especially true for times of drought, when increased demands, combined with
reduced available raw water results, without restrictions, in a failure to meet the
daily water needs in full. It is a key objective of the NWRP to develop strategies
to eliminate these deficits. However, it will take several investment cycles to fully
implement the Plan, so that in the interim, Irish Water must manage its
resources to mitigate the impact of water shortages on communities, customers
and economic life.
Irish Water is aware of the significant impact that water usage
prohibitions/restrictions can have on both domestic and commercial life. On that
basis Irish Water only moves to considering the imposition of such
prohibitions/restrictions when, based on an extensive technical review of
available data, the situation cannot be properly managed in the absence of such
prohibitions/restrictions.

1 | Irish Water | Specific Usage Prohibitions National Public Water Supply
2. Technical Justification for Specific Use Prohibitions
Due to the on-going dry conditions in March and April 2020, followed by high
temperatures and corresponding drought conditions being experienced across
the entirety of the country, since early May 2020, Irish Water has experienced a
number of difficulties in relation to shortages in the public water supply.
The volume of water available for abstraction within water bodies nationally has
reduced and continues to reduce significantly, as a result of reduced natural
flowrates. At the same time demand for water has simultaneously increased
significantly over this period.
As access to a continuous water supply has a direct impact on public health,
Irish Water must ensure that it can maintain supplies all across the Country
during the current weather conditions and until the waterbodies from which we
abstract have had time to replenish.
In 2018 Irish Water introduced a number of Specific Usage Prohibitions across
the Country. The Specific Usage Prohibitions and restrictions, which were
introduced by Irish Water during the drought of 2018, were essential to and
instrumental in reducing water demand nationally and, in my view, prevented
large scale water outages that could have impacted on up to 50% of the
Domestic and Non-domestic water users reliant on the public water supply. To
date in 2020, our review of the statistics and data shows that the current
drought conditions are, in fact, more severe than those experienced in 2018 at
this early stage of the summer period. There has been sustained dry weather
through April and May 2020, and precipitation (rainfall) has been far below
normal for this time of year (and far in excess of what was experienced in April
and May 2018).
Although there has been some rainfall in the North West of the country in recent
days, low rainfall and high soil moisture deficits continue to be experienced
across country. The weather outlook for the next month is also predicted to be
drier than normal for this time of year. On that basis soil moisture deficits are
likely to increase in many areas of the country. Irish Water considers that further
prolonged dry spells will further deplete levels within the water bodies from
which we abstract, some of which are already trending towards critically low
levels. In order to maximise scarce resources for critical social and economic
needs, Irish Water now needs to take action to reduce demand for water across
all the public water supplies.
It is therefore necessary to immediately introduce a Specific Usage Prohibition
Order (to prohibit certain water usage across the Country). In my view this
prohibition order should, given the data currently available to me, be effective
for six weeks from the date it is made and should apply to all the public water
supplies nationally, across all regions. This Specific Use prohibition will assist
Irish Water to appropriately manage water supplies on a national basis so as to
ensure that the rate at which raw water sources are being depleted is controlled
until there is sufficient rainfall to replenish them.

2 | Irish Water | Specific Usage Prohibitions National Public Water Supply
The technical justification for the prohibition is that we are experiencing
drought and extreme weather conditions across the Country, evidencing a
critical decrease in water availability and/or increased demand for water. If
left unchecked, this will result in a risk of failure of the water supply
network. Irish Water must be especially cognisant of risk to water supplies
later in the year, due to the current prolonged period of dry weather so
early in the summer season. We must prudently manage that risk by
conserving and reducing water consumption now to ensure continuity of
supply across the Country through summer and autumn. Irish Water must
therefore take a precautionary approach in formulating the planned
prohibition and/or restriction of water supplies. In considering the
proposed restriction and/or prohibition and its duration, Irish Water must
and has considered the potential hardship to and economic impacts on
domestic and commercial water users.

3 | Irish Water | Specific Usage Prohibitions National Public Water Supply
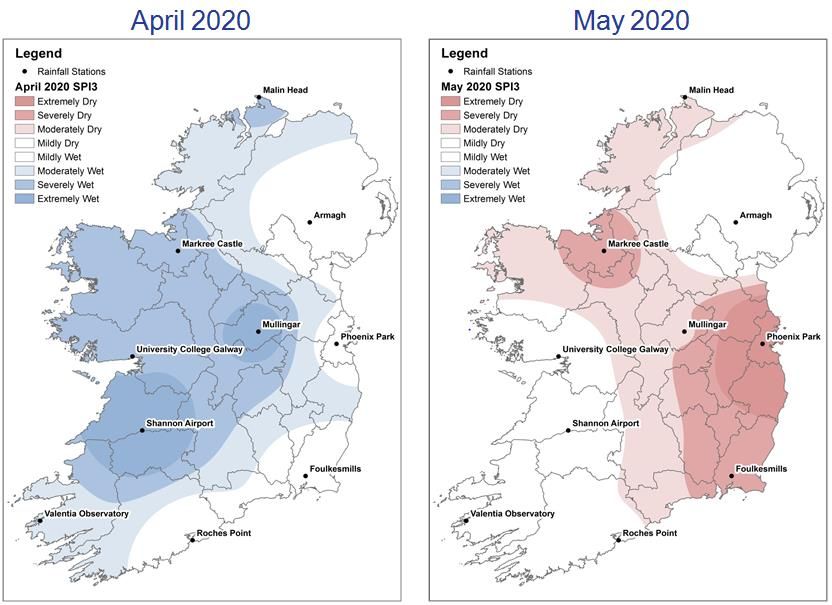
Figure 1- Irish Water Public Water Supply Network including Key Settlements

2.1 Evidence of Drought/Extreme Weather
Rainfall levels have been significantly below average for March, April and May,
across the country and Met Éireann Monthly Forecast predicts that precipitation
is likely to be less than normal over the coming weeks particularly in the
Southern and Eastern region. Whilst precipitation in the northwest might

4 | Irish Water | Specific Usage Prohibitions National Public Water Supply
experience nearer to normal levels in the coming weeks, due to the prolonged
dry spell in spring 2020, it may take many weeks to replenish the water sources
in that area.

Met Éireann has defined drought in Ireland as fifteen consecutive days with less
than 0.2mm of rainfall. On the 22nd of April 2020 Met Éireann declared an
absolute drought on the island of Ireland. There were 37 dry periods in Ireland
during 2020, between Wednesday 18 th March and the 19th May 2020. Of these,
27 were dry spells at 22 stations, eight were absolute droughts at eight stations
and two were partial droughts at two stations. The areas of partial and absolute
drought occurred in Dublin and Meath.

2.1.1                   Met Éireann Data

Met Éireann Data published data to the end of May, highlights the significant
reductions in rainfall over the months of March, April and May 2020. Many
gauging stations are showing less than 50% of the annual average rainfall for
May. By way of representative example, the data from the gauges in Phoenix
Park, Mullingar, Foulkesmills in Wexford, Markree Castle in Sligo, and Roches
Point in Cork are shown in Figures 2, 3, 4, 5 and 6.

           100.0
                              Rainfall - Phoenix Park Gauge
                 80.0

                 60.0

                 40.0
 Rainfall (mm)

                 20.0

                  0.0

             -20.0

             -40.0

             -60.0

             -80.0

                                           Figure 2 – Rainfall Phoenix Park

5 | Irish Water | Specific Usage Prohibitions National Public Water Supply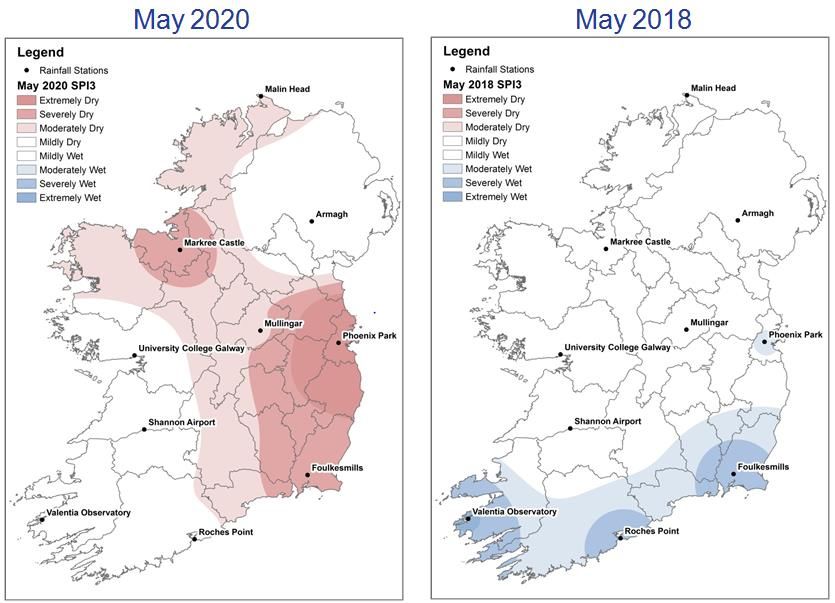
150.0
                            Rainfall - Mullingar Gauge

          100.0
 Rainfall (mm)

                 50.0

                  0.0

             -50.0

      -100.0

                                            Figure 3 – Rainfall Mullingar

                        Rainfall - Foulkesmills Gauge
           120.0

           100.0

                 80.0

                 60.0
 Rainfall (mm)

                 40.0

                 20.0

                  0.0

             -20.0

             -40.0

             -60.0

             -80.0

                                          Figure 4 – Rainfall Foulkesmills

6 | Irish Water | Specific Usage Prohibitions National Public Water Supply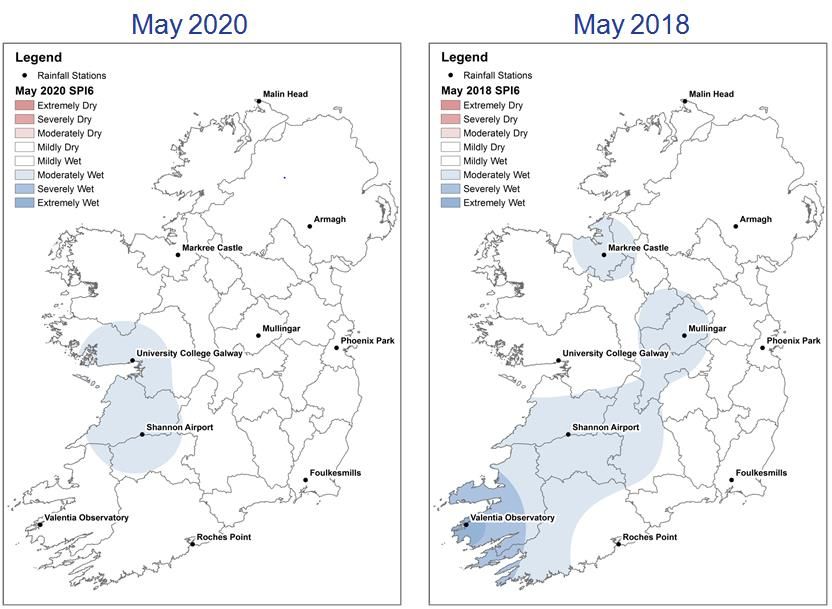
Rainfall - Markree Castle Gauge
    200.0

    150.0

    100.0
 Rainfall (mm)

           50.0

                 0.0

       -50.0

-100.0

                                        Figure 5 – Rainfall Markree Castle

                           Rainfall - Roches Point Gauge
    100.0

           80.0

           60.0

           40.0
 Rainfall (mm)

           20.0

                 0.0

       -20.0

       -40.0

       -60.0

       -80.0

                                              Figure 6 – Roches Point

This review of Met Éireann rainfall data alone indicates significantly low rainfall
levels across the country in recent months. This will cause a range of difficulties
across our national supplies including, water availability, difficulty in getting
water into treatment facilities, difficulty in treating water due to changes to raw
water characteristics, and insufficient supply to meet increasing demand.

7 | Irish Water | Specific Usage Prohibitions National Public Water Supply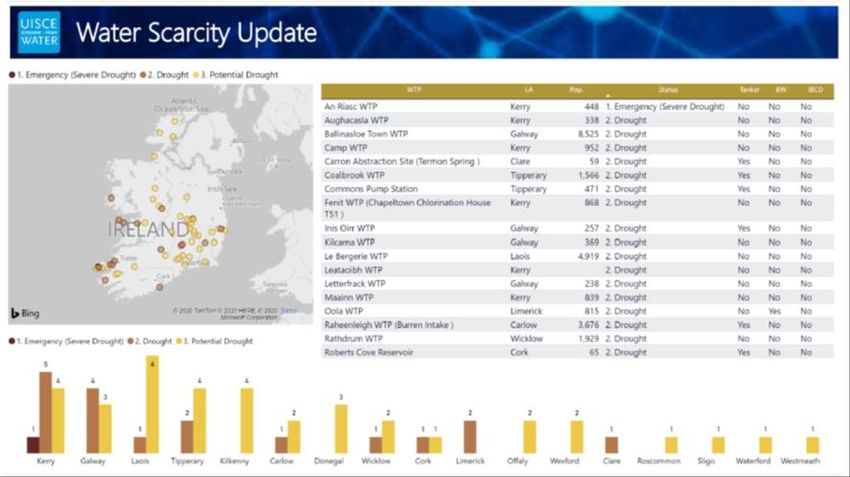
2.1.2 Drought Indicators
Irish Water has developed a draft Drought Management Plan that uses
statistical indicators to track current weather conditions in relation to drought.
Using these indicators, we identify triggers for action as we enter drought
periods and develop potential actions that can be used to maintain water supply
(where possible) during these conditions.
Irish Water’s indicator uses the Standardised Precipitation Index (SPI) method,
advocated by the World Meteorological Organisation. This indicator has been
developed for representative sites across the country where we compare rainfall
accumulations to the long-term average.
SPI is a normalised index representing the probability of occurrence of an
observed rainfall amount when compared with the data for long-term reference
period at a given location. Negative SPI values represent a rainfall deficit,
moving towards drought, whereas positive SPI values indicate rainfall surplus.
The larger the negative SPI values, the more serious the measured event is.
SPI is produced for 1, 3, 6 and 12 month (denoted SPI 1, 3, 6, 12 respectively)
accumulations. The draft Irish Water Drought Management Plan proposes the
following definitions, outlined in Table 1, for drought stages rated to SPI.
A negative SPI 1 value means that at that location, for the previous
month, there has been less rainfall than normal when compared to the
same month, when all historical rainfall records are considered. The lower
the value (-1, -2, -3) the drier the conditions. A single month of dry
weather would only impact some of our sources, such as shallow springs
or rivers where levels drop very quickly when there is no rain
(predominantly flashy upland catchments).
A negative SPI 3 value means that at that location, for the previous three
months, there has been less rainfall than normal when compared to the
same three months when all historical rainfall records are considered. The
lower the value (-1, -2, -3) the drier the conditions. Three months of dry
weather would have an impact on the majority of our water sources,
including river, lake and some groundwater abstractions.
A negative SPI 6 value means that at that location, for the previous six
months, there has been less rainfall than normal when compared to the
same six months when all historical rainfall records are considered. The
lower the value (-1, -2, -3) the drier the conditions. Six months of dry
weather would have an impact on the all of our water sources, including
river, lake, reservoirs, impoundments and groundwater abstractions. A
negative SPI 6 usually occurs when a dry summer follows a dry spring.
A negative SPI 12 value means that at that location, for the previous
twelve months, there has been less rainfall than normal when compared
to the historical record.
8 | Irish Water | Specific Usage Prohibitions National Public Water SupplyTable 1 – Drought Indicators
Drought Stage Trigger
Normal SPI above -1.
Potential Drought SPI of -1 or below
Drought SPI of -1.5 or below
Emergency (Severe Drought) SPI of -2 or below
Recovery in supply position and easing of
Post-Drought
environmental stress
As part of our technical review as to whether a Specific Use Prohibitions Order
may now be required, the April 1 month SPI index was developed for all
locations relating to the 750 water treatment plants on the public water supply.
This indicator would normally be used to flag issues that may arise on flashy
river sources where water levels are immediately responsive to rainfall, but at
present it is the key indicator for current conditions as the 3 month SPI indicator
is currently masked by heavy rainfall in February.
During April, 10% of the 750 Water Treatment Plants that make up the public
water supply, were located in areas classified as in drought or emergency
drought using the 1 month SPI Index, as shown in Table 2 and Figure 7. In
addition 11% were classified as potential drought.
Table 2 – April 2020 Drought Indicators National WTPs
Drought Stage Trigger No. WTPs %
Normal SPI above -1 589 79%
Potential Drought SPI of -1 or below 86 11%
Drought SPI of -1.5 or below 49 7%
Emergency (Severe Drought) SPI of -2 or below 26 3%
Potential Drought, 49 Emergency
Drought, 86 (Severe
Drought) , 26
Normal, 589
Figure 7 – April 2020 Drought Indicators National WTPs
9 | Irish Water | Specific Usage Prohibitions National Public Water SupplyOver the month of May 2020 the indicators deteriorated significantly, with 50%
of WTPs falling into the “Drought” or “Emergency Severe Drought” categories,
as shown in Table 3 and Figure 8 based on early warning indicators. In addition,
a further 31% of the indicators fall into the ‘potential drought’ category. Indeed,
only 19% of the indicators on a national basis registered as normal. As such, it
is clear that the vast majority of the water supplies are indicating potential
drought conditions at present or there is a very real likelihood that they will
move into drought conditions.
Table 3– May 2020 Drought Indicators National WTPs
Drought Stage Trigger No. WTPs %
Normal SPI above -1 144 19%
Potential Drought SPI of -1 or below 232 31%
Drought SPI of -1.5 or below 225 30%
Emergency (Severe Drought) SPI of -2 or below 149 20%
Potential
Drought, 232 Drought, 225
Emergency
(Severe
Drought) , 149
Normal, 144
Figure 8 – May 2020 Drought Indicators National WTPs
In the summer of 2018, Ireland experienced a severe drought and Irish Water
introduced a number of orders (referred to in this paper as ‘Specific Usage
Prohibitions’) under Section 56(16) of the Water Services Act 2007 (as
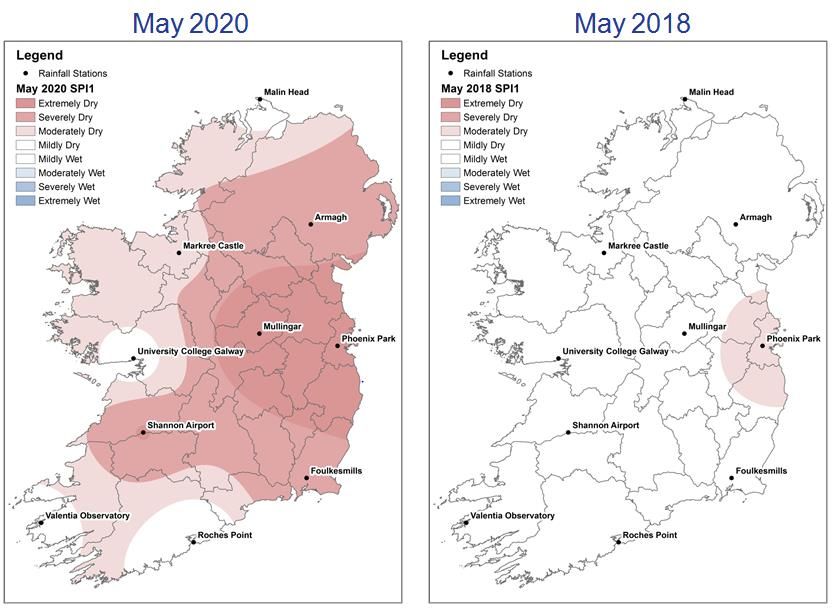
amended) prohibiting certain water usage. Comparing SPI 1 and 3 month index
for 2020 to 2018, gives an indication of the severity of the current situation
compared to the conditions that prevailed in 2018. Figure 9 outlines SPI 1 and
shows that May 2020 has been extremely dry across almost the whole country
compared to previous May months, and significantly drier than May 2018.
10 | Irish Water | Specific Usage Prohibitions National Public Water SupplyFigure 9 – SPI 1 May 2020 and May 2018
Figure 10 outlines SPI 3 (March – May) highlighting severe to extremely dry
conditions across the country, particularly in the East. It is clear that in
comparison to 2018 conditions, 2020 has, to date, been significantly drier.
Figure 10 – SPI 3 May 2020 and May 2018
11 | Irish Water | Specific Usage Prohibitions National Public Water SupplySPI 6 shown in in Figure 11 and shows relatively normal conditions over the
December to May 6-month period, as wet winters preceded the drier spring and
summer conditions in both of these years. However, wet winter conditions are
only of benefit to sources where there is high natural or artificial raw water
storage, and due to excess runoff or flood management during these periods,
retained reserves in storage (groundwater, lakes, and impoundments) are often
not sufficient to balance the drought impact later in the period. This means that
whilst SPI 6 at present shows normal conditions over the preceding 6 month
period it cannot be regarded as a good indicator of how our sources will perform
for the remainder of the summer and autumn if dry conditions continue. Again
the SPI 6 is worse than that recorded at for December to May 2018.
Figure 11 – SPI 6 May 2020 and May 2018
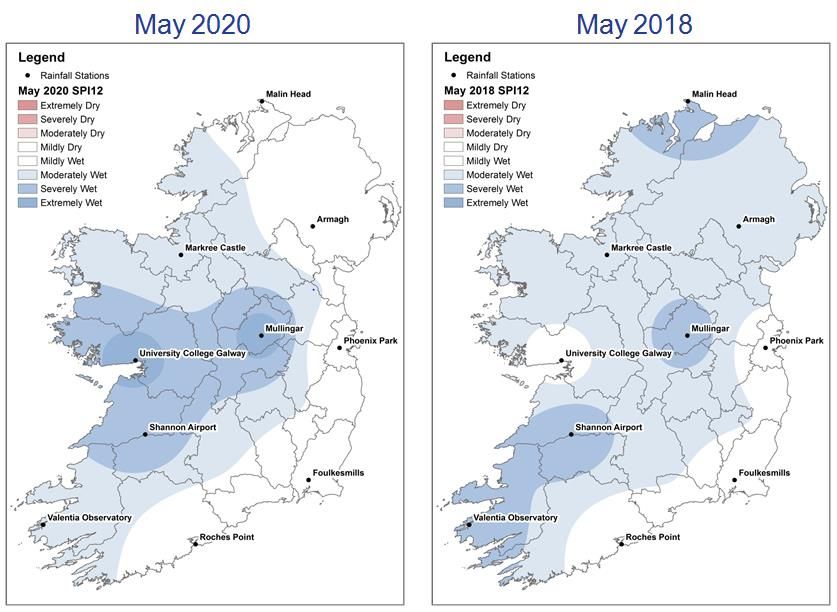
SPI 12 is outlined in Figure 12 and highlights how the previous 12 month
accumulation period shows the country has generally been wet and central/
western parts severely wet. This serves to flag the two extremes of wet winter
and dry spring/summer, but is not material to the present national water
resources deficit. This is because, nationally, we have few sources that can
withstand prolonged dry periods.
12 | Irish Water | Specific Usage Prohibitions National Public Water SupplyFigure 12 – SPI 12 May 2020 and May 2018
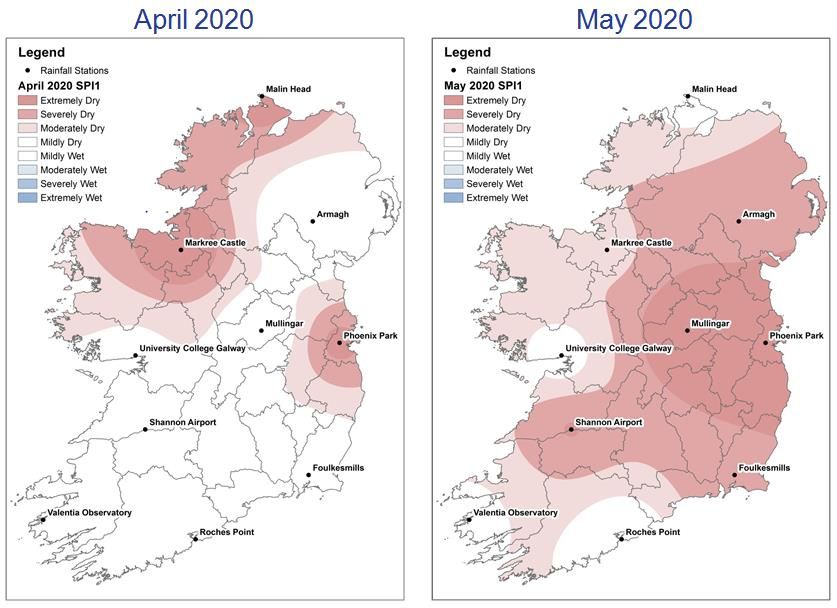
The changes in 1 month SPI index from April to May in Figure 13 shows the
increasingly dry conditions across the country, from April 2020 through May
2020.
Figure 13 – SPI 1 April and May 2020
13 | Irish Water | Specific Usage Prohibitions National Public Water SupplyThe changes in 3 month SPI index from April 2020 to May 2020 in Figure 14
show the transition from a wet period in February 2020 to an exceptionally dry
period in May.
Figure 14 – SPI 3 April and May 2020
Summary: On review of Met Éireann forecasts and drought triggers
developed as part of the draft Drought Management Plan, evidence of
significant continued low rainfall compared to historical norms have been
identified across the country.
2.2 Supply Side Pressures
Irish Water abstracts raw water from over 1,200 individual water sources,
including lakes, rivers, streams, springs and groundwater aquifers. All of these
sources are reliant on sufficient rainfall for recharge. In warm weather, water is
consumed by plant transpiration (take-up for growth) and evaporation from open
surfaces. Our data shows that this combination, along with continuous daily
abstractions, has significantly depleted surface and groundwater sources.
Soil moisture deficit is defined as the amount of rain needed to bring the soil
moisture content back to field capacity. With the exception of the far south and
southwest, soil moisture deficits currently range between 50 and 80mm, as of
the 2nd June, and with little rainfall forecast for the coming week, deficits are
likely to increase further. A soil moisture deficit of 50 to 80mm means that when
it rains, the soil in that area will try to absorb the first 50 to 80 mm of rainfall,
before excess can run off or percolate through the land to recharge natural
14 | Irish Water | Specific Usage Prohibitions National Public Water Supplywater bodies (lakes, rivers and aquifers) and replenish the sources of water for
the Public Water Supply
Mean air temperature and soil temperatures have been above average over the
last week and are expected to rise further during the coming week. If these
conditions continue over the next month, the low levels of predicted rainfall will
fail to recharge the rivers, lakes and aquifers from which we abstract water for
the public water supply, worsening the situation. Figure 15, shows the soil
moisture deficit for the Island of Ireland on the 2nd of June 2020. The deficits are
largest in the east of the country, where substantial rainfalls would be needed to
compensate, before any significant runoff would be expected. The deficits in this
area are significantly greater than at this time in 2018.
Well Drained Soil Moisture Deficit Moderately Drained Soil Moisture Poorly Drained Soil Moisture Deficit
nd
Figure 15 – Soil Moisture Deficit – Met Éireann 2 June 2020
2.2.1 Surface Water and Ground Water Supplies
Irish Water’s surface water and ground water supplies are currently under
significant pressure on a national basis. The data and analysis detailed below
provides context to these issues.
For surface water abstractions (such as rivers and lakes) individual catchment
characteristics and regional climatic conditions give rise to a pattern of flows
that varies from location to location. In practice, this variation in flow is
documented using a graphical representation known as a Flow Duration Curve
(FDC). The FDC describes the percentage of time that observed flow in a river
is likely to equal or exceed a specific flow value. For example, the 95th
percentile flow, denoted Q95, is the flow rate equaled or exceeded 95% of the
time at that site.
Therefore, conditions above Q95 are indicative of the low flow condition that
would occur during a drought period, where abstraction levels may be
constrained.
15 | Irish Water | Specific Usage Prohibitions National Public Water SupplyTechnically, the Q95 flow is an important metric in terms of water supply and
wastewater discharge. This flow is used as the design basis for most of our
water treatment plants and to calculate assimilative capacity of water bodies to
cope with licensed wastewater discharges. As the flow in a river falls to the Q96
and the Q97 flows, the amount of water available for water supply reduces, and
the risk of environmental damage due to wastewater discharges increases.
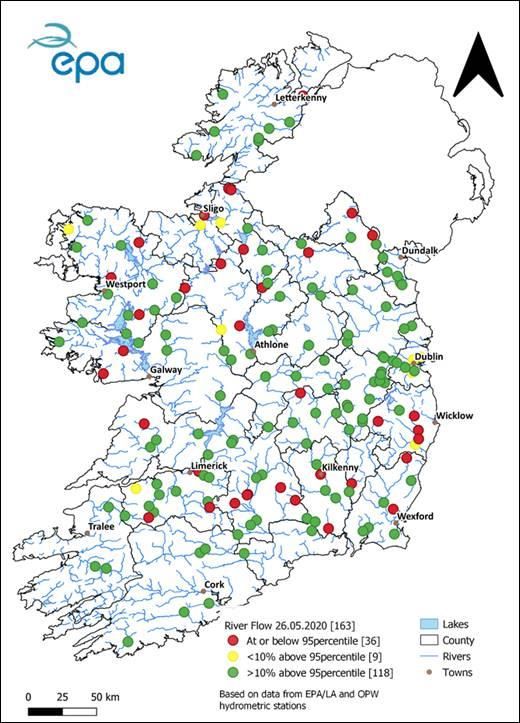
Figure 16 outlines the number of sites, based on data from EPA/ LA and OPW
hydrometric stations, at or below the Q95 flow as of the 26th May 2020. This
shows that 22% of the river flows are deemed to be below the Q95 low flow
condition.
Figure 16 – River Flows (Source: EPA, OPW)
Figure 18 outlines the time series flows for the water bodies at these gauging
stations, represented in the map in Figure 17, across the country. On each
graph, the upper black line represents the maximum flow on record, for the
16 | Irish Water | Specific Usage Prohibitions National Public Water Supplygiven site and the lower black line represent the minimum flow on record for that
time of the year. The light grey line represents the mean daily flows in 2018.
The red line represents the current mean daily flow. As can be seen, the
representative gauges are all trending downward, closer to the minimum level
recorded. Currently, all of the flows are cause for concern and in most cases are
already below the flows and water levels experienced in May 2018. This is likely
to continue to reduce further, if prolonged dry periods are experienced.
Figure 17 – Drought Reporting Flow Stations Surface Water
17 | Irish Water | Specific Usage Prohibitions National Public Water SupplyFigure 18 – Drought Reporting Flow Stations North West and East Midlands The continued dry conditions are also significantly impacting groundwater supplies across the country. Figure 20 shows the levels at a number of representative borehole sites, represented in the map on Figure 19. On each graph the upper black line represents the maximum level on record, for the given site and the lower black line represents the minimum level on record for that time of the year. The light grey line represents the daily level in 2018. The 18 | Irish Water | Specific Usage Prohibitions National Public Water Supply
red line represents the current level. As can be seen, the representative gauges
are all trending downward, following a wet period in February 2020. Currently,
all of the levels are cause for concern, and given that they are occurring at the
start of summer it is likely that they will deplete further. In most cases levels are
already below those experienced during the 2018 drought.

                            Figure 19 – Drought Reporting Groundwater Level Sites

                      Figure 20 – Drought Reporting Water Level for Groundwater Sites

19 | Irish Water | Specific Usage Prohibitions National Public Water Supply
In summary, our data shows that the water supplies sources (both surface water
and ground water) across all regions in the Country are under continued
pressure, due to the following:
Low precipitation and soil moisture deficits are effecting groundwater and
surface water recharge rates;
Due to Soil Moisture Deficits and the lowering water levels in rivers, lakes
and streams, it will, in our experience require significant immediate
rainfalls or normal rainfalls over several months for raw water sources to
recover and recharge to normal levels. No such rainfall is currently
predicted.
For groundwater supplies, as these water sources are slow to recover,
effects of the current drought or near drought conditions may impact
these sources for longer, potentially up to a 12 month period.
Many water bodies support multiple pressures (both abstractions &
discharges), including those for agricultural and other purposes such that
a focus on individual water schemes within particular regions does not
address the holistic environment of the waterbody
Lower flowrates in rivers and longer residence times in lakes imposes
increased environmental stress on water bodies, impacting the
assimilative capacity of these water bodies to cope with wastewater and
other discharges, with increased risks to the aquatic environment and
ecology
At present Irish Water is tracking Operational Performance of our supplies, in
order to see if they correspond to the drought indicators. At the end of May, six
sites in the south west of the country are so low that they have required to be
replenished via tankered water supplies. Conditions at a further 47 supplies
across Kerry, Galway, Laois, Tipperary, Kilkenny, Carlow, Donegal, Wicklow,
Cork, Limerick, Offaly, Wexford, Clare, Roscommon, Sligo, Waterford, and
Westmeath are deteriorating and are being continuously monitored by
operational staff. Based on similar try weather patterns in 2018, up to 180
supplies could be impacted within the next four weeks.
Figure 21 – Irish Water Drought Tracker
20 | Irish Water | Specific Usage Prohibitions National Public Water SupplyAlso, as the 2020 dry weather period started one month earlier than in 2018, it is anticipated that a greater number of supplies will be impacted this time around if rainfall does not increase significantly. Due to seasonal rain patterns, there is less potential for rainfall and source replenishment throughout the summer. Therefore it is essential that we take a prudent approach with all of our supplies at present in order to conserve supplies and ensure that we have enough water in our sources to last until autumn. I am aware that in order for a prohibition order to be made Irish water must form the opinion that a serious deficiency of water available for distribution exists or is likely to exist. In my view, and on the basis of my experience and the data detailed in this report, it is clear that the criteria have been met on a national basis. The data is clear that in Kerry, Galway, Laois, Tipperary, Kilkenny, Carlow, Donegal, Wicklow, Cork, Limerick, Offaly, Wexford, Clare, Roscommon, Sligo, Waterford, and Westmeath there is currently a serious deficiency of water available for distribution. Further, and most significantly, the data also clearly indicates that there is likely to exist a serious deficiency in water available for distribution in the remainder of the Country, in the absence of the measures outlined in this report or if weather conditions do not improve significantly (as noted elsewhere in this report they are not expected to improve significantly). I am satisfied, on that basis, that the measures outlined in this report should be implemented on a national basis. 2.3 Increased Demand for Water Demand for water across the Country is increasing as the dry weather continues. As the public water supply consists of 535 discrete water supplies, as part of this report we have chosen a sample of sites from around Ireland to represent the fluctuations in demand across the dry period. Consideration must also be given to the fact that non-domestic demand has been suppressed by the restrictions imposed as a result of Covid-19. Therefore, it is envisaged that demand will increase nationally over the coming weeks if restrictions are lifted, as is currently predicted. Figure 22 outlines the recent demand pattern in the Greater Dublin Area over April 2020 and May 2020. As highlighted in the graph, demand peaks occur on warm, sunny days. With this weather set to continue, it is likely that these demand peaks will continue to increase. 21 | Irish Water | Specific Usage Prohibitions National Public Water Supply
Figure 22 – Greater Dublin Area Demand Profile
2.3.1 Regional Outlook – Southern Region
In the Southern Region, operations are reporting increasing water demand at a
number of supplies, including the large regional supplies for Clonakilty and
Newmarket, as follows:
Clonakilty Regional
Demand has been increasing steadily across the supply since March, with more
frequent peaking events. Figure 23 outlines the demand pattern for Clonakilty
from January to May. Further points to note include:
The full month daily average demand for May 2020 was 7.3ML/d
The daily average demand for the last week of May 2020 was 7.9Ml/d
Demand increased from 6.5ML/d at start of May to current demand of
8.0ML/d
Demand is approximately 0.5ML/d higher than this time last year
Large agricultural demand exists across the scheme and further
agricultural demand may switch to public watermains, as private wells dry
up
Tourism and holiday home occupancy is likely to increase as phased
lifting of Covid 19 restrictions continue (compressed holiday season in late
July/August likely to be a major peak)
In 2018 demand peaked at about 9.5ML/d which required significant
tankering and night time restrictions.
22 | Irish Water | Specific Usage Prohibitions National Public Water SupplyClonakilty (Jones Bridge) WTP Production Jan to May
m³/day 2020 Peaking Factor
7,350
1.20
7,300
7,250 1.10
7,200
1.00
7,150
0.90
7,100
0.80
7,050
7,000 0.70
January February March April May
Average
Monthly…
Figure 23 – Clonakilty Regional Demand January – May 2020
Newmarket Regional
Demand has increased steadily since the end of March, and peak events are
coinciding with weekends. Further points to note include:
Daily average demand over 3 months in 2020 (March to May inclusive)
was 7.8ML/d
Daily average over 3 months in 2019 (March to May inclusive) was
7.5ML/d
Demand increased from 8.2ML/d at start of May to current demand of
8.4ML/d
Demand is approximately 1.0ML/d higher than this time last year
Maximum average monthly outflow through full 2019 year was 7.8ML/d
Large agricultural demand exists across the scheme and further
agricultural demand may switch to public watermains, as private wells dry
up
Tourism and holiday home occupancy is likely to increase as phased
lifting of Covid 19 restrictions continue
In 2018 monthly average demand was about 9.0ML/d during June and
July which required night restrictions.
2.3.2 Regional Outlook – North West Region
In the Northwest Region, Irish Water Operations are reporting increasing water
demand at a number of supplies across Donegal, Roscommon, Sligo, Galway,
Mayo, Cavan and Monaghan.
23 | Irish Water | Specific Usage Prohibitions National Public Water SupplyData on two of the large regional supplies for Buncrana in Donegal and
Tubbercurry in Sligo are summarised as follows:
Illies (Buncrana)
Demand has been increasing steadily across the supply since April, with more
frequent peaking events. Figure 24 outlines the demand pattern for Illies from
January to May 2020. Further points to note include:
The full month daily average demand for April 2020 was 11.7 Ml/d
The full month daily average demand for May 2020 was 11.8 Ml/d
Daily peaks of 10% are currently being encountered
Illies WTP Production Jan to May 2020
m³/day Peaking Factor
12,400
1.20
12,200
12,000 1.10
11,800
1.00
11,600
11,400 0.90
11,200
0.80
11,000
10,800 0.70
January February March April May
Average
Monthly…
Figure 24– Illies Regional Demand January – May 2020
Lough Talt (Tubbercurry)
Demand has been increasing steadily across the supply since April, with more
frequent peaking events. Figure 25 outlines the demand pattern for Lough Talt
from January to May. Further points to note include:
The full month daily average demand for April 2020 was 6.9 Ml/d
The full month daily average demand for May 2020 was 7 Ml/d
Daily peaks of 15% are currently being encountered
24 | Irish Water | Specific Usage Prohibitions National Public Water SupplyLough Talt WTP Production Jan to May 2020
m³/day Peaking Factor
7,100
7,000 1.20
6,900
1.10
6,800
6,700 1.00
6,600
0.90
6,500
6,400
0.80
6,300
6,200 0.70
January February March April May
Average
Monthly…
Figure 25 – Lough Talt Regional Demand January – May 2020
2.3.3 Regional Outlook – Eastern and Midlands Region
In the Eastern and Midlands Region, Irish Water Operations are reporting
increasing water demand at a number of supplies across Meath, Westmeath,
Wicklow, Kildare, Dublin and Laois
Data on the large regional supply for Mullingar in Co. Westmeath is summarised
as follows:
Mullingar
Demand has been increasing steadily across the supply since March, with more
frequent peaking events. Figure 26 outlines the demand pattern for Mullingar
from January to May. Further points to note include:
The full month daily average demand for April 2020 was 18.3 Ml/d
The full month daily average demand for May 2020 was 18.6 Ml/d
Daily peaks of 15% are currently being encountered
25 | Irish Water | Specific Usage Prohibitions National Public Water SupplyPortloman WTP Production Jan to May 2020
m³/day Peaking Factor
19,000
1.20
18,500
1.10
18,000
1.00
17,500
0.90
17,000
16,500 0.80
16,000 0.70
January February March April May
Average
Monthly…
Figure 26– Mullingar Regional Demand January – May 2020
In Irish Waters experience, the 2018 Order(s) and associated restrictions in
non-essential use achieved substantial reductions in peak water demand. By
way of example, in the Greater Dublin Water Supply Area, demand peaked at
615 million litres per day (MLD) in late June 2018, reduced to 580 MLD by 5th
July 2018 (after the 2018 prohibition was implemented) and below 550 MLD by
20th July 2018. These savings proved crucial in conserving water at
Pollaphouca Reservoir for the autumn period and enabled the treatment plants
to operate within design capacities, guaranteeing continuous safe supplies to
homes and businesses. In 2018, similar patterns in demand reduction were
observed in supplies across the rest of the Country when water usage
prohibitions were applied.
Summary: Evidence of the increases in demand during the current
drought period across the Country is clear and the effectiveness of the
Specific Use Prohibitions in 2018 in reducing demand and securing the
national water supply has been shown. It is now of extreme importance to
take steps to suppress water demand for non-essential purposes across
the country.
26 | Irish Water | Specific Usage Prohibitions National Public Water Supply3. Outlook for Month Ahead
There is a strong indication of below average precipitation across the country,
until the 11th June. Further meteorological guidance to the 3rd July 2020,
suggests that, during that period, the vast majority of the country looks set to
have average or below average precipitation. As the dry spring has depleted
water sources across the country, with levels and flows observed well below
normal levels, even a return to average rainfall conditions in some localized
areas, will not eliminate risk of supply failure in these areas until the sources
have had time to recover.
Currently, there are 53 supplies (out of a total of 535) on Irish Water’s Drought
Tracker. A summary of the status at these sites is outlined in Table 4. This
tracker will be updated from operational reports daily and used to support
contingency planning throughout the critical period.
Table 4 – Irish Water Drought Tracker Summary (May 2020)
No Sites 2020 Current Status
1 Emergency Drought
13 Drought
34 Potential Drought
5 Normal Status
Summary: The weather and climatic outlook would suggest that the warm
and dry conditions are to remain across the vast majority of the country,
with above average temperatures expected in the coming weeks. Further
data towards the end of June 2020 does not suggest any significant
rainfall likely to reverse the deficits currently being recorded. This would
indicate that there are likely to be further deficiencies in our water
supplies, over the coming months and, as such, the status at sites across
the Country is likely to continue to deteriorate.
Based on the data available to Irish Water and the detailed analysis of
same, across the entire country there is an increasingly high risk of water
deficiency in a growing number of supplies across the country.
4. Actions by Irish Water to Address Supply Demand
Balance
Irish Water has already had to take a number of actions to maintain supply at
critical sites. These have included:
Strict water shut offs were introduced at 2 of our sites in April 2020 and
the daily shut off times further extended in mid-May. Night time water
restrictions have been in place in other areas since the beginning of May.
In areas where availability of raw water sources is continuing to fall or
failing to replenish, Irish Water is optimising and managing available
sources where possible to ensure continuity of supply
27 | Irish Water | Specific Usage Prohibitions National Public Water Supply Irish Water is currently relying on tankering in water from other sites to
support some smaller local reservoirs at Carron WTP, Coalbrook WTP,
Commons WTP, Inis Oirr, Raheenleigh and Roberts Cove WTP.
Irish Water has had to implement temporary measures to ensure flow of
water into a number of our treatment plants, including Clonakilty WTP
which serves a population of 16,000.
Irish Water has conducted an extensive media campaign nationally, to
encourage consumers to conserve water. The campaign has involved
national and local radio, national television, social media and newspaper.
Active leakage reduction works are continuing in all regions as part of
Irish Water’s National Leakage Reduction Programme. This is a priority
programme to ensure maximum sustainable reduction in demand over the
next number of years. The Programme is focused on optimizing savings
through ‘Find & Fix’, pressure management and targeted pipe
rehabilitation, using our Leakage Management System (LMS) to support
daily management planning and oversight.
5. Additional Actions Required
In an effort to prevent or contain the extent of outages over the next weeks and
months, while dry weather conditions persists across the country, Irish Water
proposes to exercise its powers under Section 56 (16) of the Water Supply Act
2007, as amended, to make an order prohibiting certain water usage to cover
the entirety of the Country. The aim of such an order is to suppress demand –
thus saving water - through the prohibition of certain non- essential activities for
a specified period. It is proposed that the Order made under section 56 (16)
should provide for the prohibition of the following uses of water:
Use of water drawn through a hosepipe or similar apparatus for the purpose of –
i. watering a garden
ii. cleaning a private motor-vehicle using a domestic hosepipe
iii. cleaning a private leisure boat
iv. filling or maintaining a domestic swimming or paddling pool (except when
using hand held containers filled directly from a tap)
v. filling or maintaining a domestic pond (excluding fish ponds)
vi. filling or maintaining an ornamental fountain (with the exception of such
use for commercial purposes)
Vii. filling or replenishing an artificial pond, lake or similar application.
These are identical to the prohibitions that were introduced in 2018. In 2018
such prohibitions, along with further water restrictions, were shown to moderate
water demand from a peak of 15% above normal levels back to normal levels.
The specific use prohibitions involve the prohibition of certain non-essential
customer use, and will help to ensure that all customers receive continuity of
water supply over this difficult period, as far as possible.
28 | Irish Water | Specific Usage Prohibitions National Public Water SupplyThese measures apply to both domestic and non-domestic users equally and
are a more equitable and controlled way of suppressing demand compared to
wide scale outages that tend to impact disproportionately certain areas of the
network, or vulnerable users who have difficulty sourcing water.
It is my opinion that the proposed Order should be effective from the date it is
made for a period of six weeks. The six week duration is reflective of the current
condition of the sources, where flows and levels are at the lower extremes of
historical conditions for this time of year, and the weather outlook which is to
remain settled or dry for the next four weeks. Even after this period if there is a
return to average rainfall conditions, it will take a considerable period for some
sources to replenish. On that basis it may be necessary to extend the proposed
Order (or extend the proposed Order for certain parts of the country).
In order to enforce these powers, as per section 56(17) of the Water Services
Act 2007, Irish Water must give public notice of its intention to make an order,
and specify the period for which the order will remain in force, by publishing an
advertisement in a newspaper and causing notification of the proposed Order to
be broadcasting on radio or television. Section 56(16) does not specify any
notice period. Having regard to this, a reasonable notice period will be given.
The notice period will give consideration to the extent of the drought problem,
the restriction of non-essential activities, and the fact that unless this action is
taken and demand is not reduced, it is inevitable that there will continue to be
serious deficiencies of water available for distribution, and potential widespread
supply failure and large outages.
Continuous monitoring of the situation will be undertaken by Irish Water, to
ensure the specific use prohibitions order is only enforced for as long as is
necessary.
6. Covid-19 Service Challenges
Suppressing demand through the prohibition of non essential activities is vital to
ensure access to a continuous water supply over the coming months. Safe,
clean and reliable water supply is essential for public health and in light of the
current Covid-19 pandemic, good personal hygiene practice has become critical
to protect ourselves and others from the virus, and must be our first priority.
Irish Water is working to ensure continued supply through:
continuous monitoring of issues across all our supplies,
ensuring tankering and alternative supplies can be mobilised, if required
ensuring critical work such as leakage repairs can continue whilst
adhering to recent public health guidelines
promoting conservation through our national campaign.
However, it is likely that demand for water will start to increase over the coming
weeks, as business re-open, and construction related activities begin to
increase following the expected relaxation of Covid 19 restrictions. This will in
29 | Irish Water | Specific Usage Prohibitions National Public Water Supplyturn generate additional pressure on our water supplies which, as noted
elsewhere in this report, is already under considerable strain.
7. Conclusion and Recommendation
The national public water supply is considered at significant risk due to enduring
drought and extreme weather conditions which is depleting existing water
supplies, whilst giving rise to unprecedented increases in demand for water.
Met Éireann forecasts no significant rainfall over the next five days, across the
country. Existing water sources are already under severe pressure with water
levels continuing to fall. Irish Water has carried out practical measures to
increase supply and to reduce demand for water through managing pressures in
the network. Also, a large media campaign on water conservation is ongoing, in
an effort to reduce demand voluntarily. However, the situation remains serious,
and Irish Water must take all reasonable steps to ensure that we can conserve
water to reduce risks to the public water supply.
In 2018, a very prolonged dry period from early May 2018 to end of July 2018
resulted in severe depletion of water resources. Historically low levels were
recorded in both surface and groundwater sources which were especially critical
in the east and south of the country. Irish Water supplies came under severe
pressures in these areas as did many private supplies.
Irish Water responded to that crisis by introducing a number of orders
prohibiting water usage across the country. Our review of the 2018 data shows
that these prohibitions helped to conserve vital raw water resources so that
supplies were largely maintained, albeit with pressure restrictions and some
night-time restrictions, supplemented by tankering of water supplies to various
small schemes as an emergency measure. The restrictions in 2018 were limited
to measures which could be regarded as non-essential, protecting the needs of
public health and economic activity. It is proposed that the order recommended
in this report should only cover the prohibition of the same uses as set out in the
2018 order(s). This is especially critical in 2020, when the Covid 19 emergency
requires high quality hygiene practice at home and in workplaces.
The 2018 prohibitions achieved substantial savings in demand.
Given:
the prevailing weather conditions as set out in this report,
increased demand; and
the pressure on water supplies sources across all of the country,
it is essential that a usage prohibition order is introduced now on a national
basis to ensure that we can mitigate against the ongoing risk of failure in the
public water supply later in the year.
It is proposed that the prohibition order should run for a period of six weeks from
the date it is made so as to seek to allow raw water sources to recover. If it is
30 | Irish Water | Specific Usage Prohibitions National Public Water Supplypossible to lift the proposed order (or lift the proposed order in certain areas of
the Country) before the specified period expires, having regard to prevailing
weather conditions, availability of water resources and reduction in demand, this
will be done. Equally, it may be necessary to extend the specified period for the
entire Country (or for specific areas of the Country) for a further period and/or to
other water uses, should the prevailing conditions exist.
Recommendations:
Seek board approval to immediately use powers under section
56(16) of the Water Services Act 2007 as amended to introduce
o An order to prohibit certain water usage for all areas across
the State, for a six week period as from when the order is
made. The non-essential high water use activities to be the
subject matter of the order are as specified in section 5
above.
To develop and advertise all necessary advertisements and
notifications under section 56(17).
To stipulate that these prohibitions be maintained for a period of 6
weeks as from the date of the order and that it is a criminal offence
under section 56(18) not to comply with an order served pursuant to
section 56(16).
To apply these prohibitions in all areas of the Public Water Supply
network.
31 | Irish Water | Specific Usage Prohibitions National Public Water SupplyAlthough there has been some rainfall, particularly in the North and Western regions since then, due to significant soil moisture deficits, there has been no improvement in water levels on waterbodies nationally. In fact, the current dry weather conditions are developing into one of the most intense events experienced over the 168 year rainfall record available for Ireland. As detailed in the original technical justification documents for the Specific Usage Prohibitions, Irish Water has developed a draft Drought Management Plan that uses indicators to track current weather conditions in relation to drought. Using these indicators we identify triggers for action as we enter drought periods and develop potential actions that can be used to maintain water supply (where possible) during these conditions. 1 | Irish Water | Specific Usage Prohibitions National Public Water Supply
You can also read