Indirect Effects of Grazing on Wind-Dispersed Elm Seeds in Sparse Woodlands of Northern China - MDPI
←
→
Page content transcription
If your browser does not render page correctly, please read the page content below
land
Article
Indirect Effects of Grazing on Wind-Dispersed Elm
Seeds in Sparse Woodlands of Northern China
Yi Tang 1 , Mingyu Liu 1 and Zhanli Sun 2, *
 1   School of Life Science, Liaoning University, Shenyang 110036, China; tangyi@lnu.edu.cn (Y.T.);
     lmy13940106762@163.com (M.L.)
 2   Leibniz Institute of Agricultural Development in Transition Economies (IAMO),
     06120 Halle (Saale), Germany
 *   Correspondence: sun@iamo.de

 Received: 28 October 2020; Accepted: 2 December 2020; Published: 3 December 2020

 Abstract: Grazing leads to the reduction of biomass and plays a critical role in land degradation in
 arid and semiarid lands. However, the indirect effects of grazing on the ecosystem, e.g., the effect
 on seed dispersal, have not been well understood. In this study, we built an agent-based model
 (ABM) to simulate how grazing intensity affects the seed dispersal of elm trees, one of the native
 vegetation species of temperate woodlands in semiarid lands. The simulated results from the ABM
 and observed data from the real world were compared to assess the accuracy and validity of the ABM.
 The results show that elm seed densities in non-grazing, light, moderate, and heavy grazing lands
 were 74.97 ± 1.44, 57.63 ± 0.89, 37.73 ± 0.95, and 0.97 ± 0.05 seeds m−2 , respectively—an apparently
 decreasing trend. Moreover, as grazing intensity increased, the values of nugget, sill, and partial sill
 decreased and the value of the ratio of nugget to sill increased. This study indicates that the grazing
 indirectly leads to the reduction of elm seed density and the increase of spatial heterogeneity of elm
 seed on the ground in sparse elm woodlands. Moreover, values of geostatistical indices from the
 ABM were not significantly different from field observation data except for the ratio of nugget to sill.
 It shows that ABMs can reasonably replicate the spatial pattern of elm seed densities in the field and
 thus are useful for simulating long-distance seed dispersal in sandy lands. This finding suggests that
 the indirect effects of grazing should be considered to effectively protect sparse elm woodlands.

 Keywords: agent-based model; drylands; Horqin Sandy Land; land use; seed dispersal; spatial
 heterogeneity; vegetation cover

1. Introduction
     Grazing influences land use in arid and semiarid lands in various ways, ranging from changing
vegetation structure to inducing land degradation [1,2]. Grazing influences vegetation by modifying
individual growth, varying species abundance, and changing population dynamics [3]. Moreover,
grazing regulates the vegetation spatial pattern by changing the spatial heterogeneity of soil nutrients
and influencing both intra- and interspecies interaction [4–9]. However, the effects of grazing on seed
dispersal have rarely been considered. It is vital to obtain a thorough understanding of the effects of
grazing on seed dispersal. This could help us protect the ecosystem and combat land degradation in
arid and semiarid lands.
     Seed dispersal is a vital process linking the reproductive cycle of plants with the establishment
of their offspring. Thus, it has various implications for species population and ecosystem biology,
especially in arid and semiarid lands where winds primarily drive seeds to shape the pattern of
seed dispersal and mainly determine the spatial structure of plant populations [10,11]. At the same
time, the seed dispersal process is highly stochastic, and the underlying mechanism is notoriously

Land 2020, 9, 490; doi:10.3390/land9120490                                           www.mdpi.com/journal/land
Land 2020, 9, 490 2 of 11
challenging to quantify. In the current literature, field experiments and modeling approaches have
been conducted to explore the influencing factors of seed dispersal [12,13].
The seed dispersal process might be influenced by grazing in direct and indirect ways. Directly,
grazing promotes more seed production compared with exclosure lands [14,15]. Indirectly, the grazing
animals eat and trample vegetation. Furthermore, vegetation cover regulates seed survival on the
ground [16]. Thus, we hypothesize that grazing intensities regulate seed density patterns by changing
vegetation coverage.
The effects of grazing on seed dispersal have not been well understood. This might be due
to two reasons. One is that the effects of grazing on seed dispersal are difficult to test with field
experiments. Firstly, the trace of seed dispersal, especially long-distance, is not easy to follow [12].
Secondly, heterogeneous patches of vegetation cover could cause nonuniform samples in designed
experiments [17,18]. Additionally, the effects of grazing on seed dispersal in arid and semiarid lands are
commonly intertwined with the wind, the main factor regulating seed dispersal [19–21]. This makes
disentangling various driving factors extremely difficult.
Given the challenges and obstacles in field experiments, spatial simulating models have gained
increasing attention in ecological modeling for their capability to incorporate spatial and temporal
aspects of environmental factors and the dynamics of plants and animals [22]; in this case, the effects
of grazing and wind. Agent-based models (ABMs), also known as individual-based models in the
ecological modeling field, are spatially explicit models that take into account aspects of agents and
their interactions, as well as heterogeneous environmental factors [23–26]. While ABMs are mostly
used in simulating animal behaviors and patterns [27–29], recently, ABMs have been increasingly
used for plant ecology; for example, in simulating species distribution [30], tree regeneration
patterns [31], plant extensions [32], interspecies competition [33], and seeds dispersal [24,34]. However,
the combination of ABMs and grazing has rarely been reported, especially for arid and semiarid
regions, where grazing is the main driving force regulating vegetation and land-use type.
In this research, we built an ABM simulating seed dispersal that is associated with vegetation
cover, grazing, and wind. In this study, the main aim is to explore the indirect effects of grazing on
seed dispersal. Knowing the indirect effects of grazing on seed dispersal is vital for predicting the
spatial pattern of seed distribution and evaluating the probability of recruitment in lands. The specific
objectives are (1) to test our hypothesis, provided here, and (2) to verify the feasibility of the ABM
on sparse woodlands. For that, firstly, we built an ABM to simulate seed dispersal under various
wind frequencies and directions. Secondly, we compared the simulated results with the experimental
results observed in the field. Thirdly, we used the ABM to evaluate the effects of grazing under various
scenarios that consider the vegetation cover as heterogeneous environments.
2. Materials and Methods
2.1. Study Area
Horqin Sandy Land is located in a typical agriculture and pasture interlaced zone on the eastern
edge of the Mongolian Plateau [35] (Figure 1). Horqin Sandy Land, with an area of 5.23 × 10⁴ km2 ,
is one of the largest sandy lands in China [36]. Due to the sandy and loose soil, sparse vegetation
cover, and its semiarid climate condition, this area is highly prone to wind erosion and desertification.
Exacerbated by ever-intensifying human activities such as livestock grazing and agricultural expansion
and climate changes (e.g., the decreasing precipitation) in the past years, the risk of desertification and
land degradation remains very high [37,38]. The continuous land degradation of Horqin Sandy Land
attracts much attention from researchers and policymakers. A series of national ecological restoration
projects, such as the Grain for Green Project and the Beijing and Tianjin Sandstorm Source Treatment
Project, was implemented to fight for land degradation and preserve the fragile ecosystems [35].January being the coldest month, averaging −14.0 °C. The mean annual precipitation is 340 mm, of
which 70% falls in June, July, and August. The mean annual wind velocity is 4.4 m s−1, and the number
of gale days (>16 m s−1) ranges between 21 and 80. The windy season is from March to May, and the
growing season begins in late April and ends in late September. Typical plants are Caragana
Land 2020, 9, 490
microphylla 3 of 11
Lam., Setaria viridis (L.) Beauv., Bassia dasyphylla, Chenopodium glaucum Linn., Chenopodium
aristatum Linn., Lespedeza daurica (Laxm.) Schindl., and Pennisetum centrasiaticum Tzvel [6].
Figure 1.
Figure The location
1. The location of
of the
the study
study area
area (source: authors). (a)
(source: authors). (a)Horqin
HorqinSandy
Sandy Land
Land and
and the
the field
field
investigation sites (marked with the red rectangle); (b) location of Horqin Sandy Land
investigation sites (marked with the red rectangle); (b) location of Horqin Sandy Land in China; (c) in China;
(c) landscape
landscape of sparse
of sparse elmelm woodlands;
woodlands; (d) elm
(d) elm seedseed shadow
shadow on ground;
on the the ground; (e) field
(e) field experiments
experiments on
on the
the spatial pattern of seed densities; (f) aerial overview of the landscape of sparse elm
spatial pattern of seed densities; (f) aerial overview of the landscape of sparse elm woodlands. woodlands.
We mainly focused on the Wulanaodu area of Horqin Sandy Land (119◦ 390 –120◦ 020 E,
Sparse woodland is the native vegetation type and climax community in Horqin Sandy Land
42◦ 290 –43◦ 060 N, 480 m a.s.l.). This area is characterized by a continental semiarid monsoon climate.
[14]. It plays an essential role in reducing◦wind erosion, promoting ecological stability, and supplying
The average annual temperature is 6.3 C, with July being the warmest month, averaging 23.0 ◦ C,
ecological services [14,39]. Sparse woodland constitutes three layers, i.e., trees, shrubs, and herbs.
and January being the coldest month, averaging −14.0 ◦ C. The mean annual precipitation is 340 mm,
Additionally, Ulmus pumila L. (elm trees) is the key and defining species in sparse woodland. Elm
of which 70% falls in June, July, and August. The mean annual wind velocity is 4.4 m s−1 , and the
trees provide various ecosystem−1services and play critical roles in helping to maintain the stability of
number of gale days (>16 m s ) ranges between 21 and 80. The windy season is from March to
the ecosystem of sparse woodland. For example, elm trees provide a seed shadow for regeneration
May, and the growing season begins in late April and ends in late September. Typical plants are
and shade for grasses and livestock [15,16].
Caragana microphylla Lam., Setaria viridis (L.) Beauv., Bassia dasyphylla, Chenopodium glaucum Linn.,
Sparse woodlands and elm trees, in particular, are, however, threatened by ever-increasing
Chenopodium aristatum Linn., Lespedeza daurica (Laxm.) Schindl., and Pennisetum centrasiaticum Tzvel [6].
grazing pressure. Grazing leads to a decrease in the area of sparse woodland [14]. In addition, elm
Sparse woodland is the native vegetation type and climax community in Horqin Sandy Land [14].
trees are also adversely influenced by grazing in the aspects of seedling growth, reproduction
It plays an essential role in reducing wind erosion, promoting ecological stability, and supplying
allocation, and spatial distribution [6]. More interestingly, grazing also changes vegetation coverage
ecological services [14,39]. Sparse woodland constitutes three layers, i.e., trees, shrubs, and herbs.
and subsequently influences elm seed dispersal, which plays a vital role in the renewal of elm trees
Additionally, Ulmus pumila L. (elm trees) is the key and defining species in sparse woodland. Elm trees
in the wind season [40].
provide various ecosystem services and play critical roles in helping to maintain the stability of the
ecosystem
2.2. of sparseModel
The Agent-Based woodland. For example, elm trees provide a seed shadow for regeneration and
shade for grasses and livestock [15,16].
The
SparseABM here wasand
woodlands developed
elm trees,using NetLogo, aare,
in particular, freehowever,
softwarethreatened
platform for
by building ABMs
ever-increasing
[41,42].
grazingThe model description
pressure. Grazing leadslargely
to afollows the in
decrease ODD
the protocol, i.e., overview,
area of sparse woodlanddesign
[14].concepts, and
In addition,
details [43]. More details can be found in Supplementary Material. The purpose of the
elm trees are also adversely influenced by grazing in the aspects of seedling growth, reproductionmodel is (1) to
allocation, and spatial distribution [6]. More interestingly, grazing also changes vegetation coverage
and subsequently influences elm seed dispersal, which plays a vital role in the renewal of elm trees in
the wind season [40].Land 2020, 9, 490 4 of 11
2.2. The Agent-Based Model
The ABM here was developed using NetLogo, a free software platform for building ABMs [41,42].
The model description largely follows the ODD protocol, i.e., overview, design concepts, and details [43].
More details can be found in Supplementary Material. The purpose of the model is (1) to simulate the
seed dispersal of elm trees with wind directions in Horqin Sandy Land and (2) to evaluate the effects
of grazing on seed dispersal under scenarios of grazing intensities, i.e., light, moderate, and heavy.
Land 2020,
The model 9, xframework
FOR PEER REVIEW
is illustrated in Figure 2. 6 of 11
Figure 2. The diagram of geostatistical indices.
Figure 2. The diagram of geostatistical indices.
We built the model with two entities, seeds, and vegetation cover. The seeds were modeled
The variogram
as agents, and theirismovements
defined by werethe following
driven byparameters:
winds. Windnugget (C0), partial
directions sill (C),the
controlled sill direction
(C0 + C),
and
of range
the (a). These
movement of parameters
seeds. The seedperform differently
locations, in the spherical
quantified model, thesystem,
in a 2D coordinate Gaussian model,
i.e., x- and and
y-
the exponential
coordinates, model.
changed These models
depending are determined
on the wind, by the equations
with eight directions. above.the
We recorded We used the
locations geoR
of seeds
package
at in R to perform
each moment the geostatistical
and calculated analysis
the distance from [53].
the original point (xof=mean
The difference 0, y =in0).
theThe
spatial indices
vegetation
in thiswas
cover model and the
modeled asfield investigation
patches data was
within a regular determined lattice.
bidimensional with a t-test. The difference
Vegetation coverage,between
defined
grazing intensities was investigated with ANOVA and Turkey’s HSD test. P-values
as the percentage of the ground surface covered by herbs and shrubs, was assigned as an attribute less than 0.05
were
of eachconsidered significant
patch, a grid cell. Thein relationship
this study. between vegetation coverage and seed density followed
an experimental equation in the same study area [16], i.e., b = −0.131a2 + 9.527a − 30.53 (R2 = 0.446).
3. Results
Here, b indicates seed densities, and a indicates vegetation coverage.
The model was initialized with several parameters, including seed number, frequency of the eight
3.1. Model
wind Validation
directions, and vegetation coverage. The value of these parameters, except vegetation coverage,
was taken from atoprevious
According the resultsstudy [40].
of the Theinvestigation,
field value of vegetation coverage
the values was randomly
of nugget, designed
partial sill, sill, andandthe
varied within a range of 0–30%. We conducted the sensitivity analysis on the total number
ratio of nugget to sill in the plots were 127.93 ± 118.18, 241.05 ± 216.30, 368.97 ± 334.41, and 30.26 ± of patches
and
10.70running time steps
m, respectively. of the model,
Meanwhile, the which
outputsmight influence
of this the output
model showed thatof the model.
values of nugget, partial sill,
Thethe
sill, and effects
ratioofof
grazing
nuggeton toseed dispersal
sill were 39.57were focused
± 4.03, 38.49 ±on4.46,
changes
78.06in vegetation
± 2.56, cover.
and 50.99 Vegetation
± 0.05 m. The
cover has a significant relationship with seed densities [16]. Meanwhile, grazing influences
difference of mean in nugget, partial sill, and sill was not significant between the results of the field vegetation
cover by various
investigation anddegrees,
this modelaccording to grazing
(p > 0.05, Table 1).intensities [44]. Thus,
The difference we could
of mean in the evaluate the effects
ratio of nugget of
to sill
grazing on seed between
was significant dispersalthethrough
resultschanges in vegetation
of the field cover.and
investigation Thethis
changes
modelin(pvegetation
< 0.05; Tablecover
1). reflect
the changing grazing intensities under various scenarios.
Table 1. The comparison between the results of the field investigation (n = 4) and model outputs (n = 10).
Field
Model t- p-
Indices Investigation
Statistics Values
Mean S.E. Mean S.E.
Nugget (C0) 127.93 118.18 39.57 4.03 1.258 0.240
Partial Sill (C) 241.05 216.3 38.49 4.46 1.580 0.149Land 2020, 9, 490 5 of 11
2.3. Sensitivity Analysis
A sensitivity analysis is used to determine which parameters have more significant impacts on a
model and whether the model has stability [45,46]. The high and low values of parameter sensitivity
indices indicate whether a parameter change has a great or little effect on the model, respectively.
The changes in the sensitivity index could be the criteria to set the optimal values of particular
parameters. The sensitivity index (Syi ) is expressed as ([47,48])
dYt Xt
S yi = · (1)
Yt dXt
In Equation (1), Xt and Yt are the input parameters and output of the model at time t; dXt and dYt
are the changes in Xt and Yt . The output of this model is the seed density. The average sensitivity
index (S) is calculated as Equation (2), where n is the number of model repetitions.
n
1 X
S= · S yi· (2)
n
i=1
A small value of the sensitivity index of a particular parameter indicates that a change in the
values of this parameter has little effect on the model. Conversely, the relatively large value of the
sensitivity index of a particular parameter indicates that a change in the values of this parameter has
significant effects on the model. We select the relatively small values of the sensitivity index. Here,
the running time steps are set to 40.
2.4. The Field Investigation
At the end of the seed rain period, we randomly selected four plots (10 × 10 m) in enclosed
sandy grasslands in our study area. For these plots, the dominant species was Chloris virgata Swartz,
Setaria viridis (L.) Beauv., and Corispermum hyssopifolium L. The vegetation coverage in the four plots
was 10%, 30%, 10%, and less than 5%, respectively (the vegetation coverage was relatively low because
of decreased precipitation). In each plot, we counted the number of elm seeds in 100 subplots (1 × 1 m)
separately. According to seed densities in the subplots, the geostatistical indices of the spatial patterns
of seed dispersal were estimated.
2.5. Model Validation
How successfully the model-simulated results replicate the system behaviors of the real world,
i.e., observations on the ground, validates the ABM; this is critical to assessing the credibility of an
ABM [49]. We used an ABM to model the seed dispersal process by simulating the movement of
individual seeds. However, the ultimate goal of the model is to understand the macro patterns of
the targeted system, in this case, the spatial distribution patterns of the elm seeds. Thus, we used
the pattern-oriented modeling approach (POM) to validate the simulated outputs of our ABM [50,51].
Given the abstract nature of ecological modeling, with a loss of information during the modeling
process due to simplification and abstraction, POM focuses on a few relevant patterns in the real system.
Patterns are macro-level characteristics of a complex system and often emerged from the essential
underlying processes. Thus, POM is widely used to validate an ABM by testing how well an ABM
can replicate system-level patterns. In other words, if an ABM can reasonably reproduce structurally
realistic patterns, it is more likely that the model catches the key dynamics in the modeled system.
As there were many potential patterns for the seed dispersal process (e.g., the maximum or average
distance a seed travels, the shape of seed distribution of a single elm tree, density distribution of seeds),
we here focused on the spatial patterns of seed dispersal and chose geostatistical indices as our pattern.
The results of the spatial pattern of seed densities were calculated with geostatistical methods and
presented with geostatistical indices, including nugget, partial sill, sill, and the ratio of nugget to sillLand 2020, 9, 490 6 of 11
(see the data analysis section). Meanwhile, we obtained these geostatistical indices from the results of
the field investigation, and we compared the geostatistical indices from the field investigation to the
simulated results. The values of the geostatistical indices from the simulations fell into the interval
(mean ± 1 standard error) of corresponding values from the investigated results, indicating that the
model’s results are consistent with the data observed on the ground.
2.6. Scenario Analysis
To further explore the effects of grazing on elm seed dispersal under intensity scenarios,
we simulated the effects of grazing on seed dispersal with different intensities, including heavy
grazing (HG), moderate grazing (MG), and light grazing (LG). The loss of vegetation cover caused by
HG, MG, and LG was 85.90%, 45.90%, and 23.70%, respectively, when HG, MG, and LG was designed
as six sheep ha−1 , four sheep ha−1 , and two sheep ha−1 in Horqin Sandy Land (fine wool sheep, 50 kg
on average, 2-year-old) [44]. The values of loss in vegetation caused by grazing intensities were set as
parameters in this model under different scenarios. The different scenarios of grazing intensities on
seed dispersal could be simulated with the ABM.
2.7. Data Analysis
Geostatistical indices, including nugget, partial sill, sill, and the ratio of nugget to sill, were calculated
with geostatistical models (Figure 2). In geostatistical models, one core concept is the variogram. A variogram
characterizes the spatial continuity or roughness of a data set [52]. For each variable (Z), the variogram (γ)
can be calculated from all sample pairs with lag distance h between locations (s) as
1
γ(h) = E(Z(s) − Z(s + h))2 (3)
2
The variogram is defined by the following parameters: nugget (C0), partial sill (C), sill (C0 + C),
and range (a). These parameters perform differently in the spherical model, the Gaussian model,
and the exponential model. These models are determined by the equations above. We used the geoR
package in R to perform the geostatistical analysis [53]. The difference of mean in the spatial indices
in this model and the field investigation data was determined with a t-test. The difference between
grazing intensities was investigated with ANOVA and Turkey’s HSD test. p-values less than 0.05 were
considered significant in this study.
3. Results
3.1. Model Validation
According to the results of the field investigation, the values of nugget, partial sill, sill, and the ratio
of nugget to sill in the plots were 127.93 ± 118.18, 241.05 ± 216.30, 368.97 ± 334.41, and 30.26 ± 10.70 m,
respectively. Meanwhile, the outputs of this model showed that values of nugget, partial sill, sill,
and the ratio of nugget to sill were 39.57 ± 4.03, 38.49 ± 4.46, 78.06 ± 2.56, and 50.99 ± 0.05 m.
The difference of mean in nugget, partial sill, and sill was not significant between the results of the
field investigation and this model (p > 0.05, Table 1). The difference of mean in the ratio of nugget to
sill was significant between the results of the field investigation and this model (p < 0.05; Table 1).Land 2020, 9, 490 7 of 11
Table 1. The comparison between the results of the field investigation (n = 4) and model outputs (n = 10).
Field Investigation Model
Indices t-Statistics p-Values
Mean S.E. Mean S.E.
Nugget (C0 ) 127.93 118.18 39.57 4.03 1.258 0.240
Partial Sill (C) 241.05 216.3 38.49 4.46 1.580 0.149
Sill (C + C0 ) 368.97 334.41 78.06 2.56 1.470 0.176
Nugget/Sill (C0 /C0 + C) 30.26 10.7 50.69 0.05 3.227 0.010
Land 2020, 9, x FOR PEER REVIEW 7 of 11
3.2. Effects of Grazing on Seeds Dispersal
3.2. Effects of Grazing on Seeds Dispersal
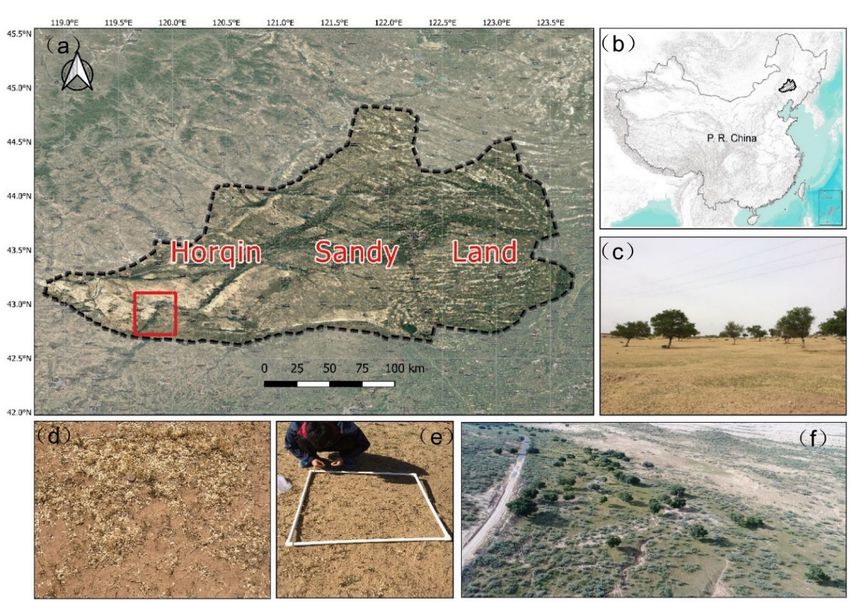
The elm seed densities in light, moderate, and heavy grazing lands were 57.63 ± 0.89, 37.73 ± 0.95,
The elm seed densities in light, moderate, and heavy grazing lands were 57.63 ± 0.89, 37.73 ±
and 0.97 ± 0.05 seeds m−2 , respectively. Meanwhile, the elm seed density in lands without grazing was
0.95, and 0.97 ± 0.05 seeds m−2, respectively. Meanwhile, the elm seed density in lands without grazing
74.97 ± 1.44 seeds m−2 . The difference in seed densities between grazing intensities was significant
was 74.97 ± 1.44 seeds m−2. The difference in seed densities between grazing intensities was significant
(p < 0.05).
(p < 0.05).
The values of nugget, partial sill, and sill in the heavy grazing treatment were far less than in the
The values of nugget, partial sill, and sill in the heavy grazing treatment were far less than in the
other three treatments (Figure 3a). The values of nugget, partial sill, and sill decreased along with the
other three treatments (Figure 3a). The values of nugget, partial sill, and sill decreased along with the
increase in grazing intensities (Figure 3a). Meanwhile, the values of the ratio of nugget to sill increased
increase in grazing intensities (Figure 3a). Meanwhile, the values of the ratio of nugget to sill
along with the increase in grazing intensities (Figure 3b). The values of nugget, partial sill, and sill
increased along with the increase in grazing intensities (Figure 3b). The values of nugget, partial sill,
were significantly different between heavy grazing and other intensities (p < 0.05).
and sill were significantly different between heavy grazing and other intensities (p < 0.05).
Figure 3. The geostatistical indices of seed density under different grazing intensities. (a) The values of
nugget,
Figurepartial
3. The still, and still under
geostatistical indicesdifferent grazingunder
of seed density intensities; (b) grazing
different the ratiointensities.
of nugget to(a)sill
Theunder
values
different grazing intensities. CK: without grazing; LG: light grazing; MG: moderate grazing; HG:
of nugget, partial still, and still under different grazing intensities; (b) the ratio of nugget to sill under
heavy grazing.
different grazing intensities. CK: without grazing; LG: light grazing; MG: moderate grazing; HG:
heavy grazing.
4. Discussion
With an increase in grazing intensity, seed densities decreased from 58 to 1 seed m−2 , indicating
4. Discussion
that grazing is likely to reduce the seed density of elm trees in sandy lands. This finding supports
With an increase in grazing intensity, seed densities decreased from 58 to 1 seed m−2, indicating
our hypothesis that grazing intensities regulate seed densities. However, this result is not consistent
that grazing is likely to reduce the seed density of elm trees in sandy lands. This finding supports our
with a previous study, where the seed density in grazing lands was more abundant than in exclosure
hypothesis that grazing intensities regulate seed densities. However, this result is not consistent with
lands [14]. In the previous study, only the direct effects of grazing on elm seed production were
a previous study, where the seed density in grazing lands was more abundant than in exclosure lands
considered, as seed density was investigated in the seed rain period; however, the indirect effects of
[14]. In the previous study, only the direct effects of grazing on elm seed production were considered,
grazing on seed production were not considered. Different from the previous study, we explored the
as seed density was investigated in the seed rain period; however, the indirect effects of grazing on
indirect effects of grazing on seed production, i.e., the effects of grazing on seed dispersal through the
seed production were not considered. Different from the previous study, we explored the indirect
change in vegetation coverage. This study found that the indirect effects of grazing play a vital role in
effects of grazing on seed production, i.e., the effects of grazing on seed dispersal through the change
seed dispersal. Vegetation coverage influences elm seed densities because it regulates seed dispersal
in vegetation coverage. This study found that the indirect effects of grazing play a vital role in seed
by wind [16]. Grazing mainly reduces vegetation cover through excessive foraging and trampling.
dispersal. Vegetation coverage influences elm seed densities because it regulates seed dispersal by
Thus, these studies suggest the effects of grazing on the elm seed dispersal are more complex than
wind [16]. Grazing mainly reduces vegetation cover through excessive foraging and trampling. Thus,
what we thought and have an impact through direct and indirect ways.
these studies suggest the effects of grazing on the elm seed dispersal are more complex than what we
thought and have an impact through direct and indirect ways.
With an increase in grazing intensity, values of nugget, sill, and partial sill decreased, but the
value of the ratio of nugget to sill increased, indicating that grazing causes an increase in the spatial
heterogeneity of seed densities. This finding confirms our hypothesis that grazing indirectly
influences seed density patterns by regulating grass vegetation coverage on the ground. Moreover,Land 2020, 9, 490 8 of 11
With an increase in grazing intensity, values of nugget, sill, and partial sill decreased, but the
value of the ratio of nugget to sill increased, indicating that grazing causes an increase in the spatial
heterogeneity of seed densities. This finding confirms our hypothesis that grazing indirectly influences
seed density patterns by regulating grass vegetation coverage on the ground. Moreover, this is also in
line with the findings from previous studies [8,16,54]. This study emphasizes the intermediary role of
vegetation cover in linking grazing and seed dispersal. Moreover, the spatial heterogeneity of seed
densities changed by the grazing may intensify the spatial heterogeneity of the vegetation as seed
dispersal provides seed sources for vegetation restoration [55].
The values of geostatistical indices from the ABM were not significantly different from the
investigated results, except for one index (the ratio of nugget to sill). It is suggested that the model
represents some of the key processes of the seed dispersal, and, consequently, the results of the
simulation are consistent with the field observations. It shows that ABMs are useful for simulating the
long-distance seed dispersal in sandy lands—a daunting task faced by researchers due to its highly
stochastic nature. Long-distance dispersal is relatively difficult to trace in experimental studies [12].
Meanwhile, existing simulated models depend on various environmental and vegetation factors
(including wind velocity, seed release height, and vegetation height) and their prior distributions,
which can be difficult to parameterize [13]. Therefore, ABMs have their advantages when simulating
seed dispersal as seed movements are modeled with simple rules [34].
The study also shows that ABMs can reasonably replicate the observations on the ground, that is,
the spatial pattern of elm seed densities, which has profound implications on elm seed germination,
seedling growth, and sapling growth. In this ABM, seed dispersal is mainly driven by winds and is
influenced by vegetation cover. To keep the parsimony of the model, only a few key factors such as the
direction and frequency of wind, vegetation cover, and grazing intensities are included. Factors not
considered in this research, such as wind power, slope, and animal predation, may be considered in
future research [56]. However, we believe the agent-based models should not include unnecessary
complications, which hinder model output analysis and the complexity represented in the model [57].
We believe that the model designed in this study strikes a balance with its parsimony and its capability
to replicate empirical observations.
5. Conclusions
The results show that a decrease of vegetation cover (mainly grass cover), as an indirect effect
of grazing, has a negative effect on the elm seed dispersal; in other words, grazing causes a decrease
of seed density on the ground. Alternatively, grazing leads to an increase in spatial heterogeneity in
sparse elm woodlands. This finding supports our hypotheses and suggests that the indirect effects of
grazing should be fully considered to protect sparse elm woodlands, which is the original vegetation
type of temperate woodlands in semiarid lands in this region.
This research demonstrates that ABMs are a promising approach in studying the seed dispersal
process, e.g., with their capability to fully consider plant and environmental factors at the same time.
Such ABM-based seed dispersal models can help us reveal the key dynamics in the complex process of
vegetation cover and land degradation in sandy lands.
Supplementary Materials: The following are available online at http://www.mdpi.com/2073-445X/9/12/490/s1,
Table S1: The state variables of entities, Table S2: Input data of this seed dispersal model.
Author Contributions: Conceptualization, Y.T. and M.L.; methodology, Z.S., Y.T., and M.L.; software, M.L.;
validation, M.L. and Y.T.; investigation, M.L. and Y.T.; writing—original draft preparation, Y.T. and M.L.;
writing—review and editing, Z.S. and Y.T.; visualization, M.L.; supervision, Z.S.; All authors have read and agreed
to the published version of the manuscript.
Funding: This research was funded by the National Nature Science Foundation of China (31870709).
Acknowledgments: We thank Peter Diggle for guiding us in the use of the geoR package.
Conflicts of Interest: The authors declare no conflict of interest.Land 2020, 9, 490 9 of 11
References
1. Miri, A.; Dragovich, D.; Dong, Z. Wind-borne sand mass flux in vegetated surfaces—Wind tunnel experiments
with live plants. Catena 2019, 172, 421–434. [CrossRef]
2. Van de Koppel, J.; Rietkerk, M.; van Langevelde, F.; Kumar, L.; Klausmeier, C.A.; Fryxell, J.M.; Hearne, J.W.;
van Andel, J.; de Ridder, N.; Skidmore, A.; et al. Spatial heterogeneity and irreversible vegetation change in
semiarid grazing systems. Am. Nat. 2002, 159, 209–218. [CrossRef] [PubMed]
3. Pande, T.N.; Yamamoto, H. Cattle treading effects on plant growth and soil stability in the mountain grassland
of Japan. Land Degrad. Dev. 2006, 17, 419–428. [CrossRef]
4. Saiz, H.; Alados, C.L. Changes in Semi-arid plant species associations along a livestock grazing gradient.
PLoS ONE 2012, 7, 9. [CrossRef] [PubMed]
5. Wan, H.W.; Bai, Y.F.; Hooper, D.U.; Schonbach, P.; Gierus, M.; Schiborra, A.; Taube, F. Selective grazing
and seasonal precipitation play key roles in shaping plant community structure of semi-arid grasslands.
Landsc. Ecol. 2015, 30, 1767–1782. [CrossRef]
6. Zhang, M.; Wu, J.; Tang, Y. The effects of grazing on the spatial pattern of elm (Ulmus pumila L.) in the sparse
woodland steppe of Horqin Sandy Land in northeastern China. Solid Earth 2016, 7, 631–637. [CrossRef]
7. Liu, C.; Song, X.X.; Wang, L.; Wang, D.L.; Zhou, X.M.; Liu, J.; Zhao, X.; Li, J.; Lin, H.J. Effects of grazing on soil
nitrogen spatial heterogeneity depend on herbivore assemblage and pre-grazing plant diversity. J. Appl. Ecol.
2016, 53, 242–250. [CrossRef]
8. Munyati, C. Spatial variations in plant nutrient concentrations in tissue of a grass species as influenced by
grazing intensity in a confined savannah rangeland. J. Arid Environ. 2018, 155, 46–58. [CrossRef]
9. Deleglise, C.; Loucougaray, G.; Alard, D. Spatial patterns of species and plant traits in response to 20 years of
grazing exclusion in subalpine grassland communities. J. Veg. Sci. 2011, 22, 402–413. [CrossRef]
10. Miri, A.; Dragovich, D.; Dong, Z. Vegetation morphologic and aerodynamic characteristics reduce aeolian
erosion. Sci. Rep. 2017, 7, 1–9. [CrossRef]
11. Wright, S.J.; Trakhtenbrot, A.; Bohrer, G.; Detto, M.; Katul, G.G.; Horvitz, N.; Muller-Landau, H.C.; Jones, F.A.;
Nathan, R. Understanding strategies for seed dispersal by wind under contrasting atmospheric conditions.
Proc. Natl. Acad. Sci. USA 2008, 105, 19084–19089. [CrossRef] [PubMed]
12. Bullock, J.M.; Clarke, R.T. Long distance seed dispersal by wind: Measuring and modelling the tail of the
curve. Oecologia 2000, 124, 506–521. [CrossRef] [PubMed]
13. Soons, M.B.; Heil, G.W.; Nathan, R.; Katul, G.G. Determinants of long-distance seed dispersal by wind in
grasslands. Ecology 2004, 85, 3056–3068. [CrossRef]
14. Tang, Y.; Jiang, D.; Lu, X. Effects of Exclosure Management on Elm (Ulmus pumila) Recruitment in Horqin
Sandy Land, Northeastern China. Arid Land Res. Manag. 2014, 28, 109–117. [CrossRef]
15. Tang, Y. Impact of grazing intensities on reproduction patterns of elm trees (Ulmus pumila) in degraded
sandy lands in China. PeerJ 2020, 8. [CrossRef]
16. Jiang, D.; Tang, Y.; Busso, C.A. Effects of vegetation cover on recruitment of Ulmus pumila L. in Horqin Sandy
Land, northeastern China. J. Arid Land 2014, 6, 343–351. [CrossRef]
17. Zuo, X.; Zhao, H.; Zhao, X.; Zhang, T.; Guo, Y.; Wang, S.; Drake, S. Spatial pattern and heterogeneity of soil
properties in sand dunes under grazing and restoration in Horqin Sandy Land, Northern China. Soil Till. Res.
2008, 99, 202–212. [CrossRef]
18. Tayyebi, A.; Jenerette, G.D. Increases in the climate change adaption effectiveness and availability of
vegetation across a coastal to desert climate gradient inmetropolitan Los Angeles, CA, USA. Sci. Total Environ.
2016, 548, 60–71. [CrossRef]
19. Nathan, R.; Safriel, U.N.; Noy-Meir, I.; Schiller, G. Spatiotemporal variation in seed dispersal and recruitment
near and far from Pinus halepensis trees. Ecology 2000, 81, 2156–2169. [CrossRef]
20. Xiao, Z.S.; Zhang, Z.B.; Wang, Y.S. Effects of seed size on dispersal distance in five rodent-dispersed fagaceous
species. Acta Oecol. 2005, 28, 221–229. [CrossRef]
21. Yang, Y.; Bai, Y.; Li, J. Seed dispersal and seedling recruitment of Ulmus pumila woodland in the Keerqin
Sandy Land, China. Acta Ecol. Sin. 2013, 33, 374–381. [CrossRef]
22. Wallentin, G. Spatial simulation: A spatial perspective on individual-based ecology—A review. Ecol. Model.
2017, 350, 30–41. [CrossRef]Land 2020, 9, 490 10 of 11
23. David, V.; Joachim, S.; Tebby, C.; Porcher, J.-M.; Beaudouin, R. Modelling population dynamics in mesocosms
using an individual-based model coupled to a bioenergetics model. Ecol. Model. 2019, 398, 55–66. [CrossRef]
24. Fedriani, J.M.; Wiegand, T.; Ayllon, D.; Palomares, F.; Suarez-Esteban, A.; Grimm, V. Assisting seed dispersers
to restore oldfields: An individual-based model of the interactions among badgers, foxes and Iberian pear
trees. J. Appl. Ecol. 2018, 55, 600–611. [CrossRef]
25. Grimm, V. Ten years of individual-based modelling in ecology: What have we learned and what could we
learn in the future? Ecol. Model. 1999, 115, 129–148. [CrossRef]
26. Grimm, V.; Railsback., S.F. Individual-Based Modeling and Ecology; Princeton University Press: Princeton, NJ,
USA, 2005.
27. Tang, W.; Bennett, D.A. Agent-based Modeling of Animal Movement: A Review. Geogr. Compass 2010,
4, 682–700. [CrossRef]
28. McLane, A.J.; Semeniuk, C.; McDermid, G.J.; Marceau, D.J. The role of agent-based models in wildlife ecology
and management. Ecol. Model. 2011, 222, 1544–1556. [CrossRef]
29. Loraamm, R.W. Incorporating behavior into animal movement modeling: A constrained agent-based model
for estimating visit probabilities in space-time prisms. Int. J. Geogr. Inf. Sci. 2020, 34, 1607–1627. [CrossRef]
30. Lin, S.; DeVisser, M.H.; Messina, J.P. An agent-based model to simulate tsetse fly distribution and control
techniques: A case study in Nguruman, Kenya. Ecol. Model. 2015, 314, 80–89. [CrossRef]
31. Wallentin, G.; Tappeiner, U.; Strobl, J.; Tasser, E. Understanding alpine tree line dynamics: An individual-based
model. Ecol. Model. 2008, 218, 235–246. [CrossRef]
32. Wong, S.; Anand, M.; Bauch, C.T. Agent-based modelling of clonal plant propagation across space:
Recapturing fairy rings, power laws and other phenomena. Ecol. Inform. 2011, 6, 127–135. [CrossRef]
33. Bittebiere, A.K.; Mony, C.; Clement, B.; Garbey, M. Modeling competition between plants using an Individual
Based Model: Methods and effects on the growth of two species with contrasted growth forms. Ecol. Model.
2012, 234, 38–50. [CrossRef]
34. Bialozyt, R.; Flinkerbusch, S.; Niggemann, M.; Heymann, E.W. Predicting the seed shadows of a Neotropical
tree species dispersed by primates using an agent-based model with internal decision making for movements.
Ecol. Model. 2014, 278, 74–84. [CrossRef]
35. Li, J.; Xu, B.; Yang, X.; Qin, Z.; Zhao, L.; Jin, Y.; Zhao, F.; Guo, J. Historical grassland desertification changes
in the Horqin Sandy Land, Northern China (1985–2013). Sci. Rep. 2017, 7, 3009. [CrossRef]
36. Yan, Y.; Zhu, J.; Yan, Q.; Zheng, X.; Song, L. Demarcation of the Horqin Sandy Land Boundary Based on
Remote Sensing and GIS Technique. Sci. Geogr. Sin. 2014, 34, 122–128.
37. Ge, X.; Dong, K.; Luloff, A.; Wang, L.; Xiao, J. Impact of land use intensity on sandy desertification:
An evidence from Horqin Sandy Land, China. Ecol. Indic. 2016, 61, 346–358. [CrossRef]
38. Liu, X.; He, Y.; Zhang, T.; Zhao, X.; Li, Y.; Zhang, L.; Wei, S.; Yun, J.; Yue, X. The response of infiltration
depth, evaporation, and soil water replenishment to rainfall in mobile dunes in the Horqin Sandy Land,
Northern China. Environ. Earth Sci. 2015, 73, 8699–8708. [CrossRef]
39. Yang, J.; Tang, Y. The increase in ecosystem services values of the sand dune succession in northeastern
China. Heliyon 2019, 5, e02243. [CrossRef]
40. Liu, M.; Tang, Y. The simulation in wind-driven seed dispersal of Ulmus pumila in sparse woodland steppe.
Chin. J. Ecol. 2018, 37, 2524–2531.
41. Railsback, S.; Ayllon, D.; Berger, U.; Grimm, V.; Lytinen, S.; Sheppard, C.; Thiele, J. Improving Execution
Speed of Models Implemented in NetLogo. JASSS J. Artif. Soc. Simul. 2017, 20. [CrossRef]
42. Wilensky, U. NetLogo. Center for Connected Learning and Computer-Based Modeling; Northwestern University:
Evanston, IL, USA, 1999.
43. Grimm, V.; Berger, U.; DeAngelis, D.L.; Polhill, J.G.; Giske, J.; Railsback, S.F. The ODD protocol A review and
first update. Ecol. Model. 2010, 221, 2760–2768. [CrossRef]
44. Zhang, T.; Zhang, T.; Toshiya, O.; Yasuhito, S. Soil Characteristics and Spatial Pattern of Vegetation after
Successive Grazing in Horqin Sandy Land, Inner Mongolia. J. Arid Land Resour. Environ. 2003, 17, 117–121.
45. Thiele, J.C.; Kurth, W.; Grimm, V. Facilitating Parameter Estimation and Sensitivity Analysis of Agent-Based
Models: A Cookbook Using Net Logo and R. JASSS J. Artif. Soc. Simul. 2014, 17. [CrossRef]
46. Snell, R.S. Simulating long-distance seed dispersal in a dynamic vegetation model. Glob. Ecol. Biogeogr. 2014,
23, 89–98. [CrossRef]Land 2020, 9, 490 11 of 11
47. Tang, Y.; Li, X. Simulating effects of precipitation and initial planting density on population size of Mongolian
pine in the Horqin Sandy Land, China. Agrofor. Syst. 2018, 92, 1–9. [CrossRef]
48. Wei, S.K.; Yang, H.; Song, J.X.; Abbaspour, K.C.; Xu, Z.X. System dynamics simulation model for assessing
socio-economic impacts of different levels of environmental flow allocation in the Weihe River Basin, China.
Eur. J. Oper. Res. 2012, 221, 248–262. [CrossRef]
49. North, M.J.; Macal, C.M. Managing Business Complexity: Discovering Strategic Solutions with Agent-Based
Modeling and Simulation; Oxford University Press: Oxford, UK, 2007.
50. Grimm, V.; Revilla, E.; Berger, U.; Jeltsch, F.; Mooij, W.M.; Railsback, S.F.; Thulke, H.H.; Weiner, J.; Wiegand, T.;
DeAngelis, D.L. Pattern-Oriented Modeling of Agent-Based Complex Systems: Lessons from Ecology. Science
2005, 210, 987–991. [CrossRef]
51. Wiegand, T.; Jeltsch, F.; Hanski, I.; Grimm, V. Using pattern-oriented modeling for revealing hidden
information: A key for reconciling ecological theory and application. Oikos 2003, 100, 209–222. [CrossRef]
52. Rossi, R.E.; Mulla, D.J.; Journel, A.G.; Franz, E.H. Geostatistical tools for modeling and interpreting ecological
spatial dependence. Ecol. Monogr. 1992, 62, 277–314. [CrossRef]
53. Ribeiro, P.; Diggle, P. geoR: A Package for Geostatistical Analysis. R News 2001, 1, 15–18.
54. Adler, P.; Raff, D.; Lauenroth, W. The effect of grazing on the spatial heterogeneity of vegetation. Oecologia
2001, 128, 465–479. [CrossRef] [PubMed]
55. Nathan, R.; Muller-Landau, H.C. Spatial patterns of seed dispersal, their determinants and consequences for
recruitment. Trends Ecol. Evol. 2000, 15, 278–285. [CrossRef]
56. Florencia Miguel, M.; Tabeni, S.; Cona, M.I.; Campos, C.M. Secondary seed dispersal by mammals between
protected and grazed semiarid woodland. For. Ecol. Manag. 2018, 422, 41–48. [CrossRef]
57. Sun, Z.L.; Lorscheid, I.; Millington, J.D.; Lauf, S.; Magliocca, N.R.; Groeneveld, J.; Balbi, S.; Nolzen, H.; Muller, B.;
Schulze, J.; et al. Simple or complicated agent-based models? A complicated issue. Environ. Model. Softw. 2016,
86, 56–67. [CrossRef]
Publisher’s Note: MDPI stays neutral with regard to jurisdictional claims in published maps and institutional
affiliations.
© 2020 by the authors. Licensee MDPI, Basel, Switzerland. This article is an open access
article distributed under the terms and conditions of the Creative Commons Attribution
(CC BY) license (http://creativecommons.org/licenses/by/4.0/).You can also read