Explainable AI meets Healthcare: A Study on Heart Disease Dataset
←
→
Page content transcription
If your browser does not render page correctly, please read the page content below
Explainable AI meets Healthcare: A Study on
                                                       Heart Disease Dataset

                                                  Devam Dave1 , Het Naik1 , Smiti Singhal1 , and Pankesh Patel2
                                                    1
                                                      Pandit Deendayal Petroleum University, Gandhinagar, India.
                                                     {devam.dce18, het.nce18, smiti.sce18}@sot.pdpu.ac.in
arXiv:2011.03195v1 [cs.LG] 6 Nov 2020

                                              2
                                                  Confirm SFI Centre for Smart Manufacturing, Data Science Institute,
                                                               National University of Ireland Galway
                                                                pankesh.patel@insight-centre.org

                                              Abstract. With the increasing availability of structured and unstruc-
                                              tured data and the swift progress of analytical techniques, Artificial In-
                                              telligence (AI) is bringing a revolution to the healthcare industry. With
                                              the increasingly indispensable role of AI in healthcare, there are grow-
                                              ing concerns over the lack of transparency and explainability in addi-
                                              tion to potential bias encountered by predictions of the model. This is
                                              where Explainable Artificial Intelligence (XAI) comes into the picture.
                                              XAI increases the trust placed in an AI system by medical practitioners
                                              as well as AI researchers, and thus, eventually, leads to an increasingly
                                              widespread deployment of AI in healthcare.
                                              In this paper, we present different interpretability techniques. The aim is
                                              to enlighten practitioners on the understandability and interpretability
                                              of explainable AI systems using a variety of techniques available which
                                              can be very advantageous in the health-care domain. Medical diagnosis
                                              model is responsible for human life and we need to be confident enough
                                              to treat a patient as instructed by a black-box model. Our paper contains
                                              examples based on the heart disease dataset and elucidates on how the
                                              explainability techniques should be preferred to create trustworthiness
                                              while using AI systems in healthcare.

                                              Keywords: Explainable AI, Healthcare, Heart disease, Programming
                                              frameworks, LIME, SHAP, Example based Techniques, Feature based
                                              Techniques

                                        1    Introduction
                                        For healthcare applications where explanation of the inherent logic is important
                                        for people who make decisions, machine learning’s lack of explainability restricts
                                        the wide-scale deployment of AI. If AI cannot explain itself in the domain of
                                        healthcare, then its risk of making a wrong decision may override its advantages
                                        of accuracy, speed and decision-making efficacy. This would, in turn, severely
                                        limit its scope and utility. Therefore, it is very important to look at these issues
                                        closely. Standard tools must be built before a model is deployed in the health-
                                        care domain. One such tool is explainability (or Explainable AI). The rationale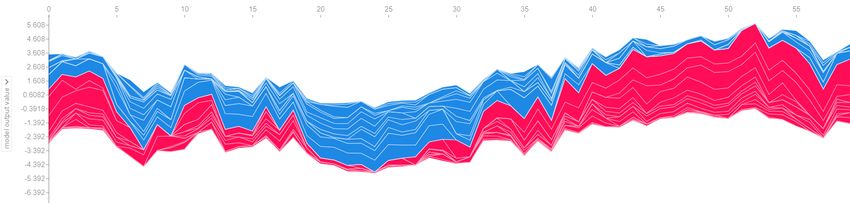
2         Devam Dave, Het Naik, Smiti Singhal, and Pankesh Patel

behind the use of Explainable AI techniques is to increase transparency, result
tracing and model improvement [6]. For instance, they explain why someone
is categorized as ill or otherwise. This would increase the trust level of medical
practitioners to rely on AI. Eventually, XAI can be integrated into smart health-
care systems involving IoT, Cloud computing and AI primarily used in the areas
of cardiology, cancer and neurology [3]. These smart healthcare systems can then
be used for diagnosing diseases and selection of the appropriate treatment plan.
In this paper, we look at some examples of various XAI techniques carried out
on the Heart Disease Dataset from UCI 3 along with the use cases related to the
technique. [9]
Objectives. The objective of this paper is to study and utilize different explain-
able AI techniques in the healthcare sector, as it gives transparency, consistency,
fairness and trust to the system. The particulars for the objectives are :
    – To study feature-based and example-based explainable AI techniques using
      the heart disease dataset.
    – To draw out the inferences from the results of these techniques and conclude
      selection of one technique over the other for a particular area of healthcare.
    We have worked on various techniques that give explanation of outcomes
given by the black box models. The paper gives insights on how these techniques
are advantageous in different conditions. Moreover, the different approaches fol-
lowed by them are studied.
Outline. The following is the structure of the paper. Section 2 gives an overview
of our approach, consisting different phases of Machine Learning (such as Model
training, Model deployment) and explainable AI. A brief description of the
dataset along with the explanation of features is presented in Section 3. Section
4 talks about the feature based techniques LIME and SHAP giving explanation
of the methods in detail with the support of examples. We describe various ex-
ample based techniques in the next Section 5. It gives insights on the different
techniques available in the library alibi and demonstrates their importance in
Explainable AI. Lastly, Section 6 discusses the findings of the entire paper and
concludes the work.

2      Our approach
The objective of our research is to present our early research work on building
Explainable AI-based approach for healthcare applications. Figure 1 presents an
ML life-cycle [9] in conjunction with XAI methods to obtain greater benefit from
AI-based black box models deployed in the healthcare domain.
Model training. ML algorithms use the historical healthcare data collected for
the purposes of training where they attempt to learn latent patterns and rela-
tionships from data without hardwiring the fixed rules (Circled 1 in Figure 1).
3
    Heart     Disease     Dataset:               https://www.kaggle.com/cherngs/
    heart-disease-cleveland-uci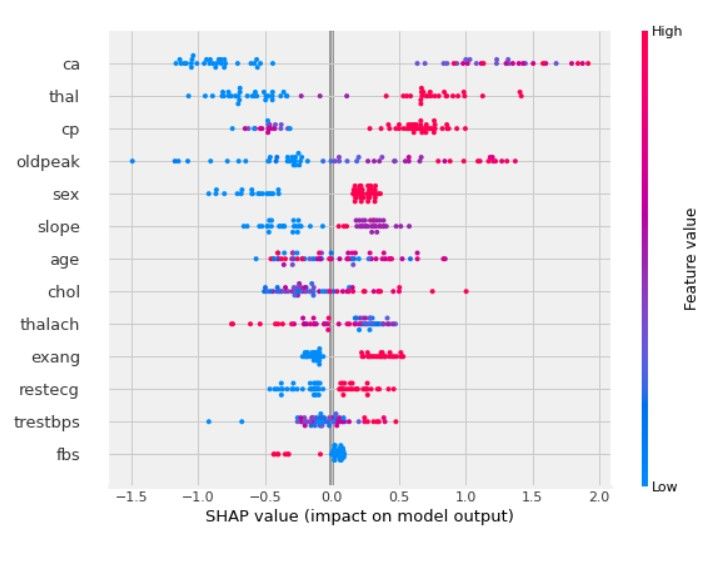
Explainable AI meets Healthcare: A Study on Heart Disease Dataset        3

                 Fig. 1. A ML Life-Cycle in Conjunction with XAI

We use the Heart Disease Dataset from the UCI ML Repository. This dataset
contains 70+ features. Its objective is to detect the existence of heart disease in
patients. The training leads to the generation of models, which are deployed in
the production environments (Circled 2 in Figure 1). We use the XGBoost (eX-
treme Gradient Boosting) algorithm for training, which is an implementation of
the gradient boosted decision trees developed for performance as well as speed.
    XGBoost is a decision-tree based machine learning algorithm based on a
boosting framework. Outliers don’t have a significant impact on the performance
of XGBoost. There is no requirement for carrying out feature engineering in XG-
Boost either. This is one of the only algorithms that can derive feature impor-
tance, which is an integral part of Explainable AI. XGBoost is highly suitable
for any kind of classification problem and therefore, appropriate for our paper
and project.
Model deployment and interpretability. The objective of implementing ex-
plainable AI techniques along with the deployed model is to interpret how the
prediction results are derived. The data is supplied to the trained model and
explainable AI module. By implementing explainable AI techniques, it allows us
to provide explanations along with prediction results (Circled 3 in Figure 1).
The explanation can be consumed by medical practitioners to validate the pre-
dictions made by the AI models. Clinical records along with explanation can be
used to generate deeper insights and recommendations. Section 4 and Section 5
present the explanation generated by various explainable AI techniques.
    Before we present various explainable AI techniques and their results, the
next section (Section 3) presents our heart disease case study and describe the
dataset.

3   Dataset Description

Heart disease is among the biggest causes of deaths in the entire world, its
mortality rate will even increase in the Post-Covid era as many heart problems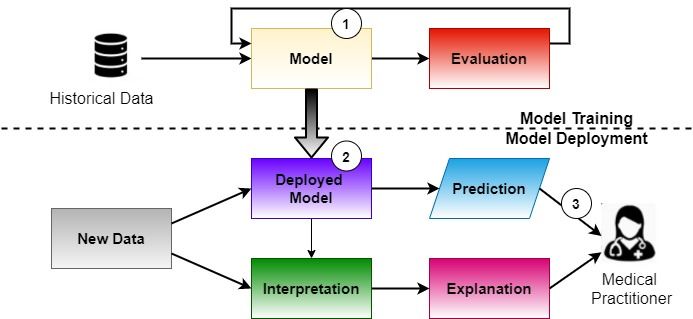
4        Devam Dave, Het Naik, Smiti Singhal, and Pankesh Patel

arise due to it. Prediction of a heart disease is one of the most important area
in the healthcare sector. Heart disease refers to blockage or narrowing down of
blood vessels, which can lead to chest pain or heart attack. The Heart Disease
Cleveland UC Irvine dataset is based on prediction if a person has heart disease
or not based on 13 attributes4 . It is re-processed from the original dataset having
76 features. In the following, we describe 13 features briefly:

 1. age: An integer value signifying the age of an individual.
 2. sex : 0 for female, 1 for male.
 3. cp: cp stands for the Chest Pain Type and ranges from 0-3 depending upon
    the symptoms experienced by a patient. They are classified using the symp-
    toms experienced by a patient. The three main symptoms of angina are:
      – Substernal chest discomfort
      – Provoked by physical exertion or emotional stress
      – Rest and/or nitroglycerine relieves
    According to the symptoms experienced, chest pain types are classified in
    the following ways:
    (a) 0 - Typical Angina: Experiencing all three symptoms
    (b) 1 - Atypical Angina: Experiencing any two symptoms
    (c) 2 - Non-Anginal Pain: Experiencing any one symptom
    (d) 3 - Asymptomatic Pain: Experiencing none of the symptoms mentioned
         above
    If cp is high, less exercise should be performed and sugar and cholesterol
    level of the body should be maintained
 4. trestbps: trestbps shows the resting blood pressure calculated in units of
    millimeters in mercury (mmHg). The ideal blood pressure is 90/60mmHg
    to 120/80mmHg. High blood pressure is considered to be anything above
    140/90mmHg. If trestbps is high, less exercise should be performed and if
    trestbps is less , respective medicine should be taken.
 5. chol : chol represents the cholesterol levels of an individual. A high cholesterol
    level can lead to blockage of heart vessels. Ideally, cholesterol levels should
    be below 170mg/Dl for healthy adults. If chol is high, normal exercise should
    be performed, and less oily food should be eaten.
 6. fbs: fbs represents Fasting Blood Sugar levels of a patient, by gauging the
    amount of glucose present in the blood. A blood sugar level below 100
    mmol/L is considered to be normal.
    (a) 1 signifies that the patient has a blood sugar level in excess of 120mmol/L
    (b) 0 signifies that the patient has a blood sugar level lower than 120mmol/L
    and If fbs is high, dash diet should be taken, and frequent intake of food in
    less amount should be taken
 7. restecg: restecg depicts the electrocardiograph results of a patient. restecg
    ranges between 0-2.
    (a) 0 - Normal results in ECG
    (b) 1 - The ECG Results have a ST-T wave abnormality
4
    Heart     disease     dataset         :      https://www.kaggle.com/cherngs/
    heart-disease-cleveland-uci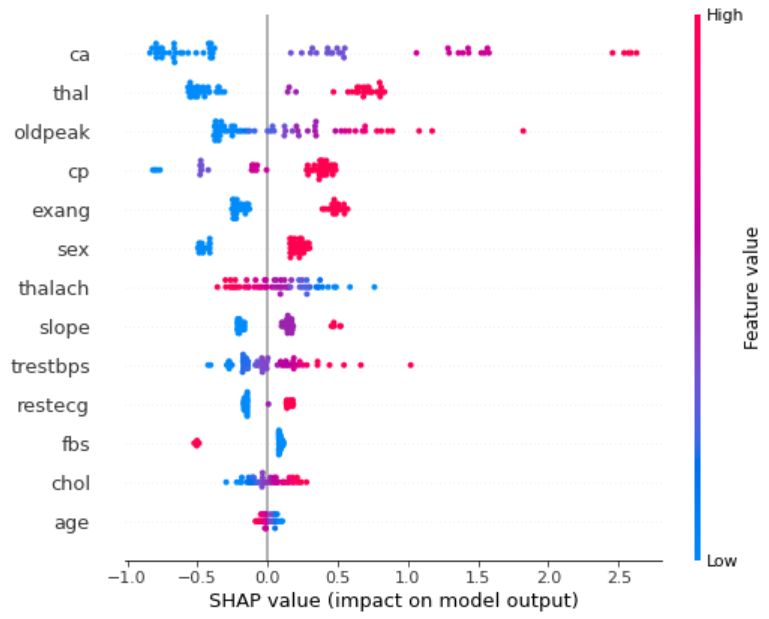
Explainable AI meets Healthcare: A Study on Heart Disease Dataset         5

      (c) 2 - The ECG Results show a probable or definite left ventricular hyper-
           trophy by Estes’ criteria
      If restecg is high, moderate exercise should be performed, dash diet should
      be taken, and frequent intake of food in less amount should be taken.
 8.   thalach: thalach shows the maximum heart rate of an individual using a
      Thallium Test. A Thallium test is an unconventional method for checking
      heart disease. It is carried out by injecting a small amount of radioactive
      substance (Thallium in this case) into the bloodstream of an individual,
      while he/she is exercising. Using a special camera, the blood flow and the
      pumping of the heart can be determined. thalach denotes the maximum heart
      rate achieved during this Thallium test. If thalach is low, proper exercise
      should be performed
 9.   exang: exang is a feature that reveals whether a patient has exercise induced
      angina (signified by 1) or not (signified by 0). Exercise induced angina is a
      kind of angina that is triggered by physical activity and exertion due to an
      increase in the demand of oxygen.
10.   oldpeak : oldpeak is the amount of depression of the ST Wave in the case of
      a patient having a value of 1 in restecg (ST-T Wave abnormality found in
      ECG Results). This peak is induced by exercise and is measured relative to
      the results at rest. If oldpeak is high, less exercise should be performed, and
      dash diet should be taken
11.   slope: slope is also concerned with the ST Wave in ECG Results.
      (a) 0 signifies an upward slope in the ST Wave
      (b) 1 signifies that the ST Wave is flat
      (c) 2 signifies a downward slope in the ST Wave
      If the slope is high, respective medicines should be taken, and dash diet
      should be taken.
12.   ca: The heart has 3 main vessels responsible for blood flow. An angiography
      is carried out and because of the dye, the unblocked vessels show up on a
      X-Ray. Ideally, three vessels should be visible on the X-Ray as this would
      mean that none of the vessels are blocked. If ca is high, angioplasty should
      be performed for the treatment of blocked vessels, at the later stage stent
      should be put if required, and bypass surgery should be performed in the
      worst case scenari0
13.   thal : thal denotes the results of Thallium test of an individual.
      (a) 0 denotes that the results were normal.
      (b) 1 denotes a fixed defect.
      (c) 2 denotes a reversible defect.
      Here, defect symbolises an obstruction in optimum blood flow. Thallium test
      is done in a physically exerted state. Fixed defect conveys a defect that stays
      even after the body is at rest. On the other hand, reversible defect is a defect
      that passes away as the body relaxes.

   Figure 2 depicts example instances of the heart disease dataset. Using this
dataset, we present the explanation generated by various explainable AI tech-
niques in Section 4 and Section 5.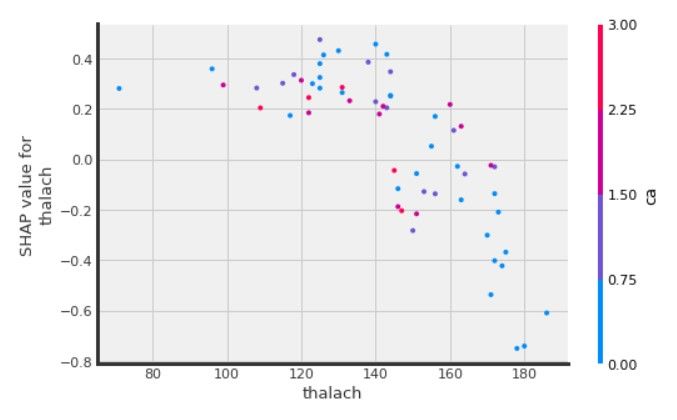
6 Devam Dave, Het Naik, Smiti Singhal, and Pankesh Patel
Fig. 2. Example instances of dataset.
4 Feature-Based Techniques
This section presents Feature-based model explainability techniques, which de-
note how much the input features contribute to a model’s output. There are many
Feature-based methods available such as permutation Feature Importance, Par-
tial Dependence Plots (PDPs), Individual Conditional Expectation (ICE) plots,
Accumulated Local Effects (ALE) Plot, Global surrogate models, Local Inter-
pretable Model-agnostic Explanations (LIME) and Shapley Additive Explana-
tions (SHAP). We discuss these methods in this section.
4.1 Local Interpretable Model-Agnostic Explanations (LIME)
LIME [7] is a technique that does not try to explain the whole model, instead
LIME tries to understand the model by perturbing the input of data samples
and comprehending how the predictions change. LIME enables local model in-
terpretability. A single data sample is modified adjusting some feature values
and the resultant output impact is observed. This is often linked to what human
interests are when the output of a model is observed.
Let us see an example on heart disease dataset to understand the concept
further.
print(’Reference:’, y_test.iloc[target])
print(’Predicted:’, predictions[target])
exp.explain_instance(X_test.iloc[target].values,
xgb_array.predict_proba)
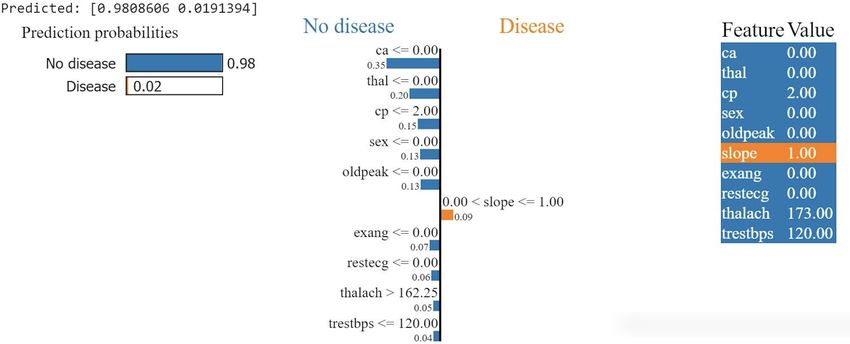
The left part of Figure 3 shows the prediction probabilities made by the
XGBoost model for the classes ‘No disease’ (98%) and ‘Disease’ (2%). The
middle part gives the features along with their weights which impact the predic-
tion probabilities. For instance, we notice if the cp value, in the range of 0.00 ¡
cp ¡= 2.00, contributes towards not having the disease. The right part indicates
the actual value of a particular feature for a specific local instance.
4.2 SHapley Additive exPlanations (SHAP)
SHAP [5] method increases the transparency of the model. It can be understood
well using the game theory concept from where the concept arises. The intuition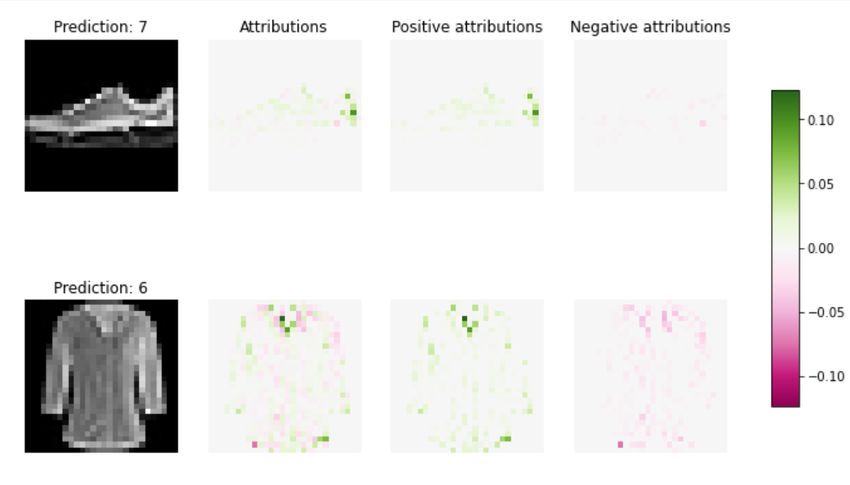
Explainable AI meets Healthcare: A Study on Heart Disease Dataset         7

                     Fig. 3. Explanations generated by LIME

is as follows. A prediction can be explained by presuming that each feature value
of the instance is a “player” in a game where the pay-out is the prediction itself.
Stemming from a method of coalitional game theory, Shapley values tell us how
to distribute the “pay-out” fairly among all the features.
    Coined by Shapley in 1953, the Shapley value is a method to assign pay-
outs to players based on their individual contribution to the overall pay-out.
Players collaborate in an alliance and reap some profits from this collaboration.
With its origins in the coalitional game theory, Shapley values point us in the
direction of fair distribution of “pay-out” amongst all players. This theory can be
employed in ML predictions and interpretability. A model prediction is explained
by equating each feature value of a dataset instance to a “player” in a game
wherein the prediction itself is the “pay-out.” The Shapley values throw light on
how to distribute the “pay-out” fairly between all features. The “game” is the
task of prediction for a lone dataset instance. The “gain” is the difference between
the actual prediction for the single instance and the average prediction for all
instances. Finally, the “players” are the instance feature values which cooperate
with each other to split the gains (equals to predicting a certain value).
    SHAP sets a mean prediction(base value) of the model and identifies the
relative contribution of every feature to the deviation of the target from the
base. It can give both local as well as global explanations. Let us consider the
local explanations first.
Local explanation. We will execute on several instances in order to show how
the SHAP values behave as a local explanation method. Below given are the
example of 3 particular instances which are randomly selected on which the
method is to be explained. Each case results into its own set of SHAP values
from which we get to know why a case received the particular prediction and
the contributions of the predictors.
shap.force_plot(explainer.expected_value,
                shap_values[instance_1,:],
                X_test.iloc[instance_1,:])

shap.force_plot(explainer.expected_value,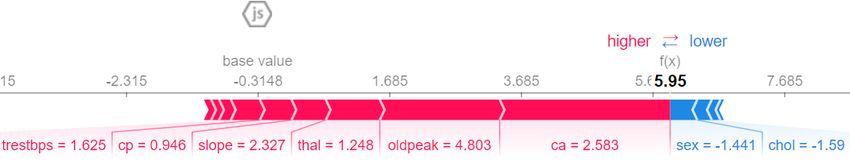
8       Devam Dave, Het Naik, Smiti Singhal, and Pankesh Patel

              Fig. 4. Local Explanation generated by SHAP force plot

                shap_values[instance_2,:],
X_test.iloc[instance_2,:])

              Fig. 5. Local Explanation generated by SHAP force plot

shap.force_plot(explainer.expected_value,
                shap_values[instance_3,:],
X_test.iloc[instance_3,:])

              Fig. 6. Local Explanation generated by SHAP force plot

    Using SHAP, we have seen two extreme cases in the same fashion as LIME.
Now, we look at a local explanation that isn’t as extreme. We see a good mix
of Red and Blue feature values from the figure shown above. Looking at both
cases individually:
    1. The most important feature values influencing the model to make the
decision that the patient has a heart disease are thal= 2 (Showing that there
are some defects in the blood supply and the quality of heart cells of the patient),
cp= 3 (Showing that the type of chest pain is asymptomatic. This may seem
counterintuitive, but asymptomatic chest pain is actually the most severe out
of the four types, which leads the model to believe that the patient has a heart
Explainable AI meets Healthcare: A Study on Heart Disease Dataset 9
disease.) and chol = 307 (High cholestrol leads to blockage of blood vessels of
the heart and decreases the overall blood flow in and around the heart).
2. The most important feature value influencing the model to make the de-
cision that the patient does not have a heart disease are ca = 0. This is perhaps
the most important feature, and from this we realise that none of the vessels of
the patient are blocked.
Global explanation. The collective SHAP values got shows how much each
feature contributes, how it contributes i.e. positively or negatively to the final
prediction. There are a number of types of plots which can show global expla-
nation as shown below.
shap.force_plot(explainer.expected_value,
shap_values[:1000,:],
X_test.iloc[:1000,:])
Fig. 7. Global Explanations generated by SHAP force plot
Fig 7 is a global explanation of the predictions of the model. -0.3918 is the
base value as obtained using the SHAP Values. This means that if the total value
is more than -0.3918, it signifies that the patient has the disease and if it is less
than -0.3918, it signifies that the patient does not have the disease. The blue
part of the graph pushes the prediction lower, and the red part is responsible for
increasing it. This means that the instances in which there are a lot more red
colored features will usually be 1 (having a disease) and vice versa.
shap.summary_plot(shap_values, X_test)
By the scatter plot graph shown in Figure 8, we have visualised the effects
of the features on the prediction at different values. The features at the top
contribute more to the model than the bottom ones and thus have high feature
importance. The color represents the value of the feature. (Blue meaning low,
purple meaning the median value and red meaning high). For example, in ca, we
see that when the dots are blue, the shap value is negative and when the dots
are red and purple, the shap values are mostly positive. This signifies that when
no vessels are blocked, chances of disease are low but as the number of vessels
blocked increases, so does the chances of having a disease.10 Devam Dave, Het Naik, Smiti Singhal, and Pankesh Patel
Fig. 8. Explanations generated by SHAP summary plot
shap.dependence_plot(ind=’thalach’, interaction_index=’ca’,
shap_values=shap_values,
features=X_test,
display_features=X_test)
This scatter plot in Figure 9 shows us the relation between two features, as
well as the SHAP Values. The X-axis shows us thalach (maximum heart rate),
the Y-axis shows us the SHAP Values and the color of each dot shows us the
value of ca. More often than not, the shap values are low when the value of ca
is low. There is also a slight trend of the shap values decreasing as the value of
thalach increases.
5 Example-Based Techniques
This section presents Example-based model explainability techniques, which de-
note how much an instance contributes to a model’s output. There are many
Example-based methods5 available such as Anchors, Counterfactuals, Counter-
factuals guided by Prototypes, Contrastive Explanation Method (CEM), Kernel
Shap, Tree Shap and Integrated Gradients. We discuss these methods in this
section.
5
Alibi example based techniques: https://github.com/SeldonIO/alibiExplainable AI meets Healthcare: A Study on Heart Disease Dataset 11
Fig. 9. Explanations generated by SHAP scatter plot
5.1 Anchors
Anchors are the local-limit sufficient conditions of certain features at which the
model gives a high precision prediction [7]. In anchors, the features are narrowed
down to certain conditions (i.e. anchors), which gives the prediction. Anchors
is based on the algorithm which works for model-agnostic approach for classi-
fication models of text, image and tabular data. Anchor takes into account the
global dataset and then gives the anchor feature-values. It is based on If-Then
rules for finding the features of the input instance responsible for the prediction
which makes it reusable and clear for which other instances it is valid.
Anchors are pretty much similar to LIME as they both provide local explana-
tions linearly, but the problem with LIME is that it only covers the local region
which might give overconfidence in the explanation and might not fit for an in-
stance which is not trained. LIME is only able to describe a particular instance
which means that, when new real world data is given as input which is unseen,
it may give confusing or unfaithful explanations. This is because it only learns
from a linear decision boundary that best explains the model. This is where
Anchors has an advantage over LIME. Anchors generate a local region that is a
better construction of the dataset to be explained. The boundaries are clear and
cover the area such that it is best adapted to the model’s behaviour. If the same
perturbation space is given to both LIME and Anchors, the latter will build a
more valid region of instances and which better describes the model’s behaviour.
Moreover, their computation time is less as compared to SHAP. Thus, Anchors
are a very good choice to validate the model’s behaviour and find its decision
rule.
The major drawback of Anchors is the fact that they provide a set of rules
which are not only easily interpretable and if they become excessively specific12 Devam Dave, Het Naik, Smiti Singhal, and Pankesh Patel
by including a lot of feature predicates, the area of coverage to explain the
observations decreases to a great extent.
Example on Heart Disease Dataset. Let’s take an example with Heart
Disease dataset. Suppose we take an instance where the features of the person
contribute to him/ her having a heart disease. The value of thalach of this
person is 131 and ca is 3, therefore AnchorTabular method makes the following
conclusions (See Figure 10) . We now apply the AnchorTabular method to see
which features contribute significantly for such type of prediction.
target_label=[’no heart disease’,’heart disease’]
print(’Person has’,
target_label[explainer.predictor(x_test[instance].
reshape(1, -1))[0]])
anchor=explainer.explain(x_test[instance])
print(’Anchor generated feature(/s)’,anchor.anchor)
Fig. 10. Example : An output of Anchor
The person’s maximum heart rate is 131 (which is less than 138). The blood
vessels coloured by fluoroscopy are 3 (greater than 1). As the maximum heart
rate of a person should be high and the blood vessels coloured by fluoroscopy
should be low, the above features act as anchors for the patient and deduce that
the person has a heart disease.
5.2 Counterfactuals
When a machine learning model is applied to real world data, along with the
reason for the decision of its outcome, it is also essential to know “what should
be the change in features in order to switch the prediction”. Counterfactual ex-
planations [10] is a model-agnostic XAI technique that provides the smallest
changes that can be made to the feature values in order to change the output to
the predefined output.
Counterfactual explainer methods work on black box models.6 Counterfac-
tual explanations work best on binary datasets. They can also work on classifica-
tion datasets with more than 3 target values, but the performance is not as good
as it is on binary classification datasets. In other words, if X is an independent
variable and Y is a dependent variable, counterfactual shows the effect on Y
due to small changes in X. Also, it helps to calculate what changes need to be
6
DiCE for Machine Learning: https://github.com/interpretml/DiCEExplainable AI meets Healthcare: A Study on Heart Disease Dataset 13
done in X in order to change the outcome from Y to Y ’. It gives us the what-if
explanations for the model. Counterfactuals has a variety of applications in all
sectors of society, from showing what changes need to be made to the feature
values in order to change a rejected loan to an accepted loan to the changes that
need to be made to the feature values of a patient suffering from a heart disease
or breast cancer to change it from being fatal to non-fatal.
An example on Heart Disease dataset.
m = dice_ml.Model(model=ann_model, backend=backend)
exp = dice_ml.Dice(d, m)
query_instance = {
’age’ : 67, ’sex’ : 1, ’cp’ : 3, ’trestbps’ : 120,
’chol’ : 229, ’fbs’ : 0, ’restecg’ : 2, ’thalach’ : 129,
’exang’ : 1, ’oldpeak’ : 2.6, ’slope’ : 1 , ’ca’ : 2,
’thal’ : 2 }
dice_exp = exp.generate_counterfactuals(query_instance
total_CFs=4
desired_class="opposite"
features_to_vary=[’thalach’, ’exang’, ’oldpeak’, ’slope’,
’ca’, ’thal’, ’restecg’, ’fbs’,’chol’,’trestbps’])
dice_exp.visualize_as_dataframe()
The value of condition field 0 signifies that the patient does not have a
heart disease. The value of condition field 1 signifies that the patient does have
a heart disease. From Heart cancer dataset, we have taken a specific instance
where the patient has a heart disease. Figure 11 shows this instance.
Fig. 11. An input to a Counterfactual – A specific instance where the patient has a
heart disease.
From the input presented in Figure 11, We generate 4 different counterfac-
tuals as shown in Figure 12, all of which show us the minimum changes that we
can make to the feature values in order to change the condition of a patient.
The following are the observations regarding the output:
– We cannot change the sex, age or the type of chest-pain (field cp) of a
person suffering from a heart disease. Therefore, we can see that in each of
the counterfactuals, we have kept those features unvaried.
– The 4 different counterfactuals are all different ways of solving one problem,
which is to change the target value from 1 to 0. For example, if we look at
the second counterfactual on the list, we can see that reduction of cholesterol
will lead to decreasing the intensity of the heart disease. Among several other14 Devam Dave, Het Naik, Smiti Singhal, and Pankesh Patel
Fig. 12. Different counterfactuals outputs of Counterfactual Explainer.
changes, it also shows that upon performing the Thallium test on the heart,
there should be normal results and no defects.
– A recurring theme in all counterfactuals is the reduction of ca from 2 to 0.
ca signifies the number of blocked vessels of heart. ca is the most important
feature contributing to having a heart disease. So, from the results, we can
say that the most important factor in changing the condition is to reduce
the number of blocked vessels by using methods like angioplasty.
5.3 Counterfactuals with Prototypes
It simply refers to the explanations that are described on the basis of a proto-
type i.e. a sample which is representative of the instances belonging to a class.
Counterfactuals guided by prototypes is an advanced and more accurate version
of counterfactuals [4]. The counterfactuals guided by prototypes method works
on black-box models.This method is a model agnostic approach to interpret re-
sults using the prototypes of classes of target variable and is faster compared to
the counterfactuals. It is much faster than counterfactual because of its proto-
type approach which speeds up the search process significantly by directing the
counterfactual to the prototype of a particular class.
X = x_test[target].reshape((1,) + x_test[target].shape)
cf = CounterFactualProto(nn, shape, use_kdtree=True,
theta=10., max_iterations=1000,
feature_range=(x_train.min(axis=0), x_train.max(axis=0)),
c_init=1., c_steps=10)
cf.fit(x_train)
explanation = cf.explain(X)
print(’Original prediction:
{}’.format(explanation.orig_class))
print(’Counterfactual prediction:
{}’.format(explanation.cf[’class’]))
orig = X * sigma + mu
counterfactual = explanation.cf[’X’] * sigma + mu
delta = counterfactual - orig
for i, f in enumerate(feature_names):
if np.abs(delta[0][i]) > 1e-4:
print(’{}: {}’.format(f, delta[0][i]))Explainable AI meets Healthcare: A Study on Heart Disease Dataset 15
Fig. 13. Example : An output of Counterfactual guided by prototype on heart disease
dataset
Here we take an instance where the condition of the patient is of having a
heart disease. We now generate a counterfactual guided by prototype to see the
smallest changes in the features this particular patient should make so that he
can increase his/ her chances of being not diagnosed with a heart disease.
Figure 13 shows that the following changes should be made to flip the out-
come. The chest pain type should be decreased by —floor(-0.813)— = 1 i.e the
chest pain should belong to the recognizable (symptomatic) category. Also, the
resting blood pressure should be low. The maximum heart rate of the person
should be higher by around 8, which can be done by regular exercise. Old peak
value should be lowered by having a dash diet. ca should also be reduced by
—floor(-1.89)— = 2 by detecting and removing the blockage using angioplasty
or doing a bypass surgery if needed.
5.4 Contrastive Explanation Methods
Contrastive Explanation Method, abbreviated as CEM, is a XAI Method which
can give local explanations for a black box model. CEM defines explanations
for classification models by providing insight on preferable along with unwanted
features i.e. Pertinent Positives (PP) and Pertinent Negatives (PN). It is the first
method that gives the explanations of both what should be minimally present
and what should be necessarily absent from the instance to be explained in order
to maintain the original prediction class. In other words, the method finds the
features like important pixels in an image that should be sufficiently present to
predict the same class as on the original instance as well as identifies a minimal
set of features that is enough to differentiate it from the nearest different class.
The 2 kinds of explanations can be defined as follows [1]:
Pertinent Positives (PP): The Pertinent Positives explanation finds the
features that are necessary for the model to predict the same output class as the
predicted class. For example, this includes the important pixels of an image, the
features having a high feature weight, etc. PP works similarly to Anchors.
Pertinent Negatives (PN): The Pertinent Negatives explanation finds the
features that should be minimally and sufficiently absent from an instance whilst
maintaining the original output class. PN works similarly to Counterfactuals.16 Devam Dave, Het Naik, Smiti Singhal, and Pankesh Patel
Using CEM, we can improve the accuracy of the machine learning model by
looking at cases of mis-classified instances and then working on them using the
explanations provided by CEM.
Pertinent Negative. Figure 14 generates contrastive explanations in terms of
Pertinent Negative. The original prediction was 0 which is changed to 1 after
applying CEM with pertinent negative. Pertinent Negative explanations work
similarly to the counterfactual explanations, and we can see it clearly as the
pertinent negative method pushes the prediction to get a prediction different
from the original prediction which is 0 to 1 in this case.
idx = 1
X = x_test[idx].reshape((1,) + x_test[idx].shape)
mode = ’PN’
shape = (1,) + x_train.shape[1:]
feature_range = (x_train.min(axis=0).reshape(shape)-.1,
x_train.max(axis=0).reshape(shape)+.1)
lr = load_model(’nn_heart.h5’)
cem = CEM(lr, mode, shape, kappa=kappa, beta=beta,
feature_range=feature_range, max_iterations=max_iterations,
c_init=c_init, c_steps=c_steps, learning_rate_init=lr_init,
clip=clip)
cem.fit(x_train, no_info_type=’median’)
explanation = cem.explain(X, verbose=False)
print(’Feature names: {}’.format(feature_names))
print(’Original instance: {}’.format(explanation.X))
print(’Predicted class: {}’.format([explanation.X_pred]))
print(’Pertinent negative: {}’.format(explanation.PN))
print(’Predicted class: {}’.format([explanation.PN_pred]))
Fig. 14. Pertinent Negative Explanations generated by CEM on heart disease dataset.
The CEM values in the array which are different from the original one change
the prediction class. Some of them are cp, ca, thal. Thus, it can be concluded
that changes in these features should necessarily be absent to retain the original
prediction as 0 as they are responsible for flipping the prediction class.
Pertinent Positive. Generating CEM explanations in the form of PP shows us
the feature values that should be compulsorily present in order to get the same
original class (0) as predicted class, as shown in the example (See Figure 15) .Explainable AI meets Healthcare: A Study on Heart Disease Dataset 17
mode = ’PP’
lr = load_model(’nn_heart.h5’)
cem = CEM(lr, mode, shape, kappa=kappa, beta=beta,
feature_range=feature_range, max_iterations=max_iterations,
c_init=c_init, c_steps=c_steps, learning_rate_init=lr_init,
clip=clip)
cem.fit(x_train, no_info_type=’median’)
explanation = cem.explain(X, verbose=False)
print(’Original instance: {}’.format(explanation.X))
print(’Predicted class: {}’.format([explanation.X_pred]))
print(’Pertinent positive: {}’.format(explanation.PP))
print(’Predicted class: {}’.format([explanation.PP_pred]))
Fig. 15. Pertinent Positive Explanations generated by CEM on heart disease dataset.
The above result signifies that the predicted class remains the same on apply-
ing PP. The CEM values generated are close to 0 as they are the most minimal
values to be present for the prediction of the particular class i.e. these should be
compulsorily and minimally present in order to get the same original class 0 as
predicted class.
5.5 Kernel Shapley
The goal of SHAP is to calculate the impact of every feature on the prediction [2].
Compared to Shapley values, Kernel SHAP gives more computationally efficient
and more accurate approximation in higher dimensions. In Kernel SHAP, in-
stead of retraining models with different permutations of features to compute
the importance of each, we can use the full model that is already trained, and
replace ”missing features” with ”samples from the data” that are estimated from
a formula. This means that we equate ”absent feature value” with ”feature value
replaced by random feature value from data”. Now, this changed feature space
is fitted to the linear model and the coefficients of this model act as Shapley
values.
It has the capability of both local and global interpretations i.e. it is able to
compute the importance of each feature on the prediction for an individual in-
stance and for the overall model as well [5]. The SHAP values are consistent and18 Devam Dave, Het Naik, Smiti Singhal, and Pankesh Patel
reliable because if a model changes so that the marginal contribution of a feature
value (which means percentage out of the total) increases or stays the same (re-
gardless of other features), they increase or remain the same respectively. Thus,
these values are mathematically more accurate and require fewer evaluations.
However, it assumes the features to be independent which may sometimes give
wrong results.
pred = classifier.predict_proba
lr_explainer = KernelShap(pred, link=’logit’)
lr_explainer.fit(X_train_norm)
Local explanation. An example of local explanation using heart disease dataset
is given in Figure 16.
instance = X_test_norm[target][None, :]
pred = classifier.predict(instance)
class_idx = pred.item()
shap.force_plot(lr_explanation.expected_value[class_idx],
lr_explanation.shap_values[class_idx][target,:],
X_test_norm[target][None, :],
features_list)
Fig. 16. An example of local explanation using heart disease dataset.
The base value is the average of all output values of the model on the training
data(here : -0.3148). Pink values drag/push the prediction towards 1 (pushes
the prediction higher i.e. towards having heart disease) and the blue towards 0
(pushes the prediction lower i.e. towards no disease). The magnitude of influence
is determined by the length of the features on the horizontal line. The value
shown corresponding to the feature are the values of feature at the particular
index(eg. 2.583 for ca). Here, the highest influence is of ca for increasing the
prediction value and of sex for decreasing the value.
Global explanation. Figure 17 plots visualizes the impact of features on the
prediction class 1.
shap.summary_plot(lr_explanation.shap_values[1],
X_test_norm, features_list)Explainable AI meets Healthcare: A Study on Heart Disease Dataset 19
Fig. 17. An example of global explanation using heart disease dataset.
The features are arranged such that the highest influence is of the topmost
feature. Thus, ca is the feature that influences the prediction the most followed
by thal and so on. The colour shades show the direction in which the feature
impacts the prediction. For example, higher shap values of ca are shown in red
colour which means high feature value. The higher the value of ca, the higher is
the SHAP value i.e. more towards 1 . High value of ca indicates more chances
of Heart Disease. However, it is the opposite for some features: High thalach
will indicate no heart disease.
5.6 Integrated Gradients
Integrated Gradients, also known as Path-Integrated Gradients or Axiomatic
Attribution for Deep Networks is an XAI technique that gives an importance
value to each feature of the input using the gradients of the model output [8].
It is a local method that helps explain each individual prediction. Integrated
Gradients is a method that is simple to implement and is applicable for various
datasets such as text datasets, image datasets and structured data as well as
models like regression and classification models. This method shows us the spe-
cific attributions of the feature inputs that are positive attributions and negative
attributions.
– Positive attributions: Positive attributions are attributions that con-
tributed or influenced the model to make the decision it did. For example,20 Devam Dave, Het Naik, Smiti Singhal, and Pankesh Patel
in the Fashion MNIST dataset, if we take the image of a shoe, then the pos-
itive attributions are the pixels of the image which make a positive influence
to the model predicting that it is a shoe. It can be various specific pixels
showing some unique features of a shoe such as laces, sole, etc.
– Negative attributions: Negative attributions are attributions that con-
tributed or influenced the model against making the decision that it eventu-
ally did. For example, in the Fashion MNIST dataset, if we take the image
of a shoe, then the negative attributions are the pixels of the image which
go against the model predicting it as a shoe. For example, the sole of a shoe
might be mixed as a flip flop. This would make the model think that the
clothing item in the image is not a shoe.
This method has various applications and is primarily used to check where the
model is making mistakes so that amendments can be made in order to improve
the accuracy of the model. In this way, it can help a developer in debugging as
well as makes the model more transparent for the users.
An example on heart disease dataset. Let us understand it more using an
example using MNIST dataset, as presented in positive attributions and negative
attributions. We have taken an example on the dataset of Fashion MNIST, which
consists of 70,000 grayscale 28x28 images of different clothing items. The label
consists of 10 classes, which denotes different kinds of clothing items such as
shirt, hoodies, shoes and jeans.
n_steps = 50
method = "gausslegendre"
ig = IntegratedGradients(model,
n_steps=n_steps,
method=method)
nb_samples = 10
X_test_sample = X_test[:nb_samples]
predictions = model(X_test_sample).numpy().argmax(axis=1)
explanation = ig.explain(X_test_sample,
baselines=None,
target=predictions)
explanation.meta
explanation.data.keys()
attrs = explanation.attributions
fig, ax = plt.subplots(nrows=2, ncols=4, figsize=(10, 7))
image_ids = [9, 4]
cmap_bound = np.abs(attrs[[9, 4]]).max()
for row, image_id in enumerate(image_ids):
ax[row, 0].imshow(X_test[image_id].squeeze(), cmap=’gray’)
ax[row, 0].set_title(f’Prediction:
{predictions[image_id]}’)Explainable AI meets Healthcare: A Study on Heart Disease Dataset 21
attr = attrs[image_id]
im = ax[row, 1].imshow(attr.squeeze(),
vmin=-cmap_bound, vmax=cmap_bound, cmap=’PiYG’)
attr_pos = attr.clip(0, 1)
im_pos = ax[row, 2].imshow(attr_pos.squeeze(),
vmin=-cmap_bound, vmax=cmap_bound, cmap=’PiYG’)
attr_neg = attr.clip(-1, 0)
im_neg = ax[row, 3].imshow(attr_neg.squeeze(),
vmin=-cmap_bound, vmax=cmap_bound, cmap=’PiYG’)
ax[0, 1].set_title(’Attributions’);
ax[0, 2].set_title(’Positive attributions’);
ax[0, 3].set_title(’Negative attributions’);
for ax in fig.axes:
ax.axis(’off’)
fig.colorbar(im, cax=fig.add_axes([0.95, 0.25, 0.03, 0.5]));
Fig. 18. An example of Integrated Gradients using Fashion MNIST dataset.
The first example (top part of Figure 18) is is an image of a shoe. The attri-
butions section shows a melange of positive and negative attributions together.
As we can see from the bar on the right side, green signifies positive attributions
and purple signifies negative attributions. The shoe is unique compared to other
clothing items, and hence, it has a lot more positive attributes than negatives.22 Devam Dave, Het Naik, Smiti Singhal, and Pankesh Patel
The lining, collar and back part of the shoe are the main pixels that influence the
decision of the model. On the other hand, the negative attributions are negligible
for this particular instance. The second example (bottom part of Figure 18)
is an image of a shirt where there is an equal number of positive and negative
attributions. The pixels around the collar and the sleeves are the biggest positive
attributions. However, the middle portion of the shirt can be mistaken to be a
part of a pair of jeans or trousers. Therefore, due to this ambiguity, they are
the negative attributions for the prediction. All in all, we can say that when the
positive attributions outweigh the negative attributions, the model makes the
correct prediction.
6 Discussion
In this paper, we have talked about different interpretability techniques. The
aim is to enlighten practitioners on the understandability and interpretability of
explainable AI systems using a variety of techniques available which can be very
advantageous in the health-care domain. Medical diagnosis model is responsible
for human life and we need to be confident enough to treat a patient as instructed
by a black-box model. Our paper contains examples based on the heart disease
dataset and elucidates on how the explainability techniques should be preferred
to create trustworthiness while using deep learning systems in healthcare.
We have discussed the most popular feature based techniques LIME and
SHAP which are very similar to each other in purpose but have very different
approaches. Unlike LIME, which is only capable of local explanations, SHAP
can explain both globally and locally. Multiple types of plots that explain the
dataset globally are drawn using the dataset which provide information about
relationships between the features and their importance. In a later section, a
similar technique Kernel Shapley is discussed which is mathematically better
and gives results in fewer evaluations. We then propose and discuss the different
example based techniques namely Anchors, Counterfactuals, Integrated gradi-
ents, Contrastive Explanation Method, Kernel Shapley that play an integral role
in revealing the black box nature for model transparency and accountability. An-
chors, based on If-then rules, are better than LIME and SHAP in terms of gen-
eralisability and computation cost respectively. Counterfactual mainly presents
the what-if explanations and its improved faster version Counterfactual with
Prototype uses the prototypes of classes of target variable for these explana-
tions. While, counterfactuals say how the features should change to change the
target variable, CEM does the opposite and talks about what should necessarily
be present to prevent the prediction to flip. CEM is a unique technique that
provides Pertinent Positive - minimally present and Pertinent Negative - com-
pulsorily absent features for original prediction class. The techniques so far only
inform about how the features present give rise to the prediction and say nothing
about the features that influenced to decide against the predicted class. This is
what Integrated Gradients implement. Along with the positive attributions that
help to make a prediction, it is the only feature which mentions the features thatExplainable AI meets Healthcare: A Study on Heart Disease Dataset 23
lead the model to believe a different prediction, known as negative attributions.
Thus, the most important benefit learnt from the study of these techniques is
that the approaches all speak how various features are responsible for the model’s
outcomes. They are intuitive and thus assist in the process of learning what the
black box model thinks and to be able to explain the behaviour of the model.
References
1. Dhurandhar, A., Chen, P.Y., Luss, R., Tu, C.C., Ting, P., Shanmugam, K., Das,
P.: Explanations based on the missing: Towards contrastive explanations with per-
tinent negatives. In: Advances in Neural Information Processing Systems. pp. 592–
603 (2018)
2. Garcı́a, M.V., Aznarte, J.L.: Shapley additive explanations for no2 forecasting.
Ecological Informatics 56, 101039 (2020)
3. Jiang, F., Jiang, Y., Zhi, H., Dong, Y., Li, H., Ma, S., Wang, Y., Dong, Q., Shen,
H., Wang, Y.: Artificial intelligence in healthcare: past, present and future. Stroke
and Vascular Neurology 2(4), 230–243 (2017). https://doi.org/10.1136/svn-2017-
000101, https://svn.bmj.com/content/2/4/230
4. Looveren, A.V., Klaise, J.: Interpretable counterfactual explanations guided by
prototypes (2020)
5. Lundberg, S.M., Lee, S.I.: A unified approach to interpreting model predictions.
In: Advances in neural information processing systems. pp. 4765–4774 (2017)
6. Pawar, U., O’shea, D., Rea, S., O’Reilly, R.: Explainable ai in health-
care. In: ‘Reasonable Explainability’ for Regulating AI in Health (06 2020).
https://doi.org/10.1109/CyberSA49311.2020.9139655
7. Ribeiro, M.T., Singh, S., Guestrin, C.: Anchors: High-precision model-agnostic
explanations. In: AAAI Conference on Artificial Intelligence (AAAI) (2018)
8. Sundararajan, M., Taly, A., Yan, Q.: Axiomatic attribution for deep networks.
arXiv preprint arXiv:1703.01365 (2017)
9. Thampi, A.: Interpretable AI, Building explainable machine learning systems.
Manning Publications, USA (2020)
10. Wachter, S., Mittelstadt, B., Russell, C.: Counterfactual explanations without
opening the black box: Automated decisions and the gdpr (2018)You can also read