Investor Presentation - March 2021 - American Assets Trust
←
→
Page content transcription
If your browser does not render page correctly, please read the page content below

Investor Presentation
March 2021

Forward‐Looking Statements
This presentation contains forward‐looking statements within the meaning of Section 27A of the Securities Act of 1933, as amended, and Section 21E of the Securities Exchange Act of
1934, as amended. Such forward‐looking statements relate to, without limitation, our future economic performance, plans and objectives for future operations, and projections of
revenue, net operating income, funds from operations, discounts to net asset values and other selected financial information. Forward looking statements can be identified by the use
of words such as “potential,“ "may,“ "will," "plan,” "could," "should,“ "expect," "anticipate,“ "outlook," "estimate,“ "projected," "target," "continue," "intend,“ "believe," "seek,"' or
"assume," and variations of such words and similar expressions are intended to identify such forward‐looking statements. Future events and actual results, financial and otherwise,
may differ materially from the results discussed in the forward‐looking statements. You should not rely on forward‐looking statements as predictions of future events. Forward‐looking
statements involve numerous risks and uncertainties that could significantly affect anticipated results in the future and, accordingly, such results may differ materially from those
expressed in any forward‐looking statement made by us. These risks and uncertainties include, but are not limited to: adverse economic and real estate developments in Northern and
Southern California, Hawaii, the Pacific Northwest and Texas; decreased rental rates or increased tenant incentives and vacancy rates; defaults on, early terminations of, or non‐
renewal of leases by tenants; increased interest rates and operating costs; failure to generate sufficient cash flows to service our outstanding indebtedness; difficulties in identifying
properties to acquire and completing acquisitions; failure to successfully integrate pending and recent acquisitions; failure to successfully operate acquired properties and operations;
failure to maintain our status as a REIT under the Internal Revenue Code of 1986, as amended; possible adverse changes in laws and regulations; environmental uncertainties; risks
related to natural disasters; lack or insufficient amount of insurance; inability to successfully expand into new markets or submarkets; risks associated with property development;
conflicts of interest with our officers or directors; changes in real estate and zoning laws and increases in real property tax rates; and the consequences of any possible future terrorist
attacks. Currently, one of the most significant risk factors, is the potential adverse effect of the current COVID‐19 pandemic on the financial condition, results of operations, cash flows
and performance of us, our tenants and guests, the real estate market and the global economy and financial markets. The extent to which COVID‐19 impacts us, our tenants and guests
will depend on future developments, which are highly uncertain and cannot be predicted with confidence, including the scope, severity and duration of the pandemic, the actions taken
to contain the pandemic or mitigate its impact, and the direct and indirect economic effects of the pandemic and containment measures, among others. You are cautioned that the
information contained herein speaks only as of the date hereof and we assume no obligation to update any forward‐looking information, whether as a result of new information, future
events or otherwise. The risks described above are not exhaustive, and additional factors could adversely affect our business and financial performance, including those discussed
under the caption "Risk Factors" in our Annual Report on Form 10‐K and other risks described in documents subsequently filed by the company from time to time with the Securities
and Exchange Commission. In this presentation, we rely on and refer to information and statistical data regarding the industry and the sectors in which we operate. This information
and statistical data is based on information obtained from various third‐party sources, and, in some cases, on our own internal estimates. We believe that these sources and estimates
are reliable, but have not independently verified them and cannot guarantee their accuracy or completeness.

This presentation includes certain non‐GAAP financial measures that the company considers meaningful measures of financial performance during the COVID‐19 pandemic.

  2
Company Overview and Strategy

3
American Assets Trust
12.6% RETURN 8.9% CAGR 4.5% CAGR 10.4% CAGR
ANNUALIZED TSR (IPO‐12/31/2019)(1) FFO PER SHARE (2011–2019)(1) DIVIDENDS (2011–2019)(1) NET ASSET VALUE (2011–2019)(2)
6.5% RETURN 6.1% CAGR 2.5% CAGR 9.3% CAGR
ANNUALIZED TSR (IPO‐12/31/2020)(1) FFO PER SHARE (2011–2020)(1) DIVIDENDS (2011–2020)(1) NET ASSET VALUE (2011–2020)(2)
EXECUTIVE MANAGEMENT TEAM
HISTORY OF SUCCESS IRREPLACEABLE PORTFOLIO
AAT has been in business for 50 plus Premier costal markets on the West Coast.
years. High barrier‐to‐entry markets and infill
Annualized TSR of 12.6% since IPO.(1) locations.
Senior management team with significant Strong demographics‐high ERNEST RADY ROBERT BARTON ADAM WYLL
experience working together. population density and CHAIRMAN, PRESIDENT AND EXECUTIVE VICE PRESIDENT EXECUTIVE VICE PRESIDENT
Over 12 million square feet household income. CHIEF EXECUTIVE OFFICER AND CHIEF FINANCIAL OFFICER AND CHIEF OPERATING OFFICER
of acquisitions and
development.
DISCIPLINED FINANCIAL
BEST‐IN‐CLASS
STRATEGY & BALANCE SHEET
OPERATING PLATFORM
STRENGTH JERRY GAMMIERI CHRIS SULLIVAN STEVE CENTER
VICE PRESIDENT OF VICE PRESIDENT OF VICE PRESIDENT OF
CONSTRUCTION RETAIL PROPERTIES OFFICE PROPERTIES
Vertically integrated with significant Well staggered debt maturity schedule.
experience in core markets. Continued focus to achieve a Net
Expertise in all facets of the real estate Debt/EBITDA ratio of 5.5x or lower.
industry across property types.
WADE LANGE ABIGAIL REX
(1) Source: Bloomberg. Total Shareholder Return (TSR) assumes dividends are reinvested in security through December 31, 2019 and December 31, 2020. AAT IPO on January 13, 2011. VICE PRESIDENT OF DIRECTOR, MULTIFAMILY
PORTLAND AND BELLEVUE SAN DIEGO
(2) AAT’s NAV CAGR estimate is based on both management’s knowledge of its core markets and published pricing data since IPO. The NAV is kept flat at $51.50 in 2020.
4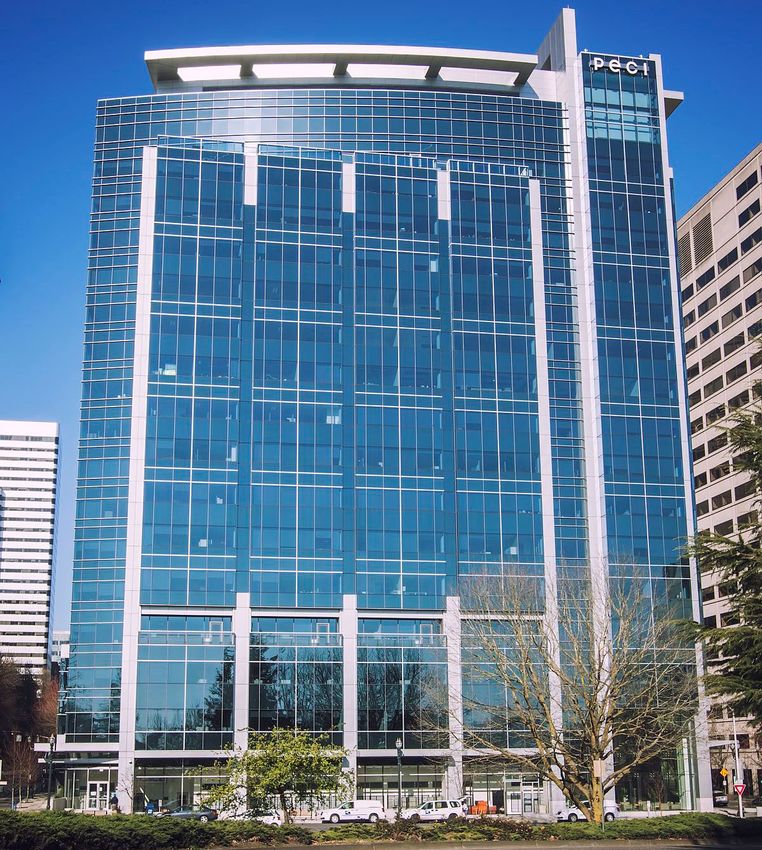
Portfolio Composition
                                                                                                                                           SQUARE FEET (000’S)(1)                                UNITS(1)

                                                                                             REGION          MARKET              OFFICE    RETAIL      MIXED USE     TOTAL           MULTIFAMILY            HOTEL
          BELLEVUE

      PORTLAND                                                                               S. CALIFORNIA   SAN DIEGO            1,550    1,322             ‐       2,872                 1,455              ‐

                                                                                             OREGON          PORTLAND             876        44              ‐        920                  657                ‐

                                                                                             N. CALIFORNIA   MONTEREY                 ‐     673              ‐        673                    ‐                ‐

                                                                                             TEXAS           SAN ANTONIO              ‐     588              ‐        588                    ‐                ‐

                                                                                             N. CALIFORNIA   SAN FRANCISCO        523        35              ‐        558                    ‐                ‐
 SAN FRANCISCO                                                                               HAWAII          OAHU                     ‐     430              97       527                    ‐               369
      MONTEREY
                                                                                             WASHINGTON      BELLEVUE             498         ‐              ‐        498                    ‐                ‐

                                                                                            TOTAL                                 3,447    3,092             97      6,636                 2,112             369
                 SAN DIEGO
                                                                                                                                             ANNUALIZED BASE RENT (ABR)(2)(3)

                                                                                                                        DIVERSIFICATION BY SEGMENT                          DIVERSIFICATION BY REGION

                      OAHU / HONOLULU                                    SAN ANTONIO
                                                                                                                                                                                     TX
                                                                                                                                                                             HAWAII 4.3%
                                                                                                                        MULTIFAMILY                                           7.8%
                                                                                                                          16.8%
                                                                                                                                                                      WA
                                                                                                                                                                      8.1%

                                                                                                                                                                                                 S. CALIFORNIA
                                                                                                                                                                    OREGON
(1)   As of 12/31/2020. As reported in AAT’s supplemental information disclosure package as                                                         OFFICE                                           50.6%
                                                                                                                                                                     12.7%
      furnished to the SEC and available on AAT’s website.                                                       RETAIL                             55.9%
(2)   Annualized base rent (ABR) is calculated by multiplying base rental payments (defined as cash              27.3%
      base rents (before abatements)) under commenced leases for the month ended December 31,
      2020 by 12. In the case of triple net or modified gross leases, annualized base rent does not                                                                     N. CALIFORNIA
      include tenant reimbursements for real estate taxes, insurance, common area or other                                                                                  16.4%
      operating expenses. We caution investors that other equity REITs may not calculate annualized
      base rent as we do, and, accordingly, our annualized base rent data may not be comparable to
      such other REITs’ annualized base rent data.
(3)   Retail data includes WBW Retail. Hawaii data excludes Embassy Suites Hotel.

      5
4Q‐2020 Billing/Collection Activity
Collections
Approximately, 92.1% of 4Q‐2020 recurring rents have been collected to date(1)
Rent Deferrals
As of December 31, 2020, we have entered into deferral agreements for $8.6 million of recurring rents
related to the second, third, and fourth quarters of 2020.
(UNAUDITED, AMOUNTS IN THOUSANDS) (1) (2)
COLLECTED TO DATE COVID‐19 ADJUSTMENTS OUTSTANDING
(1)
4Q‐2020 AS OF 2/6/2021 BILLED $ % $ % $ %
RETAIL $25,263 $22,300 88.3% $1,559 6.2% $1,404 5.6%
WAIKIKI BEACH WALK ‐ RETAIL $3,505 $1,237 35.3% $178 5.1% $2,089 59.6%
TOTAL RETAIL $28,768 $23,537 81.8% $1,738 6.0% $3,493 12.1%
OFFICE $37,436 $37,003 98.8% $338 0.9% $95 0.3%
MULTIFAMILY SAN DIEGO $10,693 $10,290 96.2% $404 3.8%
HASSALO $3,065 $2,812 91.8% $253 8.2%
TOTAL MULTIFAMILY $13,758 $13,102 95.2% $656 4.8%
TOTAL 4Q‐2020 AS OF 2/6/2021 $79,962 $73,642 92.1% $2,076 2.6% $4,245 5.3%
(1) Billed recurring rents are primarily composed of base rent and cost reimbursements. Collected data as of February 6, 2021.
(2) Includes rent deferrals and other monetary lease concessions.
6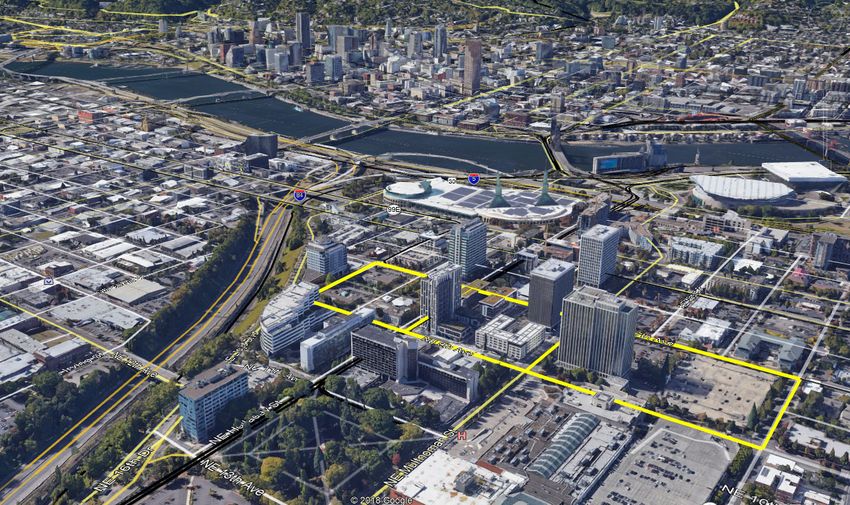
4Q‐2020 Retail and Office Billed
                                         4Q‐2020 RETAIL BILLED(1)                                                                                               4Q‐2020 OFFICE BILLED(1)

                                                                           SALON/SPA 4.2%
                                                         OTHER
                                                                                     MOVIE THEATRE 3.8%                                                                                DENTAL/
                                                          6.1%
                                          OFF‐PRICE                                                                                                                   LEGAL SERVICES   MEDICAL
                                            6.3%                                            GYM/DANCE 3.1%                                                                7.6%          6.1%     OTHER
                                                                                                                                                                                                  4.9%
                                                                                               MEDICAL 1.6%                                                                                              GSA
                                                                                                                                                                                                         4.0%
                                                                                                                                                  BUSINESS SERVICES
                          HOME FURNISHINGS                                                                                                             11.8%
                                9.7%

                                                                                 GROCERY & DRUG
                                                                                     10.1%

                     RESTAURANT/QSR
                          15.5%                                                HARDWARE STORES
                                                                                    6.7%
                                                                                                                                                                                                      TECH/LIFE
                                                                                                                                                BANKING AND                                       SCIENCES/PHARMA
                                                                                     OTHER                                                       FINANCIAL                                              34.7%
                                                                                   ESSENTIAL                                                       30.7%
                                                                                      5.1%

                                             APPAREL
                                              21.0%                                      COMMUNICATIONS
                                                                                           & HOME OFFICE
                                                                                               4.5%
                                                                   BANK/CREDIT UNION
                                                                         2.4%

      (UNAUDITED, AMOUNTS IN THOUSANDS)                                                               4Q‐2020(1)

          RETAIL TENANTS                       % OF RETAIL BILLED(1)            BILLED             COLLECTED              % COLLECTED

          ESSENTIAL    TENANTS(2)                       28.7%                   $8,254                $8,249                   99.9%
          NON‐ESSENTIAL TENANTS                         71.3%                  $20,514               $15,288                   74.5%

          TOTAL RETAIL BILLED                          100.0%                  $28,768               $23,537                   81.8%

(1)    Billed recurring rents are primarily composed of base rent and cost reimbursements. Retail data includes WBW Retail. Collected data as of February 6, 2021.
(2)    Essential Tenants per the Department of Homeland Security.

      7
4Q‐2020 Retail Collections by Category
                                                                                                                                 4Q‐2020 RETAIL RENT COLLECTED TO DATE BY CATEGORY(1)

                                                                                                                                   HARDWARE STORES                                           100.0%

                           4Q‐2020 RETAIL RENT COLLECTED TO DATE(1)(2)                                                              GROCERY & DRUG                                           100.0%

                                                   COVID‐19                                                                       BANK/CREDIT UNION                                          100.0%
                                                     ADJ.
                                                     6.0%
                                                                                                                     COMMUNICATIONS & HOME OFFICE                                            100.0%
                                  OUTSTANDING
                                     12.1%
                                                                                                                                     OTHER ESSENTIAL                                         99.7%

                                                                                                                                            MEDICAL                                          99.4%

                                                                                                                                                       (3)
                                                                                                                                              OTHER                                      93.3%

                                                                                                                                           OFF‐PRICE                                     91.9%

                                                                                                                                   HOME FURNISHINGS                                  85.8%
                                                                         COLLECTED
                                                                           81.8%                                                    RESTAURANT/QSR                                  84.0%

                                                                                                                                          SALON/SPA                              77.0%

                                                                                                                                            APPAREL                      62.7%

                                                                                                                                         GYM/DANCE                   53.8%
(1)       Billed recurring rents are primarily composed of base rent and cost reimbursements. Retail data includes WBW Retail.
          Collected data as of February 6, 2021.                                                                                                                     ESSENTIAL TENANTS
(2)       COVID‐19 Adjustments includes rent deferrals and other monetary lease concessions.                                          MOVIE THEATRE          17.6%
(3)       Other includes Dry Cleaners, Tailors, Cobblers, Churches, Book Stores, Realtors, Insurance Agents, Tax Preparers,                                          NON‐ESSENTIAL TENANTS
          Wellness Products and Electronics.

      8
January‐2021 Billing/Collection Activity
Collections
Approximately, 91.7% of January‐2021 recurring rents have been collected to date(1)
(UNAUDITED, AMOUNTS IN THOUSANDS) (1) (2)
COLLECTED TO DATE COVID‐19 ADJUSTMENTS OUTSTANDING
(1)
JANUARY‐2021 AS OF 2/19/2021 BILLED $ % $ % $ %
RETAIL $8,250 $7,194 87.2% $355 4.3% $701 8.5%
WAIKIKI BEACH WALK ‐ RETAIL $1,226 $508 41.4% $17 1.4% $702 57.2%
TOTAL RETAIL $9,476 $7,702 81.3% $372 3.9% $1,403 14.8%
OFFICE $12,434 $12,249 98.5% $102 0.8% $83 0.7%
MULTIFAMILY SAN DIEGO $3,599 $3,470 96.4% $129 3.6%
HASSALO $1,011 $909 89.9% $102 10.1%
TOTAL MULTIFAMILY $4,610 $4,379 95.0% $231 5.0%
TOTAL JANUARY‐2021 AS OF 2/19/2021 $26,520 $24,330 91.7% $474 1.8% $1,717 6.5%
(1) Billed recurring rents are primarily composed of base rent and cost reimbursements. Collected data as of February 19, 2021.
(2) Includes rent deferrals and other monetary lease concessions.
9
NOI Growth Potential (2019A – 2022E)
($ IN MILLIONS) 2021 2022
2019 NET CHANGE 2020 NET CHANGE GROWTH NET CHANGE GROWTH
ACTUAL AMOUNT % ACTUAL AMOUNT % POTENTIAL AMOUNT % POTENTIAL
CASH NOI
OFFICE $87.3 $19.0 22% $106.4 $10.6 10% $117.0 $13.0 11% $130.0
RETAIL 69.9 (12.1) (17%) 57.8 (1.8) (3%) 56.0 7.0 13% $63.0
MULTIFAMILY 30.3 (1.7) (6%) 29 1.4 5% 30.0 1.0 3% $31.0
MIXED‐USE 24.6 (20.4) (83%) 4.2 (2.2) (52%) 2.0 18.0 900% $20.0
TOTAL CASH NOI(1) $212.1 ($15.2) (7%) $196.9 $8.1 4% $205.0 $39.0 19% $244.0
GAAP ADJUSTMENTS(2) 22.6 3.9 17% 26.5 (10.5) (40%) 16.0 (11.0) (69%) 5.0
NOI $234.8 ($11.3) (5%) $223.5 ($2.5) (1%) $221.0 $28.0 13% $249.0
Note: The company's growth potential excludes any impact from future acquisitions, dispositions, equity issuances or repurchases, future debt financings or repayments. These estimates are forward‐looking and reflect management's view
of current and future market conditions, including certain assumptions with respect to leasing activity, rental rates, occupancy levels and interest rates. Our actual results may differ materially from these estimates.
(1) Summary of year over year changes in Cash NOI:
2020 Actual to 2021 Estimated:
Office: Office Cash NOI is projected to increase approximately $10.6M or 10%, of which approximately $1.0M of revenue is projected to be derived from speculative leases and renewals during the year. The properties
estimated to experience significant increases include La Jolla Commons $3.5M, Landmark $2.5M, Torrey Reserve $1.6M, Torrey Point $1.6M, and the Lloyd District $1.3M.
Retail: Retail Cash NOI is projected to decrease approximately $1.8M or 3% in 2021 as we estimate that the economy will not begin to recover from the COVID‐19 pandemic until the second half of 2021. All lease modifications
negotiated during 2020 and 2021 have been reflected in the forecast. In addition to the projected Cash NOI for 2021, we have taken a reserve of approximately $9.1M based on management's review of all retail leases.
Multifamily: Multifamily Cash NOI is projected to increase approximately $1.4M or 5% for the year as San Diego's Multifamily Cash NOI is expected to increase approximately $1.6M offset by an expected decrease in Portland's
Multifamily Cash NOI of approximately $0.2M for the year.
Mixed use: Mixed‐Use Cash NOI is projected to decrease approximately $2.2M or 52%, Waikiki Beach Walk‐Retail Cash NOI for 2021 is expected to decrease approximately $1.2M and Embassy Suites Cash NOI is expected to
decrease approximately $1.0M as we do not expect that Hawaii's tourism industry will begin recovering from the effects of the pandemic until the second half of 2021.
2021 Estimated to 2022 Estimated (Return to somewhat normalcy):
Office: Office Cash NOI is forecasted to grow approximately $13.0M or 11% in 2022. Of this amount, Cash NOI at Landmark is expected to increase approximately $3.0M as Google will be paying full unabated rent on its lease
beginning in the second half of 2022. Other office properties with estimated significant Cash NOI growth include: Torrey Reserve $3.4M, City Center Bellevue $2.1M, First & Main $1.5M, La Jolla Commons $1.1M and Oregon
Squire 710 Bldg. $0.8M. Included in our Office Cash NOI forecasted growth for 2022 is $7.1M of revenue derived from speculative leasing.
Retail: Retail Cash NOI is expected to grow approximately $7.0M or 13% as we anticipate the economic recovery, that is estimated to begin in the second half of 2021, carries over into 2022 for a full year. The most significant
growth is expected in those properties with movie theatre, gyms and full service restaurants.
Multifamily: The Cash NOI for all Multifamily properties is projected to increase $1.0M or 3.0% in 2022.
Mixed use: Mixed‐Use Cash NOI is projected to increase approximately $18.0M or 900% in 2022. The Cash NOI for Embassy Suites is anticipated to increase approximately $10.0M and Cash NOI for Waikiki Beach‐Retail is
anticipated to increase approximately $8.0M as we expect Hawaii's tourism industry to continue its recovery during 2022.
(2) GAAP Adjustments primarily consists of Straight Line Rent Adjustments and Amortization of Above/Below Market Rents.
10Development Pipeline
W
C
A
B
A LA JOLLA COMMONS I
B LA JOLLA COMMONS II
C LA JOLLA COMMONS III (UNDER DEVELOPMENT ‐ ARTIST RENDERING)
ESTIMATED
PROPERTY TYPE LOCATION OPPORTUNITY
RENTABLE SF
LA JOLLA COMMONS III OFFICE SAN DIEGO, CA 214,000 DEVELOPMENT OF APPROXIMATELY 214,000 SQUARE FEET CLASS A+ OFFICE
WAIKELE CENTER RETAIL HONOLULU, HI 90,000 DEVELOPMENT OF 90,000 SQUARE FEET RETAIL BUILDING
OREGON SQUARE – PHASE 2B OFFICE PORTLAND, OR 385,000 DEVELOPMENT OF BUILD‐TO‐SUIT OFFICE TOWERS AND/OR MIXED‐USE RESIDENTIAL TOWERS
Our portfolio has numerous potential opportunities to create future shareholder value. These opportunities could be subject to government approvals, lender consents, tenant consents, market conditions, availability of debt and/or equity financing, etc. Many of
these opportunities are in their preliminary stages and may not ultimately come to fruition. Square footages and units set forth above are estimates only and ultimately may differ materially from actual square footages and units.
11Development Pipeline (La Jolla Commons III)
LA JOLLA COMMONS III (UNDER DEVELOPMENT ‐ ARTIST RENDERING)
Our portfolio has numerous potential opportunities to create future shareholder value. These opportunities could be subject to government approvals, lender consents, tenant consents, market conditions, availability of debt and/or equity financing, etc. Many of
these opportunities are in their preliminary stages and may not ultimately come to fruition. Square footages and units set forth above are estimates only and ultimately may differ materially from actual square footages and units.
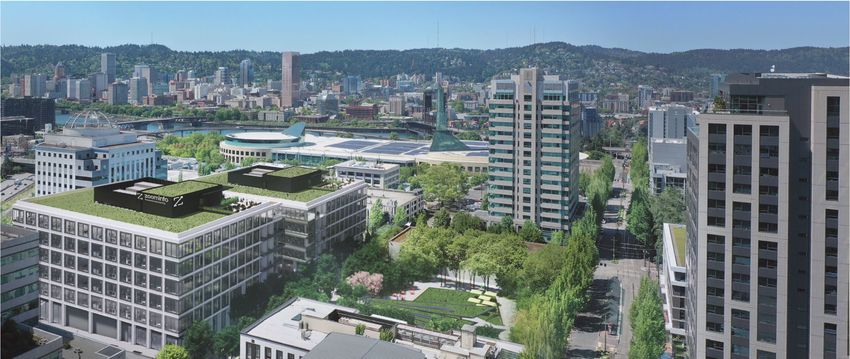
12Development Pipeline – Oregon Square Phase 2B
OREGON SQUARE PHASE 2B – BLOCK 90 & 103 (UNDER DEVELOPMENT ‐ ARTIST RENDERING)
PLANNED TWO‐BUILDING, APPROXIMATELY 385,000 SF OFFICE CAMPUS (EXPANDABLE
TO 555,000 SF).
WHEN BUILT, THE TWO CLASS “A” BUILDINGS WILL HELP FURTHER THE “LIVE, WORK,
PLAY” COMMUNITY IN THE LLOYD NEIGHBORHOOD, PROVIDING SPECTACULAR 360‐
DEGREE VIEWS.
UNDERGROUND PARKING FACILITY WITH 246 STALLS LOCATED BENEATH BOTH BLOCKS;
ADDITIONAL PARKING AVAILABLE BENEATH ADJACENT HASSALO ON EIGHTH.
LARGE FLOOR PLATES WITH 11’ FINISHED CEILINGS AND GLASS LINE ALLOW DEEP
B DAYLIGHTING SOLUTIONS WHILE ALSO ALLOWING GREATER SPACE PLANNING
FLEXIBILITY.
A
EACH FLOOR FEATURES OUTDOOR SPACE AND BOTH BUILDINGS FEATURE ROOFTOP
D
DECKS.
ADJACENT TO HASSALO ON EIGHTH, COMPRISED OF THREE RESIDENTIAL BUILDINGS
WITH STREET‐LEVEL RESTAURANTS, RETAIL, FITNESS, GROCERY AND MEDICAL.
DIRECT ACCESS TO THE NEW CONGRESSMAN EARL BLUMENAUER BICYCLE &
C PEDESTRIAN BRIDGE, PROVIDING ACCESS TO THE CENTRAL EASTSIDE, AND A BLOCK
FROM THE STREETCAR AND MAX LINES.
W CONVENIENTLY LOCATED WITHIN WALKING DISTANCE TO LLOYD CENTER, OREGON
CONVENTION CENTER, AND MODA CENTER, HOME TO THE NBA’S PORTLAND
TRAILBLAZERS.
THE REVITALIZATION OF THE LLOYD COMMUNITY IS IN FULL SWING. BUSINESSES AND
AMENITIES ALIKE ARE FLOCKING TO THE AREA TO BE A PART OF THE BUSTLING
COMMUNITY.
A
B LLOYD CENTER HAS RECENTLY GIVEN THE MALL A FACE LIFT, A STRONG SIGN OF THE
AREA’S GROWING PROSPERITY.
AMONG THE NATIONAL COMPANIES COMMITTED TO LEASING SPACE AT LLOYD CENTER
IS LIVE NATION ENTERTAINMENT, PROVIDING A CONCERT VENUE ON THE EASTSIDE THE
LIKES OF WHICH PORTLAND HAS NEVER EXPERIENCED.
C D
A BLOCK 103
B BLOCK 90
C BUILDING 830 ‐ 100% LEASED TO WEWORK
S D BUILDING 710 – CURRENTLY UNDER REDEVELOPMENT
Our portfolio has numerous potential opportunities to create future shareholder value. These opportunities could be subject to government approvals, lender consents, tenant consents, market conditions, availability of debt and/or equity financing, etc. Many of
these opportunities are in their preliminary stages and may not ultimately come to fruition. Square footages and units set forth above are estimates only and ultimately may differ materially from actual square footages and units.
13Development Pipeline – Oregon Square Phase 2B
A BLOCK 103
B BLOCK 90
W
C BUILDING 830 ‐ 100% LEASED TO WEWORK
D BUILDING 710 – CURRENTLY UNDER REDEVELOPMENT
E HASSALO MULTIFAMILY – ASTER TOWER
B
A
D
E
C
Our portfolio has numerous potential opportunities to create future shareholder value. These opportunities could be subject to government approvals, lender consents, tenant consents, market conditions, availability of debt and/or equity financing, etc. Many of
these opportunities are in their preliminary stages and may not ultimately come to fruition. Square footages and units set forth above are estimates only and ultimately may differ materially from actual square footages and units.
14Lloyd District
Portland, OR
1
2
4
3
BLOCK 90
BLOCK 103 D
A
8
1
1. PEARL DISTRICT
C
2
2. MODA CENTER
B
3
3. KAISER HQ
4
4. OREGON CONVENTION CENTER 5
5
5. DOUBLETREE BY HILTON
6
6. LLOYD CENTER MALL
7
7. HOLLADAY PARK
8
8. BONNEVILLE POWER
7 6
A
A. LLOYD 700
B
B. LLOYD CENTER TOWER
C
C. HASSALO ON EIGHTH MULTIFAMILY
D
D. OREGON SQUARE
15Capital Management and Financial Summary 16
Balance Sheet and Liquidity
Cash Balance as of February 19, 2020: $379 million
As of January 31, 2021, AAT has no debt obligations maturing during the remainder of 2021
WELL–STAGGERED DEBT MATURITY SCHEDULE ($MM)(1)(3) INVESTMENT GRADE CREDIT RATINGS
UNSECURED DEBT (93%)
SECURED DEBT (7%) FITCH BBB (STABLE)
$500
MOODY'S Baa3 (STABLE)
$250
$100(2) $200
$150 $150 STANDARD &
$111 BBB‐ (STABLE)
$100 $100 POOR’S
2021 2022 2023 2024 2025 2026 2027 2028 2029 2030 2031
(1) As of 1/31/2021, unless noted.
(2) $100 million Term Loan A has a stated maturity of January 9, 2022, subject to our option to extend Term Loan A up to two times, with each such extension for a one‐year period.
(3) Debt Maturity Schedule reflects the issuance of $500 million of 3.375% senior unsecured notes due February 1, 2031, the prepayment of the $150 million Senior Guaranteed Notes, Series A, due October 31, 2021, with make‐
whole thereon, and repayment of the $100 million outstanding balance on our unsecured line of credit each in January 2021.
17Appendix 18
Pacific Ridge Apartments
                                                  San Diego, CA

    MISSION BAY

       PACIFIC RIDGE
                        UNIVERSITY OF
       APARTMENTS
NET RENTABLE SF:         SAN DIEGO      419,371                    UNITS:                                533

AVERAGE OCCUPANCY AS OF 9/30/2019:      100.0%                     PERCENTAGE LEASED AS OF 12/31/2020:   93.1%

ABR AS OF 9/30/2019:                    $70.52                     MONTHLY ABR AS OF 12/31/2020:         $3,052

  19
Embassy Suites Waikiki Beach
Honolulu, HI
ROOMS: 369
NET RENTABLE
AVERAGE SF: AS OF 12/31/2020:
OCCUPANCY 46.8% 419,371 UNITS: 533
AVERAGE OCCUPANCY
AVERAGE DAILY AS OF 9/30/2019:
RATE AS OF 12/31/2020: $205.17 100.0% PERCENTAGE LEASED AS OF 9/30/2019: 93.1%
ABR ASAS
REVPAR OFOF9/30/2019:
12/31/2020: $96.05 $70.52 MONTHLY ABR AS OF 9/30/2019: $2,774
20Waikiki Beach Walk
Honolulu, HI
WAIKIKI BEACH WALK IS A HOTEL AND RETAIL MIXED‐USE CENTER PROMINENTLY
SITUATED BETWEEN THE UPSCALE SHOPPING DESTINATION OF KALAKAUA STREET
AND THE BEACHES OF WAIKIKI.
#1 ROY’S IN CHAIN(1)
#2 RUTH’S CHRIS IN CHAIN(1)
#2 YARD HOUSE IN CHAIN(1)
2019 RETAIL SALES PER SF: $1,051
NET RENTABLE SF: 96,707
PERCENTAGE LEASED AS OF 12/31/2020: 89.2%
ABR AS OF 12/31/2020: $109.10
(1) BASED ON 2019 SALES
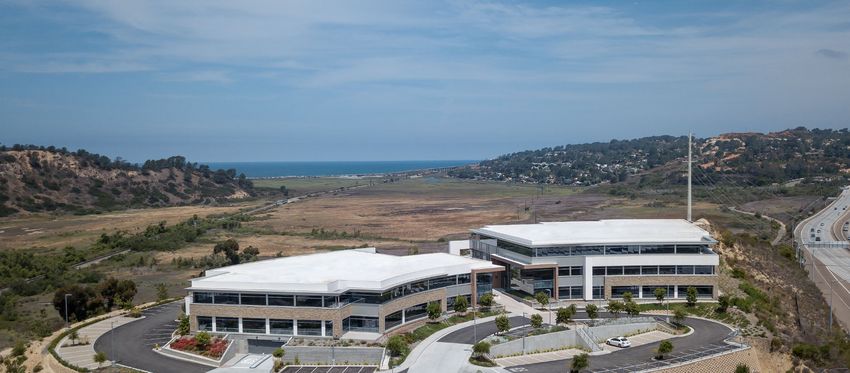
21Torrey Point
San Diego, CA
NET RENTABLE SF: 92,195
PERCENTAGE LEASED AS OF 12/31/2020: 94.6%
ABR AS OF 12/31/2020: $37.22
22First and Main
Portland, OR
NET RENTABLE SF: 360,314
PERCENTAGE LEASED AS OF 12/31/2020: 93.0%
ABR AS OF 12/31/2020: $31.16
23City Center
Bellevue, WA
NET RENTABLE SF: 497,666
PERCENTAGE LEASED AS OF 12/31/2020: 96.5%
ABR AS OF 12/31/2020: $49.31
24Overview of ESG Practices
AAT is a dedicated steward of our community and our environment. Together with our community
partners, we have developed and incorporated into our business practices innovative programs to
promote environmental sustainability, social responsibility and governance.
AAT’s Environmental Sustainability, Social Responsibility and Governance Committee (ESG Committee) is comprised of members
from each department at AAT including Operations, Legal, Human Resources and Finance departments:
TEAM
Committee is responsible for the oversight of AAT’s sustainability efforts across the entire portfolio
Status updates are provided to executive management monthly and BOD quarterly
AAT’s ESG Committee works in collaboration with our property managers and engineers to aggregate data for existing sustainability
practices and develop new sustainability initiatives for implementation:
Created policies and procedures to verify a portfolio property’s practices, track and aggregate data, submit for certifications
and meet critical deadlines
INITIATIVE Contracted with service provider Measurabl, which provides services to collect and aggregate data, report and analyze AAT’s
sustainability data:
Utility usage metrics including energy, water and greenhouse gases
Awards/Certifications
Projects & Audits
Continue our transparency as it relates to our sustainability practice with our annual ESG report and GRESB submission
GOALS To implement additional Environmental, Social and Governance commitments and initiatives
Further align our sustainability practice with industry accepted reporting standards
25Overview of ESG Practices
Some of our sustainable specific accomplishments:
Environmental Sustainability:
• With our actions and operations, in 2020, we increased our overall Global Real Estate Sustainability Benchmark, or GRESB, Score by 14 points.
• We have installed 171 electric vehicle charging (EVC) stations spread across 13 properties. We intend to install additional EVC stations to meet the rising demand.
• At Lloyd Center Tower, in 2020 we purchased renewable energy certificates (RECs) through Pacific Power’s Blue Sky Renewable Energy program equating to
approximately 3.2 million kWh of solar and wind generated electricity.
• Since implementing DocuSign in 2015, we materially reduced our reliance on printing and shipping, thus decreasing our greenhouse gas emissions: to date, we have
saved approximately 28,845 pounds of wood, or 87 trees, 84,933 gallons of water, or 61 washing machines, 67,706 pounds of carbon emission, or 6 cars, and 4,687
pounds of waste, or 78 trash cans.
• Landmark @ One Market, a LEED Gold and ENERGY STAR certified historical office building, originally built in 1917, was the first building in San Francisco to be
certified by the Building Research Establishment Environmental Assessment Method (or BREEAM) USA standard for existing buildings.
• 11 properties in our portfolio (comprising a total of 16 office buildings and 5 multifamily properties) are ENERGY STAR Certified, consisting of approximately 4.9
million square feet, including 1,986 multifamily units, in the aggregate.
• 8 properties in our portfolio (comprising a total of 9 office buildings and 3 multifamily buildings), are Leadership in Energy and Environmental Design (or LEED)
Certified, consisting of approximately 3.3 million square feet, including 657 multifamily units, in the aggregate.
• Continued investment in LED lighting retrofitting projects for interior, exterior and garage lighting, for our properties across all asset types.
• As part of our Hassalo on Eighth design, we developed, installed and operate one of the nation’s first and largest multifamily Natural Organic Recycling Machine (or
NORM) with the capability of treating 100% of the grey and black water created by Hassalo on Eighth and Lloyd 700. It was also designed to reduce the water usage
by 50%, or approximately 7,300,000 gallons of water per year.
Social Responsibility and Governance:
• In partnership with a local San Diego radio station, we created the Tribute to Teachers program, a program that honors local school educators for their outstanding
work inside and outside of the classroom. In 2020, we honored 4 educators, and since the start of the program in 2014, we have honored 32 educators.
• We participate in community awareness programs including sponsoring over 394 blood drives across our properties in 4 different states in 2020.
• We promote and encourage a healthy and balanced living for our employees by providing health and wellness seminars, workshops promoting preventative care and
health screenings.
• AAT and AAT’s employee adheres to various governance guidelines, policies, laws, rules and regulations. Every employee, executive officer and member of our BOD
are required to annually review and recertify their commitment to AAT’s Code of Business Conduct and Ethics Policy and Insider Trading Compliance Program.
• To provide guidance to our tenants, and in addition to Green Lease clauses, we created Tenant Sustainability Guidelines to help tenants form their sustainability
policy.
• To further align our stakeholders to our governance practice, we created and require all vendors and contractors to adhere to a Vendor Code of Conduct when
conducting business with AAT.
26Financial Definitions; Non‐GAAP Financial Measures
Total Capitalization: Total Capitalization equals Equity Market Capitalization plus Total Existing Debt.
Net Debt: Net Debt equals Total Debt minus Cash and Cash Equivalents.
Earnings Before Interest, Taxes, Depreciation, and Amortization (EBITDA): EBITDA is a non‐GAAP measure that means net income or loss plus depreciation and
amortization, net interest expense, income taxes, gain or loss on sale of real estate and impairments of real estate, if any. EBITDA is presented because it
approximates a key performance measure in our debt covenants, but it should not be considered an alternative measure of operating results or cash flow from
operations as determined in accordance with GAAP. The reconciliation of net income to EBITDA for the years ending December 31, 2011 through December 31, 2020
is as follows:
($000's; includes discontinued operations)
YEAR ENDED
DECEMBER 31,
2020 2019 2018 2017 2016 2015 2014 2013 2012 2011
NET INCOME $ 35,588 $ 60,188 $ 27,202 $ 40,132 $ 45,637 $ 53,915 $ 31,145 $ 22,594 $ 51,601 $ 19,324
DEPRECIATION AND AMORTIZATION 108,292 96,205 107,093 83,278 71,319 63,392 66,568 66,775 63,011 58,543
INTEREST EXPENSE 53,440 54,008 52,248 53,848 51,936 47,260 52,965 58,020 59,043 56,552
INTEREST INCOME (436) (696) (238) (548) (72) (90) (155) (148) (336) (1,621)
INCOME TAX EXPENSE/(BENEFIT) (9) 819 327 214 566 295 460 645 1,016 831
GAIN ON SALE OF REAL ESTATE - (633) - - - (7,121) - - (36,720) (3,981)
EBITDAre $ 196,875 $ 209,891 $ 186,632 $ 176,924 $ 169,386 $ 157,651 $ 150,983 $ 147,886 $ 137,615 $ 129,648
We caution investors that amounts presented in accordance with our definitions of EBITDA may not be comparable to similar measures disclosed by other companies,
because not all companies calculate these non‐GAAP measures in the same manner. EBITDA should not be considered as an alternative measure of our net income
(loss), operating performance, cash flow or liquidity. EBITDA may include funds that may not be available for our discretionary use due to functional requirements to
conserve funds for capital expenditures and property acquisitions and other commitments and uncertainties. Although we believe that EBITDA can enhance an
investor’s understanding of our results of operations, these non‐GAAP financial measures, when viewed individually, are not necessarily a better indicator of any
trend as compared to GAAP measures such as net income (loss) or cash flow from operations.
Annualized base rent (ABR) is calculated by multiplying base rental payments (defined as cash base rents (before abatements)) under commenced leases for the
month ended December 31, 2020 by 12. In the case of triple net or modified gross leases, annualized base rent does not include tenant reimbursements for real
estate taxes, insurance, common area or other operating expenses. We caution investors that other equity REITs may not calculate annualized base rent as we do,
and, accordingly, our annualized base rent data may not be comparable to such other REITs’ annualized base rent data.
27Financial Definitions; Non‐GAAP Financial Measures (cont’d)
Funds From Operations (FFO): FFO is a supplemental measure of real estate companies' operating performances. The National Association of Real Estate
Investment Trusts (NAREIT) defines FFO as follows: net income, computed in accordance with GAAP plus depreciation and amortization of real estate assets and
excluding extraordinary items, gains and losses on sale of real estate and impairment losses. NAREIT developed FFO as a relative measure of performance and
liquidity of an equity REIT in order to recognize that the value of income‐producing real estate historically has not depreciated on the basis determined under
GAAP. However, FFO does not represent cash flows from operating activities in accordance with GAAP (which, unlike FFO, generally reflects all cash effects of
transactions and other events in the determination of net income); should not be considered an alternative to net income as an indication of our performance; and
is not necessarily indicative of cash flow as a measure of liquidity or ability to pay dividends. We consider FFO a meaningful, additional measure of operating
performance primarily because it excludes the assumption that the value of real estate assets diminishes predictably over time, and because industry analysts
have accepted it as a performance measure. Comparison of our presentation of FFO to similarly titled measures for other REITs may not necessarily be meaningful
due to possible differences in the application of the NAREIT definition used by such REITs. The reconciliation of net income to FFO for the years ending December
31, 2011 through December 31, 2020 is as follows:
($000's, except per share amounts; includes discontinued operations)
YEAR ENDED
DECEMBER 31,
2020 2019 2018 2017 2016 2015 2014 2013 2012 2011
NET INCOME $ 35,588 $ 60,188 $ 27,202 $ 40,132 $ 45,637 $ 53,915 $ 31,145 $ 22,594 $ 51,601 $ 19,324
DEPRECIATION AND AMORTIZATION OF REAL 108,292 96,205 107,093 83,278 71,319 63,392 66,568 66,775 63,011 58,543
ESTATE ASSETS
DEPRECIATION AND AMORTIZATION ON - - - - - - - - - 688
UNCONSOLIDATED JV
GAIN ON SALE OF REAL ESTATE (633) - - - (7,121) - - (36,720) (3,981)
FFO, AS DEFINED BY NAREIT $ 143,880 $ 155,760 $ 134,295 $ 123,410 $ 116,956 $ 110,186 $ 97,713 $ 89,369 $ 77,892 $ 74,574
LESS: NONFORFEITABLE DIVIDENDS ON (377) (376) (305) (236) (183) (159) (137) (357) (354) (316)
RESTRICTED STOCK AWARDS
LESS: FFO ATTRIBUTABLE TO - - - - - - - - - (16,973)
PREDECESSOR'S CONTROLLED AND
NONCONTROLLED OWNERS' EQUITY
FFO ATTRIBUTABLE TO COMMON STOCK $ 143,503 $ 155,384 $ 133,990 $ 123,174 $ 116,773 $ 110,027 $ 97,576 $ 89,012 $ 77,538 $ 57,285
WEIGHTED AVERAGE NUMBER OF COMMON 76,122 70,789 64,139 64,090 63,231 62,343 60,256 57,726 57,263 54,417
SHARES
FFO PER DILUTED SHARE $ 1.89 $ 2.20 $ 2.09 $ 1.92 $ 1.85 $ 1.76 $ 1.62 $ 1.54 $ 1.35 $ 1.05
28Financial Definitions; Non‐GAAP Financial Measures (cont’d)
Funds From Operations as Adjusted (FFO As Adjusted): FFO As Adjusted is a supplemental measure of real estate companies’ operating performances. We use FFO
As Adjusted as a supplemental performance measure because losses from early extinguishment of debt, loan transfer and consent fees and gains on acquisitions of
controlling interests create significant earnings volatility which in turn results in less comparability between reporting periods and less predictability regarding
future earnings potential. The adjustments noted resulted from our initial public offering and formation transactions. However, other REITs may use different
methodologies for defining adjustments and, accordingly, our FFO As Adjusted may not be comparable to other REITs. The reconciliation of net income to FFO for
the year ending December 31, 2011 is as follows:
(Amounts in thousands, except per share amounts; includes discontinued operations)
Year Ended
December 31,
2011
FFO, as defined by NAREIT $ 74,574
Early extinguishment of debt 25,867
Loan transfer and consent fees 9,019
Gain on acquisition of controlling interests (46,371)
FFO As Adjusted 63,089
Less: Nonforfeitable dividends on restricted stock awards (316)
Less: FFO attributable to Predecessor's controlled and noncontrolled owners' equity (2,462)
FFO As Adjusted Attributable to Common Stock 60,311
Weighted Average Number of Common Shares 54,417
FFO As Adjusted per Diluted Share $ 1.11
Net Operating Income (NOI): NOI is a non‐GAAP supplemental earnings measure which the company considers meaningful in measuring its operating performance.
We define NOI as operating revenues (rental income, tenant reimbursements and other property income) less property and related expenses (property expenses
and real estate taxes). Other REITs may use different methodologies for calculating NOI, and accordingly, our NOI may not be comparable to other REITs. Since NOI
excludes general and administrative expenses, interest expense, depreciation and amortization, acquisition‐related expenses, other nonproperty income and
losses, gains and losses from property dispositions, and extraordinary items, it provides a performance measure that, when compared year over year, reflects the
revenues and expenses directly associated with owning and operating commercial real estate and the impact to operations from trends in occupancy rates, rental
rates, and operating costs, providing a perspective on operations not immediately apparent from net income. However, NOI should not be viewed as an
alternative measure of our financial performance since it does not reflect general and administrative expenses, interest expense, depreciation and amortization
costs, other nonproperty income and losses, the level of capital expenditures and leasing costs necessary to maintain the operating performance of the properties,
or trends in development and construction activities which are significant economic costs and activities that could materially impact our results from operations.
29Financial Definitions; Non‐GAAP Financial Measures (cont’d) Cash NOI: Cash NOI is a non‐GAAP supplemental earnings measure which the company considers meaningful in measuring its operating performance. Cash NOI is equal to NOI as defined above, adjusted for non‐cash revenue and operating expense items such as straight‐line rent, amortization of lease intangibles, amortization of lease incentives and other adjustments. The Company believes cash NOI provides useful information to investors regarding the Company's financial condition and results of operations because it reflects only those income and expense items that are incurred at the property level, and when compared across periods, can be used to determine trends in earnings of the Company's properties as this measure is not affected by (1) the non‐cash revenue and expense recognition items, (2) the cost of funds of the property owner, (3) the impact of depreciation and amortization expenses as well as gains or losses from the sale of operating real estate assets that are included in net income computed in accordance with GAAP or (4) general and administrative expenses and other gains and losses that are specific to the property owner. The Company believes the exclusion of these items from net income is useful because the resulting measure captures the actual revenue generated and actual expenses incurred in operating the Company's properties as well as trends in occupancy rates, rental rates and operating costs. Use of Non‐GAAP Financial Measures This presentation contains certain non‐GAAP financial measures within the meaning Regulation G and other terms that have particular definitions when used by us. The definitions of these non‐GAAP financial measures and other terms may differ from those used by other REITs and, accordingly, may not be comparable. The definitions of these terms, the reasons for their use, and reconciliations to the most directly comparable GAAP measure are included in the Financial Definitions herein. 30
You can also read