UK Commercial Property REIT (UKCM) - February 2021 Year End 2020 - Results Presentation

Page created by Bertha Vega
 
CONTINUE READING
UK Commercial Property REIT (UKCM) - February 2021 Year End 2020 - Results Presentation
February 2021
UK Commercial Property REIT (UKCM)
Year End 2020 – Results Presentation

Presented by:

- Will Fulton, ASI
- Graeme McDonald, ASI

Picture – Ocado, Hatfield
Aberdeen Standard Investments (‘ASI’)
UK Commercial Property REIT (UKCM) - February 2021 Year End 2020 - Results Presentation
Agenda

01. Overview

02. The Market

03. Financial Highlights

04. Portfolio and Performance

05. Concluding Remarks

1
UK Commercial Property REIT (UKCM) - February 2021 Year End 2020 - Results Presentation
Overview

      UK Commercial Property REIT (UKCM) owns a diversified portfolio of UK real estate assets and aims to deliver an attractive level of
                                    income together with the potential for capital and income growth

                                   The Company has delivered robust returns in an unprecedented economic environment

                                          Asset allocation firmly weighted to the industrial sector with a 58% exposure

      Successful asset management has improved occupancy - notably letting Lutterworth on a 15 year lease which reduced void by 35%

                                Rent collection stronger than anticipated, and has improved each quarter since Spring 2020

    Strong balance sheet with considerable financial resources available to invest and low levels of gearing has allowed the Company to pay
                                                   out a dividend throughout this pandemic*

                       Continued Environmental Social Governance (ESG) focus with an EPRA** “Gold” rating for Best Practice

       Source: Aberdeen Standard Investments
       (* please refer to 31 December 2020 NAV statement for more details; **The European Public Real Estate Association)
2      Past performance is not a guide to future results. The value of investments, and the income
       from them, can go down as well as up and you may get back less than the amount invested
UK Commercial Property REIT (UKCM) - February 2021 Year End 2020 - Results Presentation
Agenda

01. Overview

02. The Market

03. Financial Highlights

04. Portfolio and Performance

05. Concluding Remarks

3
UK Commercial Property REIT (UKCM) - February 2021 Year End 2020 - Results Presentation
UK Forecasting

    A renewed sense of optimism moving into 2021, with a no-deal Brexit averted and a vaccine roll out, is likely to be tempered, at least
                                                initially, by the latest national lockdown

             Retail and Leisure remain under significant pressure with the exception of supermarkets which are highly resilient

                         Industrial sector thriving and set to continue to benefit from accelerating structural changes

                        Continued measured-risk approach to the portfolio with income sustainability driving returns

                        Lower for longer interest rate expectations remain in place – supportive of real estate pricing

4
UK Commercial Property REIT (UKCM) - February 2021 Year End 2020 - Results Presentation
UKCM sector weightings against ASI sub-sector forecast returns
78% of the portfolio is in sectors forecast to outperform

    Source: Aberdeen Standard Investments, December 2020. No assumptions around future performance should be made

          Forecasts are not a reliable indicator of future results and there can be no guarantee that
5         these will be achieved
UK Commercial Property REIT (UKCM) - February 2021 Year End 2020 - Results Presentation
Logistics market outlook post-Covid-19
Mixed short-term signals but powerful structural drivers in the long-term

     Short-term                      Economy                                Demand                                Supply                     Investment              Relative Returns
    performance
     indicators

     (1-2 years)
                                                                                                                                                                        
                             Volatile recovery expected           E-commerce & groceries up              Vacancy being absorbed             Massive demand          Outperform All Property

                                                                     Online retail trends accelerated 5 years                                   Investment considerations
                                                                     Existing supply chains need to adapt
                                                                     Major investment required by retailers                             • Intense pricing pressures. We anticipate
                                                                     Urban fringe and mid-box critical                                    significant volumes of capital to target this
                                    E-commerce                                                                                             sector over the next decade

     Long-term                                                       Long supply chains carry excessive risk                            • Urban fringe and mid-box should be most
    Performance                                                      Labour cost arbitrage less pronounced                                relevant parts of the market
      drivers                                                        Automation and robotics game-changing
                                                                     Boost for major consumption markets                                • Fierce competition between operators – be
    (next decade)                   Near-shoring                                                                                           certain your tenant is future-proof

                                                                                                                                         • Maximise ESG potential to ensure
                                                                     Supply chain risk has increased last 10yrs                           efficiency and employee welfare
                                                                     Switch focus towards certainty vs. speed
                                                                     Expected to drive storage requirements                             • Beware regulation – particularly urban
                                                                     Will be very cost-sensitive – low rents key
                                 Inventory building

Source: Aberdeen Standard Investments, January 2021
Short term indicators are relative to last 5 year trend, relative returns indicator based on three year outlook vs Global All Property

      Forecasts offered as opinion and are not reflective of potential performance. Forecasts are not guaranteed
6     and actual events or results may differ material.
UK Commercial Property REIT (UKCM) - February 2021 Year End 2020 - Results Presentation
Agenda

01. Overview

02. The Market

03. Financial Highlights

04. Portfolio and Performance

05. Concluding Remarks

7
UK Commercial Property REIT (UKCM) - February 2021 Year End 2020 - Results Presentation
Financial highlights as at 31 December 2020
Strong Balance Sheet, Low Leverage and Significant Resources

                                                                                                 Current combined debt positon

                                                                                                  Overall Debt Position

                                                                                                                                               Total debt available   £350m

                     86.7p                                                2.7p                                                                 Remaining available    £150m
                     89.8p                                                3.5p
                                                                                                                                               Weighted Average
                                                                                                                                                                      8.2 years
                    NAV per share                                         EPRA earnings                                                        Period to maturity
                                                                          per share

                                                                                                                                               All in rate            2.88% p.a

                                                                                                  The combined facilities provide:
                                                                                                  • Low LTV / risk
                                                                         Net: 6.4%                • Low cost
                     £218m*                                              Gross: 15.1%             • Good duration
                     £130m
                                                                         N: 14.7%
                                                                                                  • Flexibility
                                                                         G: 17.7%
                     Capital available
                     to invest
                                                                          Gearing                 • Significant covenant headroom

    Source Aberdeen Standard Investments, December 2020. Light blue figures represent position
                                                                                                 Source Aberdeen Standard Investments, December 2020
    at December 2019 * Inclusive of £150m RCF

        Past performance is not a guide to future results
8
UK Commercial Property REIT (UKCM) - February 2021 Year End 2020 - Results Presentation
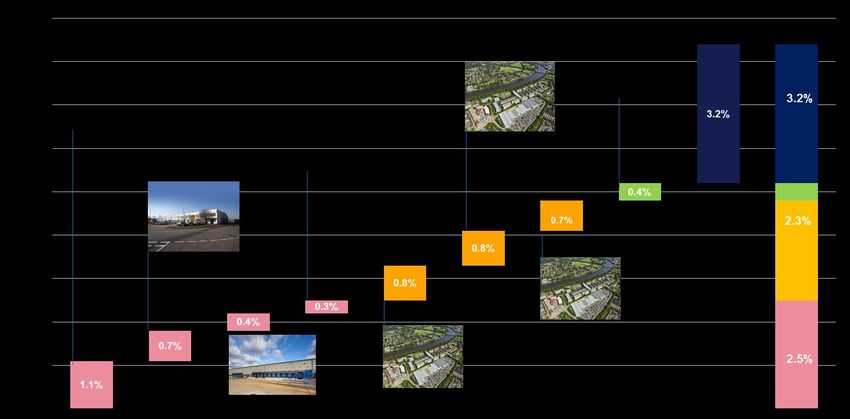
Financial highlights - NAV
    NAV movement year to 31 December 2020

Source: Aberdeen Standard Investments, December 2020

          Past performance is not a guide to future results. The value of investments, and the income from
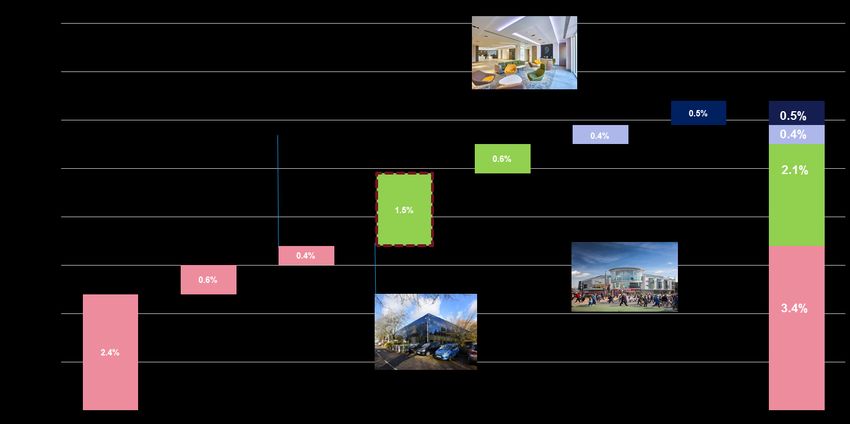
9         them, can go down as well as up and you may get back less than the amount invested
Financial highlights – EPRA Earnings
 EPRA Earnings movement year to 31 December 2020

Source: Aberdeen Standard Investments, December 2020

        Past performance is not a guide to future results. The value of investments, and the income from
10      them, can go down as well as up and you may get back less than the amount invested
Agenda

01. Overview

02. The Market

03. Financial Highlights

04. Portfolio and Performance

05. Concluding Remarks

11
Strategy
To provide shareholders with an attractive level of income with the potential for capital and income growth from
investing in a diversified portfolio of UK commercial property

                                                                 •   Continued focus on rent collection and reducing

                     Asset                                       •
                                                                     arrears
                                                                     Drive down void level
                                                                 •   Enhance lease terms
                   Management                                    •   Engage with retail tenants to create sustainable
                                                                     lease structures

                                                                 •   Focus on “future fit” modern economy and goods &
                     Accretive                                   •
                                                                     services distribution
                                                                     Continue to explore strong operational opportunities in the

                    Acquisitions                                 •
                                                                 •
                                                                     alternatives sector
                                                                     Ability to repeat durable income streams
                                                                     Lot Size target £20-50m

                                                                 •   Exit assets with significant capex requirement
                       Selective                                 •
                                                                     and limited return prospects
                                                                     Selectively reduce retail and leisure exposure
                        Selling

12
ESG Performance and Reporting

GRESB 2020
•    UKCM 2nd in UK Diversified (listed) peer group
•    Overall score of 67/100; Two Star rating

Trust 2020 ESG Performance Headlines (EPRA sBPR)
•    EPRA Gold rating September 2020
•    100% of electricity sourced from renewable sources
•    100% diversion of waste from landfill

Current initiatives
•    Improve energy data collection at single let assets
•    Ongoing Solar PV feasibility at several industrial and retail assets.
•    Investigating potential for biodiversity projects including beehives
•    Installing enhanced bicycle facilities
•    Community activities at large format retail / leisure once practicable

13
Portfolio Structure

  Portfolio sector weighting (by Market Value)                                                                                       UKCM sector breakdown
                                                                                                                                                                                          Urban       Non - Urban
                                                                                                                                     Industrial

                                                                                                                                                                                          60%

                                                                                                                                                                                                     Rest of UK (light
                                                                                                                                     Office                                           London            green SE)

Source: Aberdeen Standard Investments, Dec ember 2020; MSCI Balanced Quarterly & Monthly benchmark, September 2020

                                                                                                                                     Retail                                   Retail Warehousing     High Street (light
  Capital value by geography
                                                                                                                                                                                                   orange supermarket)
      40%       37%

      35%
      30%
      25%
                               19%
      20%
      15%
                                         9%               9%           8%              8%                                            Other                                    Cinema Anchored          Hotel/Student
      10%
       5%
                                                                                                  5%                 5%
                                                                                                                                                                                  Leisure             Accommodation
       0%
                                London

                                          West Midlands

                                                                                       Scotland

                                                                                                  Yorks and Humber
                                                          South West

                                                                                                                     North East
                                                                       East Midlands
                  South East

Source: Aberdeen Standard Investments, December 2020                                                                              Source: Aberdeen Standard Investments, Dec ember 2020

14
Portfolio Performance to 31 December 2020
UKCM direct portfolio total return outperforming Benchmark

                                    Exposure                     Total return                       Income return                          Capital return
     H2 2020
                                      (%)                            (%)                                 (%)                                    (%)
                                                        Portfolio         Benchmark            Portfolio         Benchmark            Portfolio        Benchmark

     Industrial                         58                10.3                  8.9              1.7                2.2                 8.5                6.6

     Office                             14                -2.5                  0.3              2.2                2.2                 -4.6               -1.8

     Retail                             17                -0.8                  -1.6             1.9                3.2                 -2.7               -4.7

     Other (inc. Leisure)               11                -4.5                  -0.2             -0.8               2.5                 -3.7               -2.7

     Total portfolio                    100               4.6                   2.6              1.5                2.5                 3.1                0.1

     Source: UKCM, Aberdeen Standard Investments, December 2020 - Benchmark: MSCI UK Balanced Portfolios benchmark to 30 September 2020 + 3 months MSCI UK Balanced Funds
     Monthly index to 31 December 2020 . UKCM Figures are gross of Investment management fees, gearing costs and other fund related fees
15
       Past performance is not a guide to future results.
Rent Collection – Year to 01 January 2021
 2020 Rent Collection

 Source: Aberdeen Standard Investments, January 2021

      Update on 17% Rent Outstanding over the four “COVID”
      quarters as at 28/01/2021

     Source: Aberdeen Standard Investments, January 2021

16
Investment - Sales & Purchases 2020

              Sales (5)                                                                                                 Purchases (3)

                                     £160m*                                                                                            £74m
                                                                                                                                   £156m

                  Broadbridge                                     Great Lodge R Park,
1                                                                                                                      PBSA, Exeter                                     PBSA, Edinburgh
                  R Park, Horsham            3                    Tunbridge Wells                 1                                                3
                                                                                                                       • £28m funding                                   • £29.1m funding
                                                                  • £46.25m**                                          • 5.6% projected NIY                             • 5.5% projected NIY
                  • £18.1m
                                                                  • Ahead of valuation                                 • Strong university                              • Prime student location
                  • In line with valuation
                                                                  • Mitigated short term                               • Located adjacent to the                        • High proportion of
                  • Selling down risk
                                                                  income risk                                          main campus                                      cluster rooms
                  retail income
                                                                                                                       • Construction to                                • Construction to
                                                                                                                       complete for 2022/23                             complete for 2022/23
                                                                                                                       academic year M8 Industrial Estate, Glasgow      academic year
                 Eldon House,                                     M8 Interlink Estate                                             •£24.6m
                                                                                                                                    Distribution Portfolio
                        M8 Industrial Estate, Glasgow                                                                             •Topped up NIY 5.9%
                                                                                                                         ASDA Torquay
                 London•£24.6m                                    Glasgow                          2
2                                         4                                                                                              •£85.4m
                                                                                                                                       •290,104 sq ft across 20 units
                           •Topped up NIY 5.9%                                                                           • £16.6m      •Average
                                                                                                                                         •Toppedrent
                                                                                                                                                  upofNIY
                                                                                                                                                        £5.25 psf
                 • £40m •290,104 sq ft across 20 units            • £25.4m                                                                                 5.5%
                                                                  • 290,104 sq ft                                        • NIY 5.25% in •909,030
                                                                                                                                          2021    sq ft
                 •Crystallized profitrent
                           •Average   fromof £5.25 psf
                                                                  • Opportunistic &                                      • 15 year income   with rent of £5.52 psf
                                                                                                                                         •Average
                 AM Activity
                                                                  mitigate void risk                                     indexed reviews
                                                                                                                         • Strong underlying trade

     Source: Aberdeen Standard Investments, January 2021 * Includes Motorpark, Portsmouth, sold for £29.8m in March 2020; ** Less rent guarantee escrow.
17
Industrial portfolio: Positive Leasing Activity
                                                              Xdock377, Magna Park, Lutterworth
Sector Weighting
                                                                                             •    Newly refurbished cross docked facility in a prime
                                                                                                  Golden Triangle location

                                                                                             •    Let on a new 15 year lease to Armstrong Logistics.

                                                                                             •    Agreed a rent of £2.45m per annum

                                                                                             •    Mitigated the largest void in the portfolio

                                                              Dolphin Industrial Estate, Sunbury on Thames
Sector Occupancy
                                                                                              •   High quality multi let urban estate with good
                                                                                                  access to the M25

                                                                                              •   Let Unit C to Avenue 51 on a 10 year lease with a
                                                                                                  break at year 5 for £275,000 pa (£13.00 psf).

                                                                                              •   Estate is now fully let and a new rental tone has
                                                                                                  been achieved.

                                                                                              •   Significant valuation uplift in H2 2020.

     Source: Aberdeen Standard Investments,
     January 2021
                                              Strategically Positioned – Urban Industrial Engine for Rental Growth

18
Portfolio voids (by ERV) – significantly reduced

                  Ventura Park, Radlett

                                                                                                                   Remainder all
                                                                                                                   sectors
Lease events over the next 12 months (by annual rent passing)

 By rent passing

                                                                                                                                                  25 Moorgate,
                 Compagnie Fruitiere,                                                                         Gap,                                Colmore Row,
                 Dartford                                                                                     Kew Retail Park

                                                                       UPS, Emerald Park

                                   H Tenens,
                                   Sunbury
                                                                                                                                                                 Remainder
                                                                                                                                                                             0.4%
Rent bridge
Potential Income Growth

 Source: ASI, Dec 2020

        Past performance is not a guide to the future. The value of investments and the
21      income from them can fall as well as rise and is not guaranteed
Agenda

01. Overview

02. The Market

03. Financial Highlights

04. Portfolio and Performance

05. Concluding Remarks

22
Concluding remarks
UKCM has strong foundations to help it navigate through COVID-19

                                UKCM continues to have a portfolio aligned to sectors which aim to perform well on a relative basis
                                given current market conditions – it’s investment focus is firmly on “fit for the future” modern economy
                                assets

                                Maintenance of income is a key focus of the Board with a dedicated team at the Investment Manager in
                                regular contact with tenants

                                Diversified tenant base helpful in the current environment with a number of large household names
                                in the top ten such as Ocado and Amazon

                                The Company has continued to pay a dividend throughout this pandemic and with a further top up
                                dividend once audited results are announced*.

                                The Company remains one of the largest diversified REITs with a strong balance sheet, low gearing and
                                considerable financial resources. Overall UKCM has strong foundations to help it navigate through the
                                implications of Brexit and COVID-19 and be a beneficiary of the accelerated structural changes taking
                                place in the UK real estate market.

*(* please refer to 31 December 2020 NAV statement for more details)

       Past dividends are not a guide to future dividends
23
01

     UK Commercial Property REIT
     2020 – Results Presentation

     Q&A
01

     UK Commercial Property REIT
     2020 – Results Presentation

     Data Pack
UK Commercial Property REIT
Experienced and dedicated fund management team with specialist support
                                                       Independent Board

                        Credit Management                                              Research and
                        team                                                           Strategy team
                           Monitors financial               Lead Manager                  Global macro
                                                                                          assumptions
                           health of existing                 Will Fulton
                           and prospective                                                Quarterly real

                                                                                                                  Research / underwriting
                           tenants                                                        estate house view
                                                        Deputy Fund Manager
      Risk management

                                                             Tom Elviss

                        Development                                                    Transactions
                        team                                                           team
                           Deal structuring                                                Transactions
                                                       UKCM Real Estate Team               support
                           Review/ negotiation
                           of funding                     David Fleetwood
                           agreements                      David Rodger
                                                         Sarah MacDougall
                                                           Gary Sleator
                        Finance & Tax
                                                                                       Wider ASI
                        team
                                                                                       Capabilities
                           Fund & deal
                           structuring                                                    Multi-Asset Investing
                                                                                          team, Global
                                                 Real Estate Finance Management Team
                           Tax planning                                                   Strategy, Global
                                                            Graeme McDonald               Equity and Fixed
                           Banking
                           relationships
                                                              Michelle Reid               Interest teams

Source: Aberdeen Standard Investments, Dec 20

26
Global Performance Signals: Q1 2021
Vaccine offers hope for later in 2021 but first half likely to remain challenging
                     Performance                   Current
                                                                       Outlook                                                  Comment
                     Signals                       Signal
                                                                                          UK to contract again in Q4 and Q1 after nearly 16% growth in Q3. Until a
                     Economic
                     fundamentals                                                        vaccine rolled out, lopsided “W” profile to growth expected. Thinness of Brexit
                                                                                          deal to reveal itself over time – financial services remain a concern.
     Macro

                     Margin over bonds                                                   Real estate yields drifting outwards where risk has risen; gap narrowing for
                                                                                          securest income. Corp. bond spreads back in line with pre-Covid levels

                     Monetary policy                                                     Emergency cut to 0.1% and an expansion of QE has followed. More QE in
                                                                                          November but vaccine hopes may mean risk of negative rates has faded
                                                                                          Increasing number of segments may already be oversupplied through existing
                     Supply                                                              stock; conversions may offer more hidden supply. But logistics supply arguably
                                                                                          not keeping up with demand, especially in urban areas

                     Flows of capital                                                    Lockdown to hamper recovery in volumes but tentative improvement expected
     Real Estate

                                                                                          in H1 2021, although focus of investor demand to remain narrow

                     Lending                                                             Traditional lenders hunkering down and pressured into forbearance; new
                                                                                          lending remains highly constrained with refinancing concerns mounting

                     Fund flows                                                          Flows relatively stable after initial outflows post re-opening. Lockdown could
                                                                                          weaken sentiment; proposed regulatory change a barrier to inflows.

                                                                                          REITs bounced on vaccine news but rental declines are still being priced into
                     360° view                                                           London specialists. Debt fund interest strong, as alternative lenders can
                                                                                          demand healthy margins; may also imply lack of faith in equity component

Sources: MSCI/IPD; Thomson Reuters Eikon; PMA; RCA; CBRE, Investment Association; Aberdeen Standard Investments, January 2021

Key:               Trend:             Performance signal:

27                  Stable           Supportive
                    Upward trend     Neutral
                    Downward trend   Unsupportive
In a low rate environment, lower income yield is evident across asset classes
Real estate yields compare favourably in this environment

      Low interest rate environment a global phenomenon                                                                                                                                                              Multi asset UK yield comparison
                                                                                                                                                                                                                                 10
     Policy Rate (%)
        8
                                                                                                                                                                                                                                 9
        7
                                                                                                                                                                                                                                 8

        6                                                                                                                                                                                                                        7

        5                                                                                                                                                                                                                        6

                                                                                                                                                                                                                     Yield (%)
        4                                                                                                                                                                                                                        5

                                                                                                                                                                                                                                 4
        3
                                                                                                                                                                                                                                 3
        2
                                                                                                                                                                                                                                 2
        1
                                                                                                                                                                                                                                 1
        0
                                                                                                                                                                                                                                 0

                                                                                                                                                                                                                                      Q1 2003
                                                                                                                                                                                                                                      Q4 2003
                                                                                                                                                                                                                                      Q3 2004
                                                                                                                                                                                                                                      Q2 2005
                                                                                                                                                                                                                                      Q1 2006
                                                                                                                                                                                                                                      Q4 2006
                                                                                                                                                                                                                                      Q3 2007
                                                                                                                                                                                                                                      Q2 2008
                                                                                                                                                                                                                                      Q1 2009
                                                                                                                                                                                                                                      Q4 2009
                                                                                                                                                                                                                                      Q3 2010
                                                                                                                                                                                                                                      Q2 2011
                                                                                                                                                                                                                                      Q1 2012
                                                                                                                                                                                                                                      Q4 2012
                                                                                                                                                                                                                                      Q3 2013
                                                                                                                                                                                                                                      Q2 2014
                                                                                                                                                                                                                                      Q1 2015
                                                                                                                                                                                                                                      Q4 2015
                                                                                                                                                                                                                                      Q3 2016
                                                                                                                                                                                                                                      Q2 2017
                                                                                                                                                                                                                                      Q1 2018
                                                                                                                                                                                                                                      Q4 2018
                                                                                                                                                                                                                                      Q3 2019
                                                                                                                                                                                                                                      Q2 2020
                                                                                                                                                                                                                                      Q1 2021
       -1
            Q4 2001
                      Q4 2002
                                Q4 2003
                                          Q4 2004
                                                    Q4 2005
                                                              Q4 2006
                                                                        Q4 2007
                                                                                  Q4 2008
                                                                                            Q4 2009
                                                                                                      Q4 2010
                                                                                                                Q4 2011
                                                                                                                          Q4 2012
                                                                                                                                    Q4 2013
                                                                                                                                              Q4 2014
                                                                                                                                                        Q4 2015
                                                                                                                                                                  Q4 2016
                                                                                                                                                                            Q4 2017
                                                                                                                                                                                      Q4 2018
                                                                                                                                                                                                Q4 2019
                                                                                                                                                                                                           Q4 2020

                                                                                                                                                                                                                                      UK 10 YR Gov Yield         UK Corp. 10Y Yield (AA)
                                                                                                                                                                                                                                      Ftse 250 (Div Yield)       IPD Initial Yield
                 US                       ECB (Refi Rate)                                      Bank of Korea                                     BoE                        BoJ                           RBA                         UK Corp. 10Y Yield (BBB)   IPD Equivalent Yield

                                                                                                                                                                                                                     Source: Refinitiv, MSCI, ASI, Jan 21
       Source: Refinitv, Various Central Banks, ASI, Jan 21

For illustrative purposes only
                                                                    Past performance is not a guide to future results.
28
ASI Research – 3-Year Total Return Forecasts
Significant dispersion across property segments

     Total return forecast (% p.a.), calendar years 2021-23
                             Supermarkets
         London Distribution Warehouses
      Rest of SE Distribution Warehouses
                                Healthcare
               London Standard Industrial
           Rest of SE Standard Industrial
                Build to Rent (Rest of UK)
      Rest of UK Distribution Warehouses
           Rest of UK Standard Industrial
                   Build to Rent (London)
                 Solus Retail Warehouses
                             Bristol Offices
                         Edinburgh Offices
                              Retail Parks
                             Student Halls
                       Birmingham Offices
                               All Property
                        Rest of UK Offices
                             Leeds Offices
                       Manchester Offices
                          Glasgow Offices
                     Inner London Offices
                                     Hotels
                        Rest of SE Offices
                         Mid Town Offices
                               City Offices
                Dominant Standard Shops
                         West End Offices
                                    Leisure
                    Rest of London Shops
                    Other Standard Shops
     Dominant Regional Shopping Centres
                  Other Shopping Centres
                    Central London Shops
                                          -8.0%            -6.0%   -4.0%   -2.0%    0.0%   2.0%   4.0%   6.0%   8.0%

         Source: Aberdeen Standard Investments, January 2021.
29       Forecasts offered as opinion and are not reflective of potential performance.
         Forecasts are not guaranteed and actual events or results may differ material.
Retail downgrades predominantly focused on rental value decline
Where is the floor? Threat of CVAs is real in fashion and F&B especially

     Rental value growth forecast (% p.a.), calendar years, 2021-2023
     London Distribution Warehouses
            Build to Rent (Rest of UK)
  Rest of SE Distribution Warehouses
           London Standard Industrial
               Build to Rent (London)
       Rest of SE Standard Industrial
  Rest of UK Distribution Warehouses
       Rest of UK Standard Industrial
                         Student Halls
                            Healthcare
                     Edinburgh Offices
                         Bristol Offices
                   Manchester Offices
                         Supermarkets
                   Birmingham Offices
                    Rest of UK Offices
                         Leeds Offices
                      Glasgow Offices
                 Inner London Offices
                           All Property
                                 Hotels
             Solus Retail Warehouses
                     Mid Town Offices
                    Rest of SE Offices
                     West End Offices
                          Retail Parks
                           City Offices
                                Leisure
                Rest of London Shops
            Dominant Standard Shops
 Dominant Regional Shopping Centres
                Other Standard Shops
               Central London Shops
              Other Shopping Centres
                                      -10.0%   -8.0%      -6.0%         -4.0%          -2.0%          0.0%          2.0%           4.0%

               Forecasts offered as opinion and are not reflective of potential performance. Forecasts are not guaranteed and actual
 Source: ASI, Jan 21.
 events or results may differ material.

For illustrative purposes only

30
Portfolio dashboard

 Portfolio data                 Q4 2020        Q2 2020      Rent Collection

 Portfolio Value                £1,207m       £1,219m
                                                            Rent Billing               Mar       June        Sept        Dec    Mar    June   Sept   Dec
                                                            Quarter                   2019*      2019*      2019*       2019*   2020   2020   2020   2020
                                                            Rent collected
                                                                                      99%        98%        99%         93%     77%    83%    85%    84%
 No. Properties                     36           37         *21 days

 No. of Tenancies                  183          201
                                                            Lease expiry income erosion

 Annual Rent Roll               £56.3m         £59.8m

 Estimated Rental
                                £65.6m         £69.6m
 Value

 Void Rate                        6.5%         10.0%

 AWULT*                        8.9 years      9.7 years

 NIY/ RY**                    4.3% / 5.1%    4.4% / 5.4%

 Gearing (gross)             6.4% (15.1%)   10.5% (18.7%)   Source: MSCI, Sep 20. Green: MSCI Benchmark, Orange: Portfolio

Source: ASI, Dec’20
*Average Weighted Unexpired Lease Term
** Net Initial Yield / Reversionary Yield

                                     Past performance is not a guide to future results
31
Sector exposure over time

     UKCM sector exposure by capital value versus benchmark                                      Industrial

                                           Retail-Industrial
                                           inflection point

                                                               Material strategic overweight
                                                               position to industrial
                                                                                                  Retail

                                                                                                   17%
                                                                Maintained underweight positon
                                                                to retail

                                                                                                 Offices

 Source: ASI Dec 20 & IPD MSCI, Sep 2020

32
Alternatives Portfolio: Rotunda – Asset Repositioning
                                                      The Rotunda, Kingston upon Thames
Sector Weighting

         11%

Sector Occupancy
                                                       •   Scheme closed entirely in March 2020 and January 2021.

                                                       •   18 year lease extension agreed with David Lloyd at
                                                           passing rent

                                                       •   15 year lease has been agreed with Odeon who are the
                                                           anchor tenant in the scheme

                                                       •   Tenpin lease extended to 15 years in 2019

                                                       •   Once stabilised we may look to progress with a significant
                                                           refurbishment of the scheme

                                                       •   Have enhanced WAULT of the scheme and the
                                                           refurbishment will re position the asset

     Source: ASI, Jan 21   Assisting tenants and creating long term value for Shareholders

33
Office portfolio:

Sector Weighting

Sector Occupancy

     Source: ASI, Jan 21                                                                                   Controlled Low Exposure
        Forecasts offered as opinion and are not reflective of potential performance. Forecasts are not guaranteed
34      and actual events or results may differ material.
Retail portfolio:

Sector Weighting

         17%
                                                                   Shopping     Retail
                                                                                          High Street   Supermarket   Total
                                                                    Centre    Warehouse

                                            Retail percentage         nil       67%          18%           15%        100%

                                            Portfolio percentage      nil       11%          3%             3%        17%

Sector Occupancy

     Source: ASI, Jan 21   Full exit from Shopping Centre Sector and limited High Street exposure

35
Portfolio structure
     Portfolio sector weighting (by Market Value)                               Capital value by geography

Source: ASI, Dec ‘20; MSCI Balanced Quarterly & Monthly benchmark Sep ‘20   Source: ASI Dec’20

     Detailed sector weighting break down (by Market Value)

Source: MSCI, Sep ’20, ASI Dec’20

36
Top 10 assets
 By capital value                                                                  1   2
                                                 Sector          Value Band (£m)

1. Ventura Park, Radlett               South East Industrial       Over 100

                                                                                   3   4
2. Hannah Close, London                South East Industrial         60-80

3. Dolphin Estate, Sunbury-on-Thames   South East Industrial         60-80

                                                                                   5   6
4. Ocado, Hatfield                     South East Distribution       60-80

5. Newton’s Court , Dartford           South East Industrial         60-80

6. The White Building, Reading         South East Offices            40-60         7   8

7. The Rotunda, Kingston-on-Thames     Leisure                       40-60

8. Kew Retail Park, Richmond           Retail Warehouses             40-60         9   10

9. XDock377, Lutterworth               RoUK Distribution             40-60

10. Junction 27 Retail Park, Leeds     Retail Warehouses             40-60

Source: ASI Dec ‘20

37
Top 10 tenants

 By contracted rent                                 % of           MSCI Risk Band**     December Rent Payment
                                                    Total
                                                  Income *

 1. Ocado Retail Ltd                                 5.4         Low-Medium           Paid in Full

 2. Amazon UK Services Ltd                           4.9         Negligible           Paid in Full

 3. Total E&P UK Ltd                                 3.8         Low                  Paid in Full

 4. B&Q                                              3.3         Low                  Paying Monthly in Full

 5. Cineworld                                        3.2         Low                  Unpaid

 6. TK Maxx                                          3.1         Low-Medium           Paid in Full (Kew)
                                                                                      /Monthly (Newcastle)
 7. Public Sector                                    3.0         Negligible           Paid in Full

 8. Warner Bros Studios                              3.0         Low                  Paid in Full

 9. Dalata                                           2.8         Medium-High          Paid in Full

 10. Palletforce Ltd                                 2.6         High                 Paid in Full

Source: * ASI Dec ‘20 **MSCI, Sep ’20
© owned by each of the corporate entities named in the respective logos

38
Debt Covenants

 Barings 2027                   Total debt available            £100m           Barings 2031              Total debt available          £100m

                                Remaining to draw               £0m                                       Remaining to available        £0m

                                Period to Maturity              6.25 years                                Period to Maturity            10.1 years

                                Margin                          1.25%                                     Margin                        1.45%

                                All in rate                     3.03%                                     All in rate                   2.72%

                                LTV/LTV Covenant (based                                                   LTV/Covenant (based on
                                                                50% / 75%                                                               42.1% / 75%
                                on historical bank valuation)                                             historical bank valuations)

                                ICR/Covenant                    349% / 200%                               ICR/Covenant                  312% / 200%
     Source: ASI, December 20                                                   Source: ASI December 20
                                ICR Forecast/Covenant           394% / 200%                               ICR Forecast/Covenant         367% / 200%

 Barclays                       Total debt available              £150m         Overall Debt Position
                                Remaining to Draw                 £150m
                                                                                                                Total debt available      £350m
                                Period to Maturity                3.1 years

                                Margin                            1.50%                                         Remaining available       £150m

                                All in rate                       2.80%
                                                                                                                Period to Maturity        8.2 years
                                LTV/LTV Covenant (December
                                                                  0% / 60%
                                19)

                                ICR/Covenant                      325% / 175%                                   All in rate               2.88%
     Source: ASI, December 20
                                ICR Forecast/Covenant             771% / 175%

               Past performance is not a guide to the future.
39
               The value of investments and the income from them can fall as well as rise and is not guaranteed
NAV and share price performance

  Share price                                                       Share price premium/discount to NAV

Source: ASI, December’20.

                                                                   Source: Datastream, 29 January 2021

      Past performance is not a guide to the future. The value of investments and the income from them
40    can fall as well as rise and is not guaranteed
Share Price & NAV

UKCM Share Price & NAV

Source: Datastream, 29 January 2021

         Past performance is not a guide to the future.
41
Disclaimer
 Risk factors you should consider prior to investing:
 •   The value of investments and the income from them can fall and investors may get back less than the amount invested.
 •   Past performance is not a guide to future results.
 •   Investment in the Company may not be appropriate for investors who plan to withdraw their money within 5 years.
 •   The Company may borrow to finance further investment (gearing). The use of gearing is likely to lead to volatility in the Net Asset
     Value (NAV) meaning that any movement in the value of the company's assets will result in a magnified movement in the NAV.
 •   The Company may accumulate investment positions which represent more than normal trading volumes which may make it difficult
     to realise investments and may lead to volatility in the market price of the Company's shares.
 •   The Company may charge expenses to capital which may erode the capital value of the investment.
 •   There is no guarantee that the market price of the Company's shares will fully reflect their underlying Net Asset Value.
 •   As with all stock exchange investments the value of the Company's shares purchased will immediately fall by the difference between
     the buying and selling prices, the bid-offer spread. If trading volumes fall, the bid-offer spread can widen.
 •   The Company invests in real estate which is a relatively illiquid asset class, the valuation of which is a matter of opinion. There is no
     recognised market for property and there can be delays in realising the value of assets.
 •   The value of property may fluctuate as a result of factors outside the Company’s control
 •   The Company’s ability to generate desired returns will depend on rental income generated and capital values of properties.
 •   Yields are estimated figures and may fluctuate, there are no guarantees that future dividends will match or exceed historic dividends
     and certain investors may be subject to further tax on dividends.
 •   The information contained herein including any expressions of opinion or forecasts have been obtained from or are based upon
     sources believed by us to be reliable but are not guaranteed as to their accuracy or completeness.
 •   Tax treatment depends on the individual circumstances of each investor and may be subject to change in the future. You should
     obtain specific professional advice before making any investment decision.

42
Disclaimer continued

                                                   31/12/2020 (%)           31/12/2019 (%)            31/12/2018 (%)              31/12/2017 (%)              31/12/2016 (%)
     NAV Total Return                                      -0.9                      0.1                        4.5                        12.2                         3.8
     Share Price Total Return                             -19.7                     11.3                        -2.0                        9.4                         3.8
     MSCI Benchmark Total Return                          -0.1*                      2.1                        6.7                        10.7                         3.7

Source: Aberdeen Standard Investments, 31 December 2020 (*Benchmark: MSCI UK Balanced Portfolios benchmark to 30 Sept 2020 + 3 months MSCI UK Balanced Funds Monthly index to 31 Dec 2020)
Past performance is not a guide to future results

43
Disclaimer continued

Past performance is not a guide to future results. The value of investments, and the income from them, can go down as well as up and clients may get
back less than the amount invested.

Real estate is a relatively illiquid asset class, the valuation of which is a matter of opinion. There is no recognised market for property and there can be
delays in realising the value of assets.

The views expressed in this presentation should not be construed as advice or an investment recommendation on how to construct a portfolio or whether to buy, retain
or sell a particular investment. The information contained in the presentation is for exclusive use by professional customers/eligible counterparties (ECPs) and not the
general public. The information is being given only to those persons who have received this document directly from Aberdeen Asset Managers Limited or Standard
Life Investments Limited (together “Aberdeen Standard Investments”) and must not be acted or relied upon by persons receiving a copy of this document other than
directly from Aberdeen Standard Investments. No part of this document may be copied or duplicated in any form or by any means or redistributed without the written
consent of Aberdeen Standard Investments.

Copyright and database right MSCI IPD and its licensors 2021. All rights reserved. MSCI IPD has no liability to any person for any losses, damages, costs or
expenses suffered as a result of any use of or reliance on any of the information which may be attributed to it.

The MSCI information may only be used for your internal use, may not be reproduced or re-disseminated in any form and may not be used as a basis for or a
component of any financial instruments or products or indices. None of the MSCI information is intended to constitute investment advice or a recommendation to make
(or refrain from marketing) any kind of investment decision and may not be relied on as such. Historical data and analysis, should not be taken as an indication or
guarantee of any future performance analysis forecast or prediction. The MSCI information is provided on an ‘as is’ basis and the user of this information assumes the
entire risk of any use made of this information. MSCI, each of its affiliates and each other person involved in or related to compiling, computing or creating any MSCI
information (collectively, the ‘MSCI’ Parties) expressly disclaims all warranties (including without limitation, any warranties of originality, accuracy, completeness,
timeliness, non-infringement, merchantability and fitness for a particular purpose) with respect to this information. Without limiting any of the foregoing, in no event
shall any MSCI Party have any liability for any direct, indirect, special, incidental, punitive, consequential (including, without limitation, lost profits) or any other
damages (www.msci.com).”

44
Disclaimer continued

FTSE International Limited (‘FTSE’) © FTSE 2021. ‘FTSE®’ is a trade mark of the London Stock Exchange Group companies and is used by FTSE International
Limited under licence. RAFI® is a registered trademark of Research Affiliates, LLC. All rights in the FTSE indices and / or FTSE ratings vest in FTSE and/or its
licensors. Neither FTSE nor its licensors accept any liability for any errors or omissions in the FTSE indices and / or FTSE ratings or underlying data. No further
distribution of FTSE Data is permitted without FTSE’s express written consent.

No information, opinions or data in this document constitute investment, legal, tax or other advice and are not to be relied upon in making an investment or other
decision. Subscriptions for shares in UKCM may only be made on the basis of the latest prospectus, relevant Key Information Document (KID). These can be obtained
free of charge from Aberdeen Standard Investments, 1 George Street, Edinburgh, EH2 2LL, Scotland and are also available on www.aberdeenstandard.com

The information contained herein including any expressions of opinion or forecast have been obtained from or is based upon sources believed by us to be reliable but
is not guaranteed as to the accuracy or completeness.

Any data contained herein which is attributed to a third party ("Third Party Data") is the property of (a) third party supplier(s) (the “Owner”) and is licensed for use by
Standard Life Aberdeen*. Third Party Data may not be copied or distributed. Third Party Data is provided “as is” and is not warranted to be accurate, complete or
timely. To the extent permitted by applicable law, none of the Owner, Standard Life Aberdeen* or any other third party (including any third party involved in providing
and/or compiling Third Party Data) shall have any liability for Third Party Data or for any use made of Third Party Data. Neither the Owner nor any other third party
sponsors, endorses or promotes the fund or product to which Third Party Data relates.

* Standard Life Aberdeen means the relevant member of Standard Life Aberdeen group, being Standard Life Aberdeen plc together with its subsidiaries, subsidiary
undertakings and associated companies (whether direct or indirect) from time to time.

Aberdeen Asset Managers Limited is registered in Scotland (SC108419) at 10 Queen’s Terrace, Aberdeen, AB10 1XL, Standard Life Investments Limited is registered
in Scotland (SC123321) at 1 George Street, Edinburgh EH2 2LL, and both companies are authorised and regulated in the UK by the Financial Conduct Authority.

GB-030221-141853-1

45
You can also read