IMF Group Ukraine Special Research - Locomotive power su ciency for grain transportation by rail in light of increasing grain harvests ...
←
→
Page content transcription
If your browser does not render page correctly, please read the page content below

IMF Group Ukraine
             Special Research

      Locomotive power
    sufficiency for grain
transportation by rail in
light of increasing grain
 harvests, restoration of
  Ukraine's economy by
                    2023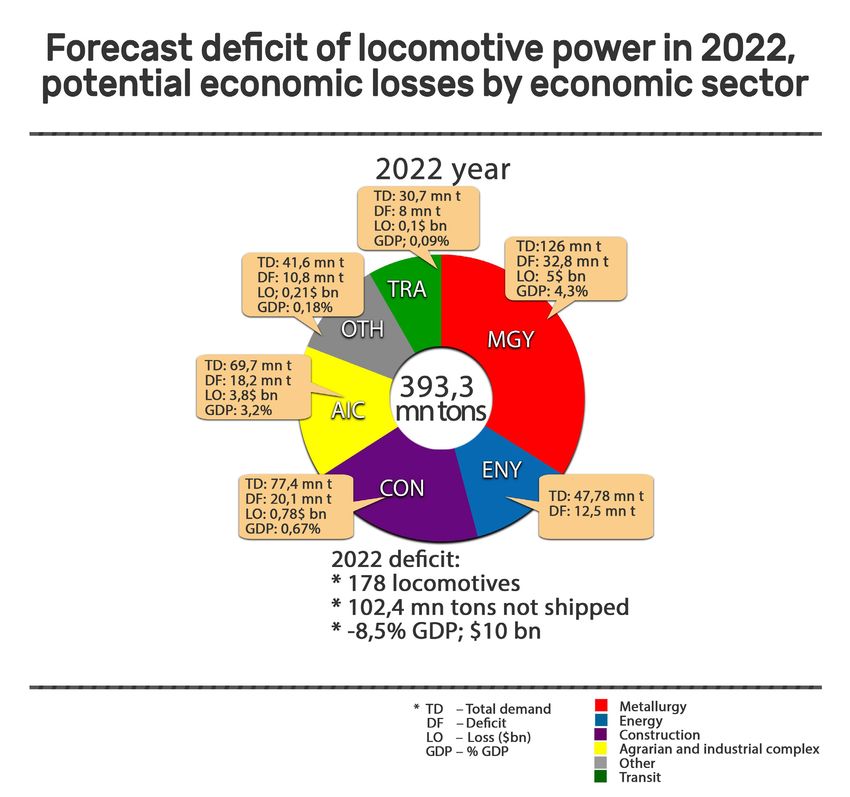
IMF Group Ukraine

                    The purpose of this study is to analyze whether
                    Ukraine’s state railway monopoly Ukrzaliznytsia (UZ)
                    will be able to cope with the growing demand for
                    grain transportation through 2023 and the percent
                    of UZ’s locomotive power deficit could arise owing
                    to failure to further reform UZ and stoppage of
                    the current UZ reform program to purchase new
                    locomotives. In addition, the study looks at potential
                    consequences the deficit of locomotive capacity
                    could have on Ukraine’s economy. Special attention
                    is paid to current logistical problems of Ukraine’s
                    Agricultural Industrial Complex (AIC).

2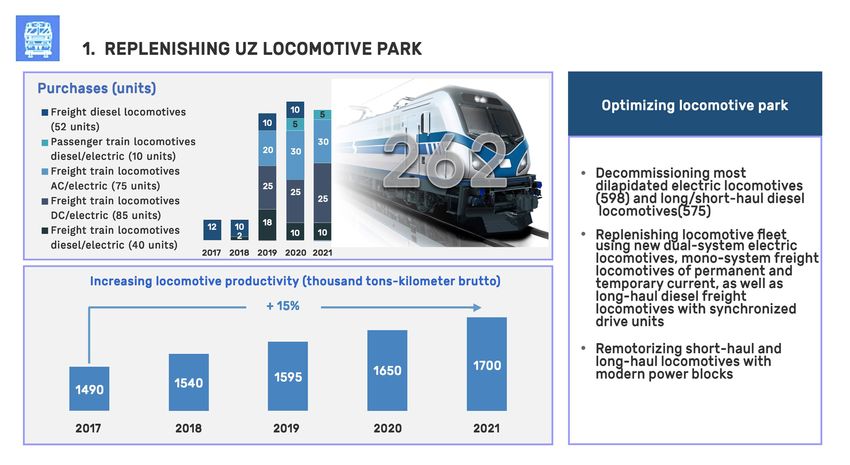
IMF Group Ukraine

Contents:
06   Grain and cereal production forecasts through 2022

08    AIC transport and logistical infrastructure

09   Current status of UZ railway grain wagon fleet

13   Ukrzaliznytsia: forecast for increased demand for rail transportation

24   Ukrzaliznytsia capacity forecast for grain transportation

27   Technical aspects of locomotive purchasing

29   Potential economic losses due to deficit of railway transport by industry sector

Glossary
Ukrzaliznytsia, Ukrainian State Railway                               UZ
Agricultural Industrial Complex                                       AIC
Hryvnia                                                              UAH
State-run Produce and Grain Corporation of Ukraine                SPGCU
National Security and Defense Council                               NSDC
Ministry of Economic Development and Trade                          MEDT
Gross Domestic Product                                               GDP
Billions, Millions, Tons                                         bn, mn, t

                                                                                            3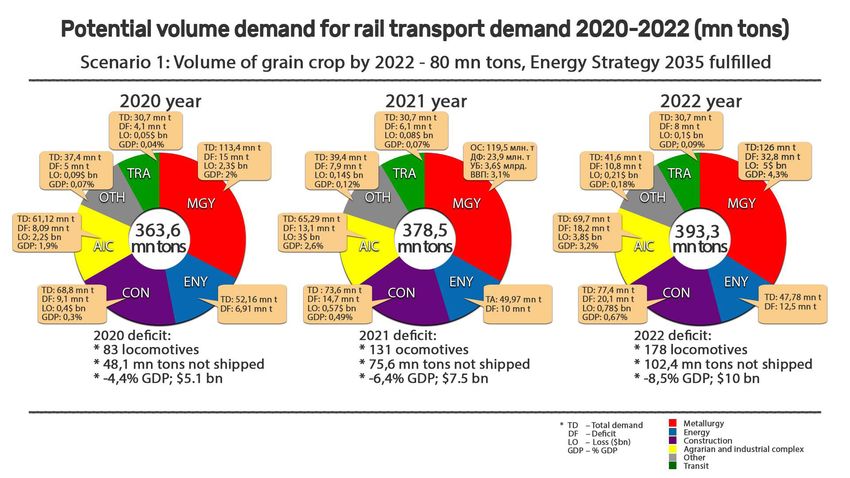
IMF Group Ukraine

            Main conclusions                                        The resulting shortage of capacities for relatively
            Despite significant interruptions, Ukrzaliznytsia       cheap freight traffic will lead to the fact that such
            (UZ) in 2017 managed to meet 97% of demand              industries as metallurgy, agro-industrial complex
            for freight rail transportation. The shortfall of       and production of building materials will be forced
            3%, or 10.5 million tons, of cargo turnover was         to reduce production volumes. The transit of
            compensated by agrarians, who were forced to            goods through Ukraine will be reduced forcibly. As
            transport their grain by more expensive means.          for energy, the potential shortage of coal and oil
            According to our estimates, the negative effect         products to heavy industry can be replaced with
            on agriculture from the need to replace railway         natural gas without significant losses. The higher
            transport by road transport amounted to $321            profitability in other industries, representing the
            million.                                                demand for rail transportation today, though it
                                                                    will allow them not to reduce production volumes,
            According to the forecasts of the AIC                   but, due to the forced transition to more expensive
            representatives confirmed by our calculations,          vehicles, will be substantially reduced.
            by the year 2022 the volume of grain production
            in Ukraine could grow from the current 62 to 80         According to our calculations, if government steps
            (+33%), or 100 (+67%) million tons, depending           back from the current program for updating and
            on the intensity of use of chemical fertilizers.        modernizing UZ’s locomotive fleet, the average
            Obviously, due to the limited internal market, the      annual loss for the economy, depending on the
            entire crop increase will be exported.                  scenario, will be from 4.8% to 7.1% of GDP per
                                                                    year. Cumulatively over five years, that equals
            At the same time, the demand for rail                   from $27.8 to $41.3 billion in 2017 prices. The
            transportation already in 2018 will also increase       current program for renewing UZ’s locomotive
            from metallurgists and other heavy industry             fleet provides for purchasing 262 critically-needed
            enterprises, which use coal and oil products            locomotives for only $1 billion.
            as their main source of energy, as well as
            manufacturers of mineral building materials and a       Our work is not intended to protect the expediency
            number of other industries.                             of choosing a particular contractor for the
                                                                    production or purchase of locomotives and is
            According to our forecast, the potential demand         only an econometric calculation of the potential
            for rail transport, depending on the scenario of        losses for Ukraine’s economy from the shortage
            yield growth and the reduction of GDP energy            of locomotive capacities of the railway and the
            intensity, may grow from the current 339.5 to           absence of a single potentially permissible tool for
            393-456 million tons over the next five years. But      servicing a variety of industries.
            UZ’s capacity volume in terms of cargo turnover is
            currently diminishing. Despite the existing number
            of problems with the deterioration of wagons,
            the main reason for the potential shortage
            of transportation capacity is the state of UZ’s
            locomotive fleet.

            So, even with the already signed contract
            for the supply of the first 30 locomotives of
            General Electric, the total number of UZ’s
            thermal and electric locomotives intended for
            freight traffic is currently only 579 units and
            is annually diminishing by an average of 4.4%,
            or 25 locomotives. While maintaining current
            performance and dropout rates, by 2022 UZ will
            have only 504 locomotives capable of transporting
            0.58 million tons per year. That is, the total volume
            of annual capacity of UZ for cargo turnover will
            amount to 291 million tons per year.

4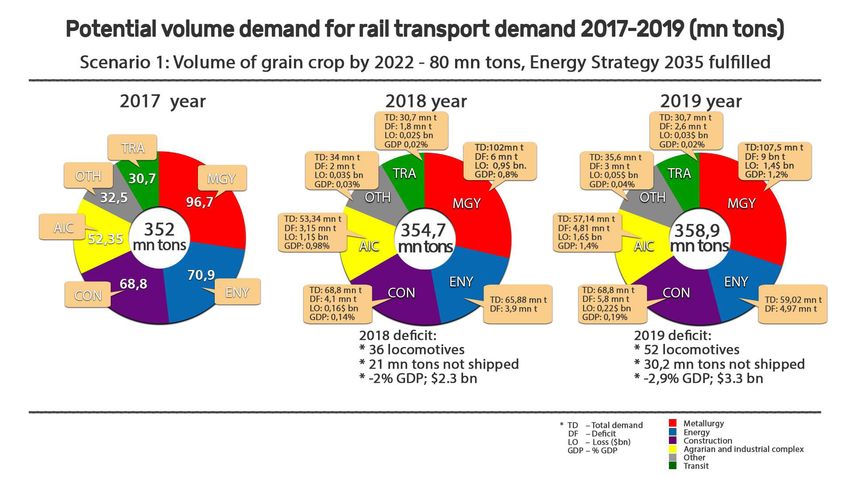
IMF Group Ukraine

Forecast deficit of locomotive power in 2022 and potential economic
                      losses by economic sector

                                                                               5
IMF Group Ukraine
01
Grain and cereal production production amounted to an unprecedented 102%,
forecasts through 2022 or a 4.81% annual increase. If agrarians can
According to our forecasts, Ukraine continue to maintain current harvest growth rates,
will increase grain crop harvesting to 80 then in 2022 Ukraine will harvest 79.3 million
million tons (+29%) by 2022, and, according to tons of grain crops a year, or 26.5% more than
the optimistic scenario — to 100 million tons today. And this is a pessimistic scenario for the
(+ 61.3%). development of Ukraine’s AIC.
In 1999-2001, the average gross harvest of grain in
Ukraine was only 29.5 million tons. By 2015-2017,
or 15 years, harvested crops reached 62.7 million
tons. Adjusted for seasonality, the growth in cereal
UKRAINE’S GRAIN
Прогноз PRODUCTION
производства FORECAST
зерновых (MN(млн.
в Украине TON)тонн.)
BASED на ON CURRENT
основе
GROWTH TRENDS
сохранения текущих темпов роста
Grain harvest (mn ton) Cumulative harvest growth since 1999 (%)
90,0 250%
Cumulative harvest growth since 1999 (%)
223%
208%
194%
80,0 169% 167%
180% 200%
Grain production mn ton)
157% 160% 152%
145%
70,0 117%
131% 150%
87% 88%
60,0 70% 100%
62% 58% 55% 60%
39%
50,0 19%
50%
0%
40,0 -18% 0%
30,0 -50%
24,6
24,5
39,7
38,8
20,2
41,8
38,0
34,3
29,3
53,3
46,0
39,3
56,7
46,2
63,1
63,9
60,1
66,1
61,9
65,7
68,9
72,2
75,7
79,3
20,0 -100%
1999
2000
2001
2002
2003
2004
2005
2006
2007
2008
2009
2010
2011
2012
2013
2014
2015
2016
2017
2018
2019
2020
2021
2022
Source: State Statistics Service of Ukraine, IMF Group Ukraine
6IMF Group Ukraine
The second, optimistic scenario for the 81 centners, German farmers — 71.8 centners,
development of the agroindustrial complex Austrian — 72.5 centners and French —
presupposes the possibility of matching growth of 56.9 centners, thanks to use of seeders with
the leading world domestic agrarians by importing precise sowing, or no-till plowing technologies.
leading technologies and experience. For example,
according to the results of 2017, the average If Ukrainian agrarians over the next five years
grain yield in Ukraine was only 42.5 centners introduce existing advanced agritechnologies,
per hectare. China is one of the main importers the country by 2022 could boost annual grain
of Ukrainian food. But Chinese farmers reap harvests by 61.4%, or up to 100 million tons.
60 centners per hectare, American farmers —
UKRAINE’S GRAIN PRODUCTION FORECAST (MN TON) BASED ON LEADING
COUNTRY
Ukraine's grain produc�on GRAIN
forecast (mn PRODUCERS
ton) based on leading country grain producers
Grain harvest (mn ton) Cumula�ve harvest growth since 1999 (%)
110 350%
307%
100 269%
300%
Grain harvest growth since 1999 (%)
90 236% 250%
205%
Grain harvest (mn ton)
80 169%
177% 200%
157% 160%
145% 152%
70 131% 150%
117%
87% 88%
60 70%
100%
62% 58% 55% 60%
39%
50 19%
50%
0%
40 -18% 0%
30 -50%
90,8
99,9
68,1
75,0
82,5
60,1
66,1
61,9
46,2
63,1
63,9
46,0
39,3
56,7
34,3
29,3
53,3
38,0
39,7
38,8
20,2
41,8
24,6
24,5
20 -100%
Source: State Statistics Service of Ukraine, IMF Group Ukraine
7IMF Group Ukraine
02
AIC transport and logistical terminals for shipping, and in the course of
infrastructure several years, will start building their own ports.
The increase in grain yields under
each scenario should be accompanied by The port and elevator infrastructure of Ukraine
a corresponding increase in infrastructure is already ready today to increase the volume of
capacities for grain transshipment. Today we can grain transshipment for export.
observe the prevailing rule since the 18th century,
namely that the market form of ownership is According to the company BlackSeaTrans,
more effective than state ownership. The private starting in 2018 the total capacity of all grain
sector is responding to the market’s demands terminals was 3.2 million tons of one-time grain
immediately: Nibulon, Cargill, Kernel and other storage of grain and 62.5 million tons of annual
grain traders are leading the way, opening of new grain transshipment. After the Cargill terminal
grain storage facilities throughout the country, in the port of Yuzhny is completed in 2019, this
buying train wagons and building ships to deliver figure will grow to 68 million tons of annual grain
grain to ports. They are already building new transshipment.
Source: Administration of seaports of Ukraine, IMF Group Ukraine
8IMF Group Ukraine
03
Current status of UZ railway grain agroholdings will be forced artificially reduce grain
wagon stock harvests because they will unable crops to foreign
Unfortunately, another, no less important, markets.
component of Ukraine’s AIC — Ukrainian Railways, or
Ukrzaliznitsia) — is in decline. In order to fully assess the extent to which the delay in
reforming UZ can be detrimental to agrarians and how
Ukrzaliznytsia (UZ) currently is not able to provide up much they require railway transportation capacity, it
to 20% of the demand for grain transportation, forcing is important to understand the place UZ occupies in
agrarians to use the services of auto carriers, whose agricultural sector logistics.
average tariff is 11 times higher than that offered by
UZ. Out of 41.8 million tons of grain exports in 2017, In 2017, Ukraine’s AIC harvested 61.9 million tons
UZ delivered to ports only 31.2 million tons, or 74.6% of of grain. Of this volume, only 33% went to domestic
the total. Remaining cargos used river transport, while consumption and processing. The remaining 42 million
10.3 million tons were delivered by motorways, which, tons went to export. Future growth of grain production
incidentally, are not designed for freight traffic on such a is for the foreign export market. Domestic cereal
scale. consumption will not increase after the level of incomes
of citizens and depends solely on the number of people.
As forecasts show, if reform of UZ is not started Over the next five years, domestic cereal consumption
immediately, by the year 2022 the share of the will remain approximately at the level of 2016, 24.6 million
railway transportation of grain may drop to 50%. Or tons, and the growing harvest volumes will be exported.
Grain production (thousands Grain export (thosands tons) Domestic consumption
tons)
Period Total
Scenario 1 Scenario 2 Scenario 1 Scenario 2 (thousands Weight (%)
(79,3) (100) (79,3) (100) tons)
Scenario 1 Scenario 2
2000 24459 1330 23129 (79,3) (100)
2005 38016 12650 25366 66,7%
2010 39271 14239 25032 63,7%
2012 42216 27798 14418 34,2%
2013 63051 27836 35215 55,9%
2014 63859 33423 30436 47,7%
2015 60126 38338 21788 36,2%
2016 66088 41451 24637 37,3%
2017 61917 41800 24637 39,8%
2018 65725 68140 42021 44436 23704 36,1% 34,8%
2019 68886 74989 45182 51285 23704 34,4% 31,6%
2020 72198 82526 48494 58822 23704 32,8% 28,7%
2021 75669 90820 51965 67116 23704 31,3% 26,1%
2022 79307 99949 55603 76245 23704 29,9% 23,7%
Source: State Statistics Service of Ukraine, IMF group Ukraine
9IMF Group Ukraine
Rail transportation of one ton of grain using UZ UZ officials today say they are not yet ready to
will cost an average of $44 on average: 9.1%, or $4 increase grain transshipment. Every day the
from taking grain from the truck to the elevator, company can provide only 1,056 hopper-grain
6.8%, or $3 for intermediate grain storage, 34.1%, wagons, while 6,000 are required during peak
or $15, for grain elevator services, 22.7%, or $10, market demand. According to UZ officials, almost
for rail delivery to the port and 27.3%, or $12, the entire current fleet, or 97.8%, of the railway
for loading grain on the ship. When delivering monopoly’s grain wagon fleet, will be unusable by
the same ton of grain by road, the cost of 2025.
transportation will increase from $10 to $41.3.
Payment of the $31.3 difference, taking into
account the average export price of a ton of wheat
last year of $160, will, at best, only allow the
domestic farmer to break even.
Вагонный парк вагонов-зерновозов
WAGON "Укрзалізниці"
PARK OF UZ GRAIN CARS
Park hopper-wagons Predicted wagon losses
14000 3500
3087
11576
Grain wagon losses by year (units)
12000 3000
Total grain wagon park (units)
10000 2500
8489 2003 1987
8000 1831 2000
6486
6000 1500
4499 895
4078
4000 3183 1000
421
2000 1352 1341 500
11
0 0
2017 2018 2019 2020 2021 2022 2023 2024
Source: Ukrzaliznytsia
10IMF Group Ukraine
The last time UZ put new grain cars into service operating on the market and left market players
in 1993, but the volume of the procurement lot relying exclusively on UZ’s grain wagon fleet.
consisted of only two grain carriers. Over 26 years However, freight forwarding companies managed
of Ukraine’s independence, 171,000 units were to bypass the NSDC ban and by the end of 2017
removed from UZ’s fleet of grain wagons, and only there were 11,500 UZ grain carriers and 6,000
25,500 new wagons were purchased, including wagons belonging to private companies in
15,000 open wagons. operation.
At the end of 2017, the entire fleet of UZ grain The shortage of grain wagons also precipitated
wagons numbered 11.5 thousand units, with the launch in September 2017 of an automated
private companies owning 3,000. Agrarians say wagon distribution system, which was set up
that at least 22,000 hopper-grain wagons are to allocate wagons in proportion to applications
needed to fully transfer grain by rail. But officials made by grain transshipment market players. The
at Ukraine’s Infrastructure Ministry say it will system, however, was flawed, catering primarily to
be enough to «optimize» the use of the existing agrarians in Ukraine’s southern regions closest to
fleet of grain wagons, by, for example, prohibiting Black Sea ports.
the use of wagons for land exports of grain and
limiting their use in the direction to the south of According to UZ daily logs, Odesa Railway
Ukraine, to the Black Sea ports. Another idea is consistently had about two thousand «available»
prohibiting grain trucks from travelling distances grain carriers, while agrarians in Ukraine’s
exceeding 200-300 kilometers. At the same time, northern regions complained about constant wagon
they propose improving the system of distributing shortages. To increase their odds of receiving
grain wagons between market participants. grain wagons, grain traders started duplicate their
bids. As a result, according UZ’s logistics office,
In early 2017, The State-run Produce and Grain applications for 50 grain wagons out of the 1,050
Corporation of Ukraine (SPGCU) announced plans actually provided, were cancelled daily.
to purchase 3,000 grain carriers using funds
provided by its Chinese benefactors. Some 500 Ukraine’s railway monopoly experiences problems
were to be delivered during the second half of with the deficit and wear of all types of freight
2017. The reason for such investments, according cars, constraining business growth in agriculture
to the management of the company, was a and other sectors of the economy. UZ managers
regular shortage of rail wagons. SPGCU’s grain announced their intention to systematically update
transportation requests were fulfilled only by 40%, UZ’s rolling fleet in May 2017 during the presentation
and the purchase plan was scupped following of the Strategy for the Development of Railways for
the resignation of SPGCU head Oleksandr 2017-2021, announcing that for the next five years,
Hryhorovych in April 2017. UAH 18 billion would be spent on the purchase
of 20,000 new freight cars. The plan has yet to
According to UZ’s 2017 financial plan, the state be approved by Ukraine’s Ministry of Economic
enterprise was supposed to buy 1,076 new Development and Trade (MEDT) and the Cabinet.
grain wagons. In March of the same year, the
management of the state enterprise announced New UZ top managers in September 2017 updated
a change of plans: UZ would instead receive 1,076 the monopoly’s strategy, announcing that until
grain carriers rebuilt from mineral wagons. In 2022 UZ’s share in cargo transportation would
July 2017, ex UZ head Wojciech Balchun resigned increase from 33.2% to 45.1%, with transportation
and UZ had refurbished only 70 mineral carriers capacity of one freight car growing from 0.9 million
into grain carriers. tons-kilometers (tkm) to 1.8 million tkm annually,
and the productivity of freight locomotive — from
In May 2017, Ukraine’s National Security and 157.9 million tkm to 171 million tkm annually.
Defense Council (NSDC) banned the work in
Ukraine of several hundred Russian companies, To accomplish same by 2021, Ukraine’s Cabinet
including logistics companies. According to would need to spend USD848 million for 15,000
preliminary reports, the decision would have new grain wagons and for the modernization of
prevented about 2,000 grain wagons from 46,000 used wagons.
11IMF Group Ukraine
Emphasis was placed on procuring gondola 7,368 wagons, 7,050 of which are gondola cars,
wagons in UZ’s plan, which has yet to be approved 100 fitting platforms for transportation of freight
by Ukraine’s Cabinet. Currently, there is no containers and 137 grain trucks. The deficit
guarantee government and UZ will abdide by between the out-of-service wagons and the
the draft strategy. Election results in 2019 may volume of new purchases will, in turn, be covered
change UZ’s plans and the cost of upgrading the by major repairs and updating the inventory of
monopoly’s rolling stock. grain wagons over 2018. Some UAH 7.1 billion
was approved for the modernization of the freight
In the short term, however, UZ is ahead of the fleet of wagons.
temporary modernization map presented in
the strategy. According to the indicators of the
financial plan approved for 2018, UZ will purchase
12IMF Group Ukraine
04
Ukrzaliznytsia: forecast for PJSC Ivano-Frankovskcement during the first
increased demand for rail half of 2010 was the only buyer of the new long-
transportation distance freight diesel locomotive. In 2013, UZ
UZ’s grain wagon dilema is not the only obstacle bought a diesel locomotive ТE33А from the
to increasing grain transshipment for export. Kazakh plant Lokomotiv Kurastyr Zauyty produced
Agrarians will not be able to withdraw their cargo under a General Electric license. The plant began
from storage because of the chronic shortage of producing American diesel locomotives in 2009. By
locomotives. According to UZ managers, wear 2018, 311 diesel locomotives TE33A came off the
of the locomotive fleet is 97%, and of electric plant’s assembly line. Kazakhstani Railway was
locomotives — 90%. Due to a shortage of power the sole owner of Lokomotiv Kurastyr Zauyt until
traction, railcar productivity today is from 40-60% 2013, when on April 29 Russia’s Transmashholding
below its potential. Current grain transshipment bought 50% of the plant. General Electric bought
through railway stations amounts to only 38.5 the remaining shares in January 2017.
million tons, of 48.9 million tons required. UZ’
locomotive park is in critical condition. Following Russia’s invasion of Ukraine in 2014,
Luhanskteplovoz continued operations in
The state is responsible for updating the temporarily occupied territories of the region
monopoly’s obsolete locomotives, according to beyond Ukraine’s control. Ukraine SBU Security
Article 10 of the law «On Rail Transport,» adopted Service reported in 2015 that Luhanskteplovoz
in 1996. In practice, however, the State Budget equipment was shipped off to Russia, leaving
since Independence has never earmarked funds Ukraine without a single domestic diesel
for purchasing new UZ freight transportation locomotive manufacturer … and the unresolved
rolling stock. problem of updating the country’s locomotive
park.
UZ bought cargo locomotives in 2008, 45 electric
DE‑1 locomotives produced at the Dnipropetrovsk The chronic deterioration of UZ’s traction power
Electric Locomotive Plant. At the same time, the is vividly reflected in the productivity of UZ’s rolling
state company was unable to fulfill its initial plan stock. Since 2003, this indicator has increased
to purchase 145 electric locomotives and 25 diesel from 5.2 to 9.6 days, with the efficiency of wagon
locomotives for transshipment of goods in 2008- transportation dropping 41.4%. This makes it
2010. In 2011-2015, UZ planned to write off its 195 obvious that the lack of locomotives for UZ is
electric locomotives and 340 diesel locomotives, a much bigger problem than the monopoly’s
replacing them with 250 electric locomotives shortage of railcars.
and 25 diesel locomotives. The plan would have
cost UAH 12 billion, with Luhanskteplovoz plant
(privatized by Russian Transmashholding in 2010)
fulfilling the entire order. But during negotiations,
the Russians insisted that locomotives for UZ
would be manufactured by factories located
inside Russia. Ural Plant of Railway Engineering
produced 50 freight electric locomotives 2ES10
for the Lviv railway in 2012. But by early 2014, the
Russians produced only seven locomotives, which
UZ did not buy, due to Russia’s annexation of
Crimea and invasion of eastern Ukraine.
13IMF Group Ukraine
PRODUCTIVITYProduc�vity
USE RATE OFofUZ
use rate WAGON
UZ wagon PARK, 2003-2017
park, 2003-2017
Average period of freight wagon use (24 hrs) Cumula�ve rate of produc�vity use of wagon park (%)
12 40%
30%
Cumula�ve rate of produc�vity use of wagon park (%)
29,0% 9,6
Average period of freight wagon use (24 hrs)
10 9,56
20%
8,66
17,6%
8 7,55 10%
7,04
7,7%
6,32 5,84 6,27 5,85 6,15 0%
6,04
6 5,6
5,2 -4,1% -4,3%
4,76 -7,3% -10%
4,34 -8,9%
-11,4% -10,7%
4 -20%
-20,5%
-25,8% -30%
2
-35,3% -40%
-41,7% -41,4%
0 -50%
2003 2004 2005 2006 2007 2008 2009 2010 2011 2012 2013 2014 2015 2016 2017
Source: Ukrzaliznytsia
Although agrarians have in recent years been the for fossil fuels and metals (and the subsequent
main source of complaints about railroad capacity, collapse related-industries), have agrarians had
it is important to understand that another 26% the opportunity to export at least 70-75% of their
of the Ukrainian economy also actively uses crops by rail. As industrial output is restored,
railway transportation. Only because of external competition for limited railway resources will
economic factors and a sharp decline in prices intensify.
ДИ НА МИ К А ЖЕЛЕЗНОДОРОЖНЫ Х ПЕРЕВ ОЗОК В РА ЗРЕЗЕ
RAILWAY TRANSSHIPMENT BY ECONOMY SECTOR TREND 2013-2017 (%)
ОТРАСЛЕЙ , 2 0 1 3 -2 0 17 ( %)
59,2%
-4,6%
-15,3%
-22,6%
-32,7% -35,8%
-41,9% -43,0%
-57,3% -57,5% -53,7%
AL E TS ES
L R LS KE T S N
OR RA BE IA EN AB AI
CO C OR E ER CO SL GR
E DU IN IM
AT
M
C IT RO ON M S T CE ON
IR D M
RA LP AN IZE
R G IR
H OI DI
N
NT AL TIL IL
A IC ER
EM F BU
СH
Source: State Statistics Service of Ukraine
14IMF Group Ukraine
In order to predict correctly the shortage of UAH 1,195 billion (in 2010 prices), or by 19.6%. It is
locomotive traction over the next five years it obvious that, following the volume of real GDP, the
is necessary to take into account not only the demand for freight transportation of the railway
expected growth in grain production, but also will also grow. If we build a correlation model
the growth in demand for rail transportation as based on data for 2008-2017, we can see that real
Ukraine’s economy recovers. According to the GDP growth of 1 billion UAH. is accompanied by
official forecast of the International Monetary Fund an increase in the freight turnover of the railway
(IMF), by 2022 Ukraine’s real GDP will grow to by an average of 0.59 million tons.
CORRELATION OF VOLUME OF REAL GDP AND VOLUME OF RAIL FREIGHT
TRANSPORT, 2008-2017
600
500
Volume of rail transport (mn tons)
400
y = 0,5864x - 225,81
300 R² = 0,8945
200
100
0
850 900 950 1000 1050 1100 1150 1200 1250 1300
Real GDP (bn UAH)
Source: State Statistics Service of Ukraine, IMF group Ukraine
Total completed rail In order to fulfill the most accurate forecast for
shipments, 2017
Mn Total industry increasing the demand for freight transportation
Total tons share (%) by rail, we consider it expedient to forecast the
339,55 growth of potential freight turnover separately for
Anthracite coal 67,08 19,8%
each of the industries.
Oil and oil products 13,87 4,1%
Iron and manganese ore 70,21 20,7%
Ore colored 4,50 1,3%
Black metals 22,45 6,6%
Non-ferrous metals and their 0 0,0%
products
Timber 3,67 1,1%
Chemical and mineral fertilizers 12,53 3,7%
Chemicals 3,60 1,1%
Cars 0 0,0%
Vehicles and equipment 0 0,0%
Grain 36,86 10,9%
Coke 6,51 1,9%
Ferrous metal scrap 3,09 0,9%
Mineral construction materials 62,69 18,5%
Cement 6,42 1,9%
Salt 1,75 0,5%
Other 24,12 7,1%
Source: Ministry of Infrastructure of Ukraine
15IMF Group Ukraine
Ukraine’s Infrastructure ministry provides official chemical and mineral fertilizers are used in the
transport statistics for 16 commodity items, production of cereals, and cement and mineral
but it is easy to see that they represent the final building materials are used in construction. Thus,
products and components for the production all freight turnover by rail is divided into four
of only four industries that form 90% of the main branches: energy, agriculture, metallurgy
demand for rail transportation. Thus, coke and and construction. Other industries account for
iron ore are internal transportation to smelting only 32.5 million tonnes, or 10.1% of the total,
plants and ferrous metals products. Similarly, excluding transit.
RAILWAY TRANSPORT BY ECONOMY SECTOR
2017 (MN TONS, %)
RAILWAY TRANSPORT BY ECONOMY SECTOR 2017
(MN TONS, %)
Other; 32,5; 10%
Agriculture; 51,1; 16%
Construc�on; 68,8; 22%
Energy; 70,9; 22%
Metallurgy; 96,7; 30%
Source: Ministry of Infrastructure of Ukraine
4.1 Power Engineering years. Our group forecasted an increase in the
According to preliminary estimates, in 2017 turnover of coal and crude oil with petroleum
Ukraine consumed 25.3 million tons of oil, the coal products in two scenarios: a reduction in
equivalent of 44.1 million tons and the equivalent the consumption of these energy resources,
of 12.9 million tons of raw crude oil and petroleum respectively, the government’s energy strategy
products amounting to 4.8 million tons.. The until 2035, while maintaining the current level of
volume of rail transportation (excluding transit) of energy intensity and the structure of the energy
these energy resources in 2017 was 59.1 and 11.8 balance.
million tons, respectively.
Energostrategy‑2035 provides for changing the
To forecast the potential load of the energy sector structure of the energy balance towards renewable
on the railway, it is important to understand how energy sources and reducing consumption of
the energy intensity of Ukraine’s GDP and the coal and oil products by 2022 by 35% and 31%,
volume of real GDP will change in the next five respectively.
16IMF Group Ukraine
FORECAST VOLUME
ForecastOF ANTHRACITE
volume COAL
of anthracite coalAND
and oilOIL PRODUCTS
products to 2022,TO 2022,
ACCORDING TO ENERGOSTRATEGY-2035
according to Energostrategy-2035
Volume of coal consump�on (mn tons)
Volume of demand for crude oil and oil products (mn tons)
GDP energy output ra�o (toe per 1 thousand $)
35 0,282 0,280 0,30
0,260
GDP energy output ra�o (toe/$1 thousand)
29,7
Volume of consump�on (mn tons)
30 0,240
27,3 0,25
0,220
25,3
25 0,200 0,196
22,8 0,192
0,20
20,4
20 18,0
17,2
16,4 0,15
15
0,10
10
4,2 4,8 4,4 0,05
5 3,9 4,0 3,5 3,4 3,3
0 0,00
2015 2016 2017 2018 2019 2020 2021 2022
Source: Energy Ministry, Energy Strategy-2035, IMF group Ukraine
It is obvious that at such volumes of falling calculations, the volume of transportation of these
consumption of coal and crude oil with oil energy resources (without transit) will decrease
products, the volumes of their turnover from 70.9 million tons in 2017 to only 47.8 million
will accordingly decrease. According to our tons in 2022 or 32.6 percent.
Объем
TRANSPORT перевозки
VOLUME каменного COAL
FOR ANTHRACITE угля и нефтепродуктов,
AND OIL PRODUCTS AS PER
согласно Энергостратегии-2035
ENERGY STRATEGY-2035 (MN (млн.
TONS)тонн)
Volume of coal transported (mn tons, without transit)
Volume of crude oil and oil product transport (mn tons, without transit)
90
80
70
60
50
67,8 69,1
40 59,1 53,5
47,8
30 42,1 40,3 38,4
20
10
11,9 12,8 11,8 12,4 11,2 10,0 9,7 9,4
0
2015 2016 2017 2018 2019 2020 2021 2022
Source: State Statistics Service of Ukraine, IMF group of Ukraine
17IMF Group Ukraine
But in view of the fact that the Ministry of Energy the current level of energy intensity of GDP, the
lags behind the announced plans, we have fulfilled structure of the energy balance and the share of
an alternative forecast of the potential load of the industry in GDP.
energy sector for the railway, while maintaining
Объем
TRANSPORT перевозки
VOLUME каменного угля
FOR ANTHRACITE и нефтепродуктов
COAL при KEEPING
AND OIL PRODUCTS,
CURRENT
сохранении GDP ENERGY
текущего уровня OUTPUT RATIO (MN
энергоемкости TONS)тонн)
ВВП (млн.
Volume of coal transported (mn tons, without transit)
Volume of crude oil and oil product transport (mn tons, without transit)
90
80
70
60
50
68,7 71,5
67,8 69,1 66,3
62,1 64,1
40 59,1
30
20
10
11,9 12,8 11,8 12,2 12,6 13,0 13,5 14,0
0
2015 2016 2017 2018 2019 2020 2021 2022
Source: State Statistics Service of Ukraine, IMF group Ukraine
Under this scenario, the volumes of transportation of hard coal and crude oil with oil products will grow from
the current 59.1 and 11.8 million tons to 71.5 (+ 21%) and 14 (+ 18.6%) million tons in 2022 year respectively.
The total increase in the load on the railway will increase by 11.3 million tons of cargo turnover per year.
4.2 Metallurgy aggression of the Russian Federation. The basic
The volume of transportation of iron ore, coke assumption for forecasting the increase in the
and ferrous metals by the railway today is demand of the metallurgical industry for rail
96.7 million tons or 30.2% of the total volume transportation is the World Bank’s forecast for
of cargo turnover. At the same time, Ukrainian world metal prices, namely, iron ore, whose price
metallurgy is now simultaneously in two crises: is most closely correlated with the growth rate of
external economic, connected with the cycle of metallurgy in Ukraine.
falling metal prices and internal, caused by the
18IMF Group Ukraine
WORLD PRICE TRENDS
ДИ НА МИ К АFOR
МЫMETALS
РОВ Ы ХAND
Ц ЕНRATE OF GROWTH
НА ЖЕЛЕЗНУ OF METALLURGY
Ю РУДУ
И ТЕМПЫ РОСТА МЕТА SECTOR (%)ЧЕСКОЙ ОТРАСЛИ ( %)
ЛЛУ РГИ
Trend for metal ores Metallurgical industry trend
100% 30%
21,3%
80% 20%
14,3% 82,4%
METALLURGIACAL INDUSTRY TREND (%)
12,0% 77,4% 12,2%11,0%
PRICE TRENDS FOR METAL ORES (%)
60% 71,5% 8,9%
6,9% 6,8% 10%
4,9% 3,9% 3,6% 3,6%
40% 0,2% 0,8%
0%
-1,5% -1,1% -0,1%
20% 26,8% -3,5%
-5,3% 22,8%
18,6% -10%
15,0%
0% 9,0% -11,4%
4,3% 4,3% 6,7% 5,3% 4,6%
-14,5% 1,6% 1,8%
-2,4% -16,1% -20%
-6,3%-8,3%
-20% -10,8%
-23,4%
-40% -28,8% -28,4% -30%
-42,4%
-60% -48,7% -40%
2000 2001 2002 2003 2004 2005 2006 2007 2008 2009 2010 2011 2012 2013 2014 2015 2016 2017 2018 2019 2020 2021 2022
Source: World Bank, State Statistics Service Ukraine
Thus, according to the forecast of the World 4.3 Construction
Bank, by 2022 the world prices for iron ore are In the last 3 years, Ukraine has been experiencing
expected to decrease smoothly from the current a construction boom, which led to a corresponding
65 to 56.9 dollars per ton. Accordingly, from the increase in volumes of internal cement
world conjuncture Ukrainian metallurgy expects transportation — up to 6.4 million tons (+ 15.2% by
a decrease in profitability and production volumes 2015) and mineral building materials — up to 62.4
in the next 5 years. However, the stabilization of million tons. (+ 11.6% by the 2015th year).
the conflict in the East, the ownership of business As the previous statistics for the year 2018 show
processes, excessive capacity in this industry and (–0.8% for January-April), this year we can face
cheap labor, according to our assumption, will a reduction in construction volumes by about
allow Ukrainian metallurgists in the unoccupied 2%. Starting in 2019, the construction industry in
territories in the next 5 years to increase Ukraine is likely to face the need to raise prices to
production volumes to the level of 2013. Thus, we a new level of production costs. So, for today up to
will see the average annual rate of growth in the 80% of real estate in the primary market is sold
smelting of metals and products from them at at a cost, calculated even on the basis of 8 UAH
5.4%, and the volume of potential demand for rail / USD. Therefore, in 2019-2020 we will face the
transportation by metallurgists will grow from same situation as in 2011-2012, when with the
the current 96.7 million tons to 126 million tons general growth of the economy — construction
in 2022 year. will be in a state of recession. Recovery,
according to our forecast will begin in 2021, and
will traditionally be higher than the growth rate
of real GDP. With our assessments agree and the
CEO of the largest development companies in
Ukraine.
19IMF Group Ukraine
GROWTH TRENDS FOR REAL GDP AND CONSTRUCTION (%)
ТЕМПЫ РОСТА РЕА ЛЬНОГО ВВП И СТРОИТЕЛЬСТВА (% )
40% Construction growth (%) Real GDP growth (%)
30% 28,2% 26,9%
21,0%
20%
14,2%
10% 15,1% 6,9%
11,8% 5,5% 5,1%
9,5%
7,6% 8,2% 1,2%
4,0%
0% 5,3% 3,7%
3,1% 2,2% 3,5% 2,3% 2,5% 3,2% 3,3% 3,5%
0,6% 0,3%
0,2% 0,0%
-2,6% -2,0% -3,5%
-10% -6,6% -7,0%
-9,9% -9,8%
-13,3% -13,6%
-20% -15,1%
-19,7% -18,4%
-30%
-29,1%
-40%
-42,5%
-50%
2002 2003 2004 2005 2006 2007 2008 2009 2010 2011 2012 2013 2014 2015 2016 2017 2018 2019 2020 2021 2022
Source: IMF, State Statistics Service of Ukraine, IMF group Ukraine
Accordingly, domestic demand for building supplies will completely cover the difference
materials and their transportation by rail within between the shrinking domestic demand and
the next five years should not exceed current current production volumes.
values. But the Ukrainian producers of building
materials have already managed to gain a foothold In the end, according to our forecast, producers
in foreign markets. In 2017, out of 62.4 million tons of cement and mineral building materials, which
of cargo turnover of construction materials — form 21.5% of the freight turnover of the railway,
17.4 million tons or 27.8% of mineral building will be able to reorient to foreign markets in
materials were exported. For cement, the share 2018-2020, and starting from 2021 — to increase
of shipments for exports is lower and only 4.2%, production volumes, respectively, to the growth
but the existing potential for increasing its export rates of construction volumes.
Потенциальные объемы перевозки мин.
POTENTIAL строительных
VOLUMES OF RAILматериалов
TRANSPORTATION OF CONSTRUCTION
и цемента железнойMATERIALS
AND CEMENT
дорогой (MNтонн)
(млн. TONS)
Volume of rail cement transportation Volume of construction material transport Total demand volume
77,4
73,6
68,8 68,8 68,8 68,8
66,7 70,1
62,4 62,4 62,4 62,4
6,4 6,4 6,4 6,4 6,9 7,2
2017 2018 2019 2020 2021 2022
Source: State Statistics Service of Ukraine, IMF group Ukraine
20IMF Group Ukraine
4.4 The agricultural sector not increase and will remain at the current level of
According to the common methodology, we 3.7 million tons. And the domestic cargo turnover
attributed to the demand of agriculture for rail of chemical and mineral fertilizers of 11.6 million
transportation: domestic and export volumes of tons will grow in direct proportion to the level
grain transportation, volumes of timber exports and of cereals production, and by 2022, depending
internal freight turnover of chemical and mineral on the scenario of yield increase, it can grow to
fertilizers used in the production of cereals. 16 (+ 37.9%) or 20.2 (+ 74.1%) million tons.
Obviously, due to the current moratorium on the Thus, the total volume of potential agricultural
export of round timber and the government’s demand for rail transport by the year 2022 can
intention to limit deforestation — the volume of grow from the current 52.4 to 70 or 95 million
demand for the transportation of timber cargo will tons of annual traffic.
О Б ЪЕМ
VOLUME П О ТЕН ЦИАЛDEMAND
OF POTENTIAL ЬНОГО С ПFOR РОСА НА П
RAIL ЕРЕВ ОЗКИ В IN
TRANSPORT С ЕЛ Ь СКОМ
AGRICULTURE
ХО(MN
ЗЯ ЙСTONS,
ТВЕ, МSCENARIO
Л Н. ТО НН : 1:
7 9, 3 М Л Н. ТО Н Н УРО ЖАЯ ЗЕРН
79,3 MN TONS GRAIN HARVEST) ОВЫХ
Volume of grain transport Volume of chemical fertilizer transport
Volume of lumber transport Total demand for AIC transport (mn tons)
69,67
65,29
2,95
61,12
57,14 2,95
53,34 2,95 16,0
52,35
2,95 15,3
2,95 2,95 14,6
13,9
12,5 13,3
50,67
43,56 47,03
36,86 37,09 40,25
2017 2018 2019 2020 2021 2022
Source: Ministry of Infrastructure of Ukraine , IMF group Ukraine
О Б ЪЕМ
VOLUME П О ТЕН ЦИАЛDEMAND
OF POTENTIAL ЬНОГО С ПFOR
РОСА Н А TRANSPORT
RAIL П ЕРЕВ ОЗКИ ВIN
С ЕЛ Ь СКОМ
AGRICULTURE
ХО(MN
ЗЯ ЙСTONS,
ТВЕ, МSCENARIO
Л Н. ТО НН :2:
1 00 М Л Н. ТО НН УРО ЖАЯ ЗЕРН
100 MN TONS GRAIN HARVEST) ОВЫХ
Volume of grain transport Volume of chemical fertilizer transport
Volume of lumber transport Total demand for AIC transport (mn tons)
94,49
2,95
83,51
73,54 2,95 20,2
64,48 2,95 18,4
56,24 2,95 16,7
52,35
2,95 15,2
2,95
13,8
12,5
71,3
62,2
53,9
46,3
36,9 39,5
2017 2018 2019 2020 2021 2022
Source: Ministry of Infrastructure of Ukraine , IMF group Ukraine
21IMF Group Ukraine
4.5 Other Volume of transport of other materials
For the year 2017, the volume of railway in 2017 (mn tons)
transportation of other cargo, excluding transit, Mn
Total Weight (%)
tons
amounted to 32.4 million tons.
32,41
Colored ore 4,50 13,9%
Using the regression equation presented at Non-ferrous metals and their 0 0,1%
the beginning of this section, which shows the products
Chemical substances 3,60 11,1%
relationship between the volume of real GDP
Cars 0 0,2%
and freight traffic, we calculated the potential Vehicles and equipment 0 0,3%
growth in the turnover of other industries for rail Other loads 24,12 74,4%
transportation by 2022.
Source: Ministry of Infrastructure of Ukraine
Потенциальный рост
POTENTIAL VOLUME объемов
DEMAND спроса
GROWTH на ЖД-
FOR RAIL
перевозки других
TRANSPORTATION остраслей
OF OTHER (млн.
SECTORS тонн)
(MN TONS)
41,6
39,4
37,4
35,6
34,0
32,5
2017 2018 2019 2020 2021 2022
Source: Ministry of Infrastructure of Ukraine, IMF group Ukraine
22IMF Group Ukraine
4.6 Forecast of the total volume of and GDP energy intensity dynamics. Thus, with
demand for rail transportation by 2022 the growth of grain yield to 79.3 million tons and
Thus, summing up the forecast freight turnover the follow-up of Energostrategy‑2035 by 2022,
of the railways in each of the key industries, we the volume of demand for rail transportation will
can calculate the total volume of potential load on amount to 393.3 million tons. (+15.8%).
Ukrzaliznytsya under each scenario of yield growth
Scenario
SCENARIO 1: Forecast
1: FORECAST of the
OF THE totalVOLUME
TOTAL volume OFofDEMAND
demand forRAIL
FOR
rail transportationBY
TRANSPORTATION by2022
2022
Metals Energy Construc�on materials
AIC Other sectors Transit and current AIC deficit
Overall volume demand (mn tons)
400 400,0
31 393
350 31
Overall volume demand (mn tons)
31 31 378 42 390,0
31 31 39
32 34 36 37
300
380,0
By sector (mn tons)
65 70
250 52 53 57 61
364
370,0
200 69 69 69 74 77
359 69
360,0
150 355 48
352 59 52 50
71 66 350,0
100
108 113 120 126 340,0
50 97 102
0 330,0
2017 2018 2019 2020 2021 2022
Source: IMF group Ukraine
With the growth of grain yields to 100 million tons and the maintenance of the current energy intensity of GDP
and the structure of the energy balance, the potential volume of railway traffic will grow to 455.7 million tons
(+ 34.2%) by 2022.
Scenario2:2:FORECAST
SCENARIO Forecast VOLUME
volumeDEMAND
demandFOR
forRAIL
rail freight
FREIGHT
shipments
SHIPMENTS(mn tons)
(MN TONS)
Metals Energy Construc�on materials
AIC Other sectors Transit and current AIC deficit
Overall volume demand (mn tons)
500 470
456
450
Overall volume demand (mn tons)
31 450
31 429
400 42
31 39
31
By sector (mn tons)
350 31 37 430
31 36 403
34 84 94
300 32 74
56 64 410
52 77
250 384 74
69 69
69 69 390
200
366 86
150 77 79 82
71 370
352 74
100
120 126 350
50 97 102 108 113
0 330
2017 2018 2019 2020 2021 2022
Source: IMF group Ukraine
23IMF Group Ukraine
05
Ukrzaliznytsia capacity is generally an optimistic assumption, by 2022
forecast for grain only 474 locomotives will remain at UZ’s disposal
transportation (leaving 504, because UZ has already contracted
Ukraine’s locomotive park is already operating with General Electric for the supply of 30 diesel
at full capacity. Due to the deterioration of locomotives). That’s brings railway potential
locomotives, most will be out of use in five years transportation capacity to 290 million tons per
time. If we assume the locomotive dropout year.
rate remains at the level of 2012-2017, which
Ukrzaliznytsia locomo�ve
UKRZALIZNYTSIA park,
LOCOMOTIVE 2003-2022
PARK, 2003-2022
Electric trains Diesel trains All, including current GE contract
1200
1000
208
176
800
116
179 180 158 106
111
160 102 96 579 570
600 86 547 525
95 504
101 97
99 94 90 87 83
400 793 758
701 670
631 631 641 592 629 608
579 555 524 495 492 465 445 427
200 409 391
0
2003 2004 2005 2006 2007 2008 2009 2010 2011 2012 2013 2014 2015 2016 2017 2018 2019 2020 2021 2022
Source: Ukrzaliznytsia, IMF group Ukraine
At the current rate of decline and degradation, in 2022 — and a number of sub-industries will
UZ’s locomotive fleet could face possible collapse continue to use rail transportation in a ratio
if demand for transportation increases as early as below the standard, UZ will not be able to provide
2019 or 2020. cargo transportation for 102.4 million tons,
or 26% of the potential volume. The deficit of
If cereal production grows according to the traction capacity will equal 177 locomotives.
pessimistic scenario — up to 79.3 million tons
of gross harvest and 55.6 million tons of exports
24IMF Group Ukraine
Прогнозный дефицитTRACTION
LOCOMOTIVE локомотивных мощностей
DEFICIT (млн. тонн)
(MN TONS)
сценарий 1: 80 млн. тонн урожая зерновых, Энергостратегия-2035
SCENARIO 1: 80 MN TON OF GRAIN, ENERGO STRATEGY 2035
Current possible potential (mn tons shipments) Demand volume (mn tons)
Capacity deficit (mn tons) Compared current locomotive capacity (units)
Compared current locomotive capacity (units)
450 177 200
393
400 378 180
352 355 359 364
350
340 334 329 160
315
303131 291 140
300
120
mn ton
250
100
83
200
80
150 52 60
102
100 36 76 40
22 48
50 21 30 20
12
0 0
2017 2018 2019 2020 2021 2022
Source: IMF group Ukraine
If grain production proceeds according to the discount, UZ by 2022 will not be able to satisfy
optimistic scenario — up to 99.9 million tons of 187 million tons of extra freight forwarding
gross harvest and 76.2 million tons of exports in demand. UZ’s traction capacity deficit will equal
2022 — and industries resume using the railways be 397 locomotives.
as they did during 2012-2015, the current 10%
Прогнозный дефицит локомотивных мощностей (млн. тонн)
LOCOMOTIVE TRACTION DEFICIT (MN TONS) SCENARIO 2: 100 MN TONS OF GRAIN
сценарий 2: 100 млн. тонн урожая зерновых
Current possible potential (mn tons shipments) Demand volume (mn tons)
Capacity deficit (mn tons) Compared current locomotive capacity (units)
500 350
Compared current locomotive capacity (units)
456
450 429
403 286 300
400 384
366
350
340352 334 329 250
315 219
303 291
mn ton
300
200
250 152
150
200
165
96
150 126 100
100 56 88
55 50
50 22 32
12
0 0
2017 2018 2019 2020 2021 2022
Source: IMF group Ukraine
25IMF Group Ukraine
A special Railways Development Strategy for 2017- the revised strategy were presented to the public
2022 was drafted in order to avoid such a scenario last fall, but only in general terms. It is only known
and update UZ’s rolling stock. The public saw the that by 2021, USD4 billion has been earmarked
document in May 2017 and MEDT received it for to replenish railways rolling stock. MEDT and the
approval in July 2017. Cabinet have not received the revamped strategy
for approval..
According to the Strategy, UAH 150 billion will be
spent by 2021 for 52 freight diesel locomotives UZ’s financial plan for 2018 provides for the
and 170 electric locomotives (10 of which are purchase of 25 diesel locomotives from General
two-system passenger locomotives, 75 cargo Electric on the terms of financial leasing, as well
alternating current locomotives, 85 freight DC as five electric freight locomotives, with delivery in
and 40 two-system cargo cars). 2019. At the same time, the Cabinet has reported
that during 2017 13 locomotives literally burned
UZ managers, however, in September 2017 up on the tracks, due to obsolescence of the
withdrew the document for revision. Details of equipment or violations of operation rules.
Source: Ukrzaliznytsia
Calculations in this report coincide with UZ’s Railway capacity deficit (mn tons) under
Ukrzali Strategy 2017-2021
forecasts. According to same, the planned znytsia Scenario 1: (79,3 mn Scenario 2: (100 mn tons
increase in the productivity of locomotives by tons grain harvest) grain harvest)
2021 will increase by 15% (due to the fact that 2018 -11,6 -22,8
2019 +26,9 +2,0
new locomotives will be able to withstand a much
2020 +68,6 +29,2
greater load) and purchase of 262 locomotives, 2021 +98,7 +48,2
will prevent capacity shortage of capacities under 2022 +85,7 +23,2
both scenarios. Moreover, excess capacity of
Source: Ukrzaliznytsia, IMF group Ukraine
locomotive capacity will allow fulfilling orders for
transport even during the peak months of grain
export (February-March).
26IMF Group Ukraine
06
Technical aspects of In October of the same year, General Electric,
locomotive purchasing Ukraine’s Infrastructure Ministry and UZ officials
Renewal of UZ’s locomotive fleet signed a memorandum of cooperation. The
is complicated — and not only because of agreements were approved finally in February
insufficient funds for such purchases on the 2018, when UZ signed a multi-stage contract
state company’s account. Most of the world’s with General Electric, which must be completed
companies produce railway equipment for the by 2025. The first stage is the delivery of 30
European track width of 1,455 millimeters. In locomotives TE33A with localization of production
Ukraine, as in other countries of the former USSR, in Ukraine at the level of 10%. The first locomotive
the track gauge is 1.520 millimeters (why the should be delivered at the end of September 2018,
post-Soviet railways were called «1.520 space»). with the remainder by spring of 2019.
General Electric at its plants in the United States
produces bodywork for the Ukrainian TE33A Under the second stage, General Electric has to
together with all the equipment and 1,520mm- supply 150 diesel locomotives, with localization
track wheelbase will be joined by the Krukovka of production at 40% in Ukraine. The third stage
Carriage Works. provides for the modernization of 75 diesel
locomotives 2TE116 «Soviet-made.» All works
Theoretically, Ukraine can buy in the post-Soviet from the assembly of American diesel locomotives
countries a number of modern locomotives for and the modernization of Soviet 2TE116 will be
the «1520 space,» produced in cooperation with carried out at the Ukrainian Kriukov Carriage
Western firms. Under the license of the French Works.
company Alstom, the electric locomotive KZ8A,
designed for work with cargo trains with a mass UZ managers say the first three dozen TE33A
of up to 9,000, is produced at the Kazakh plant, produced by General Electric will be assigned
with the EP20 passenger electric locomotive at to the Melitopol depot to serve both grain
Russia’s Novocherkassk plant. Freight electric transportation to Odesa ports and work on
locomotives 2ES6, 2ES7 and 2ES10 are produced exporting metallurgical products from Donbas
under the license of Siemens at Russia’s Ural through Kamysh-Zorya-Volnovaha.
Locomotive plant. Russia’s machine-building giant
Transmashholding owns in all these enterprises, However, the problem of purchasing electric
from which the NSDC banned purchases until locomotives for freight transportation remains
2020. unresolved. It was planned that in June 2017 the
Chinese Datun Electric Locomotive Plant would
Ukraine theoretically can buy a number of transfer to Ukraine a test cargo locomotive of
electric locomotives VL11M6, a modification of alternating current with the possible subsequent
the Soviet locomotive, in Georgia In 2008-2011, purchase of a consignment of electric locomotives.
Ukrzaliznytsia bought 26 such locomotives from Belarusian Railways In 2012-2017 received from
the Tbilisi Electric Locomotive Plant. Production this Chinese enterprise 30 electric locomotives
there now belongs to the Russian company with a capacity of 13.05 thousand horsepower of
Dortechkomplekt, which was not put on the NSDC the brand BKG (Belarusian-Chinese cargo).
sanctions list. The purchase of locomotives from
a plant owned by a Russian owner may not be Also in July 2017, the Ministry of Infrastructure
welcomed by Ukraine’s public. Moreover, the planned to negotiate with its Georgian
VL11M6 locomotive is already obsolete with a counterparts about the lease of 40 electric
carrying capacity 40% lower than the Russian locomotives produced by the Tbilisi Electric
2ES10. Locomotive Plant. Nothing yet has come of the
plans.
General Electric offered its services for the supply
of diesel locomotives in 2016 to UZ, which tested UZ managers in March 2018 planned talks with
the TE33A mentioned earlier. The locomotive Siemens on the joint production of electric
hauled 32 cargo shipments between July and locomotives. However, Siemens’ representative
September 2016. office in Kyiv, mindful of the unsuccessful
cooperation experience with Ukraine during
27IMF Group Ukraine
the 2000s, backed out of the talks. The German Come what may, UZ managers expect to
Dnipropetrovsk Carriage Works previously was purchase 225 electric locomotives by 2025.
under contract to build 120 passenger electric According to the National Infrastructure
locomotives.. In reality, the railway ordered only Development Strategy until 2035, the railways
21 locomotives, most of which are idle or non- will have 100% new locomotives supplied by
operational the world’s largest manufacturers of railway
machinery Almstom, Bombardier, and the
aforementioned Siemens and Kriukov Carriage
Works.
28IMF Group Ukraine
07
Potential economic losses In 2015-2017, due to UZ’s shortage of capacities
due to deficit of railway in grain transshipment, agrarians on average
transport by industry sector were forced to deliver up to 27% of their export
The average weighted length of grain crops by road.
transportation from local elevators to ports today
is 631 km. The cost of railway transportation Indeed, in parallel to rail and road, there is also
for this distance is traditionally tied to the dollar river transport, the tariffs of which are quite
rate and is about $10 per ton. At the same time, acceptable for agrarians. However, due to the low
logistics companies can offer the farmer an level of the merchant fleet, the volume of annual
alternative in the form of delivery by road, with an transshipment using internal grain transportation
average tariff of UAH 1.7/km. per ton. by river transport is on average 385,000 tons
annually.
Based on the initial data, it is easy to calculate
that for a similar distance, road delivery will cost
the farmer $41.3, or 4-fold more than by rail.
Grain export delivery structure by type of
transport (mn tons), 2017
GRAIN EXPORT DELIVERY STRUCTURE BY TYPE OF
TRANSPORT (MN TONS), 2017
Railway (74,7%) River (0,8%) Roadway (24,5%)
10,25
0,33
31,2
Source: Ukrzaliznytsya, State Statistics Service Ukraine
In our opinion, it will be quite correct to calculate the amount of profit received by farmers from the
overpayment for the delivery of grain by road as a negative effect of the shortage of the UZ transshipment
capacity for the AIC. In 2017 year, this amounted to USD320.7 million.
Grain loading volume for road transport Overpayment by agrarians due tu UZ capacity deficit
Period (mn tons) bn UAH USD equivalent
2013 4,23 (mn USD) 132,5
2014 7,52 2,67 225,5
2015 10,62 7,24 332,5
2016 11,97 9,57 374,7
2017 10,25 8,52 320,7
Source: Ukrzaliznytsia, IMF group Ukraine
29IMF Group Ukraine
Already today, the lost profit due to problems Under the first scenario — an increase in the
with logistics makes for the AIC $321 mn, production of cereals by 2022 to 79.3 million tons.
or 2.5% of the added value that the industry the potential volume of grain transshipment by
generates. The low level of labor costs still road trains in the next five years will grow from the
allows agrarians to raise grain collections. current 10.3 to 28.9 million tons (+180%).
However, due to competition with recipient
countries of labor migrants from Ukraine, this SCENARIO -1 79,3 MN TONS GRAIN
competitive advantage will soon disappear. With HARVEST TO 2022
By means of delivery (mn
this development of the situation — Ukrainian Period Export tons)
(mn tons)
farmers will have to reduce production volumes, Rail Auto
to a level that will ensure the former profitability. 2013 27,8 23,2 4,6
2014 33,4 25,8 7,6
2015 38,3 27,3 11
To calculate the potential losses of agriculture 2016 41,5 29 12,4
and the Ukrainian economy as a whole from the 2017 41,8 31,2 10,6
refusal of the Government and the leadership 2018 42 29,4 12,6
of Ukrzaliznytsia to adhere to the current 2019 45,2 28,6 16,6
2020 48,5 27,1 21,4
program for the modernization and renewal of
2021 52 25 27
the locomotive structure, we make the basic 2022 55,6 23,1 32,5
assumption that the negative effect of a traction
deficit will be evenly distributed among all sectors Source: State Statistics Service of Ukraine,
IMF group Ukraine
that form demand for freight.
7.1 The agricultural sector Even taking into account the positive forecast of
According to our calculations, the average the dynamics of world grain prices, (+17.8% by
profitability of grain production in Ukraine for 2022), the ratio of costs for the delivery of crops
2000-2016 in dollar terms was 11%. We believe to ports in the total cost of its purchases in the
that with a long-term deviation of the actual domestic market will grow from the average
profitability from this level, medium-sized for the years 2000-2016 in 10% — up to 19,3%
enterprises and large agro-holdings will begin to in 2022.. Although traders mainly deal with the
reduce investment in the agro-industrial complex delivery to the ports and sale of the harvest, in
and move capital to other sectors, with a more the absolutely competitive market, in the end,
optimal ratio of profitability to risk. additional logistics costs will still fall on the
producer.
With a potential reduction in the capacity of
agrarians to transship grain to ports through the Under the first scenario, increasing the grain yield
railway (due to an even distribution of the deficit to 79.3 million tons by 2022, the ratio of the cost of
of locomotive capacities across all sectors) and grain delivery to their purchases in the domestic
increase in grain production to 79.3 or 100 million market will grow to 19.3%, reducing the potential
tons by 2022, which will be wholly exported, — the profitability of farmers from an average of 11% to
specific gravity of grain handling by trucks will 1.7%. Obviously, in practice, profitability will be
start to grow at an accelerated rate: up to 58- balanced by a decrease in production and will
73%, depending on the scenario of yield growth. remain at the current level. The forecast volume
Obviously, with an average price gap between the of underproduction of cereals in 2022 will be 18.4
cost of delivering grain by rail and road train by million tons, or $3.77 billion. .
4 times — the specific weight of logistics costs
will increase and reduce the final profitability.
We believe that farmers will balance the volumes
of production and delivery of grain, by reducing
them, to a level that will allow them to return to
profitability of 11%.
30You can also read