Toxicology of tramadol following chronic exposure based on metabolomics of the cerebrum in mice - Nature
←
→
Page content transcription
If your browser does not render page correctly, please read the page content below
www.nature.com/scientificreports
OPEN Toxicology of tramadol
following chronic exposure based
on metabolomics of the cerebrum
in mice
Wei Xia1,3, Guojie Liu2,3, Ziyi Shao1, Enyu Xu1, Huiya Yuan1, Junting Liu1 & Lina Gao1*
Tramadol is an opioid used as an analgesic for treating moderate or severe pain. The long-term use
of tramadol can induce several adverse effects. The toxicological mechanism of tramadol abuse is
unclear. Metabolomics is a very useful method for investigating the toxicology of drug abuse. We
investigated the impact of chronic tramadol administration on the cerebrum of mice, focusing on the
metabolites after tramadol administration. The mice received 20 or 50 mg/kg body weight tramadol
dissolved in physiological saline daily for 5 weeks via oral gavage. Compared with the control group,
the low dose tramadol group showed seven potential biomarkers, including gamma-hydroxybutyric
acid, succinate semialdehyde, and methylmalonic acid, which were either up- or down-regulated.
Compared with the control group, the high dose tramadol group showed ten potential biomarkers,
including gamma-hydroxybutyric acid, glutamine, and O-phosphorylethanolamine, which were
either up- or down-regulated. The up-regulated gamma-hydroxybutyric acid and the down-
regulated succinate semialdehyde revealed that the neurotransmitter system was disrupted after
tramadol abuse. Compared with the low dose tramadol group, there were twenty-nine potential
biomarkers in the high dose tramadol group, mainly related to the pentose phosphate pathway
and glycerophospholipid metabolism. In conclusion, metabolomics in the tramadol abuse group
demonstrated that long-term tramadol abuse can result in oxidative damage, inflammation, and
disruption of the GABA neurotransmitter system, which will help to elucidate the toxicology of
tramadol abuse.
Tramadol is an effective analgesic agent for the treatment of moderately severe pain1. Tramadol is considered
to exert analgesic effects by binding the μ-opioid receptors and modulating the noradrenergic, GABAergic and
serotonergic systems2, 3, or by acting as a serotonin-norepinephrine (NE) reuptake inhibitor4. Tramadol in clini-
cal not only can be used in general surgery, obstetrics, pediatrics and the treatment of oral surgery, as well as
a variety of acute postoperative pain, is also used to relieve chronic pain, such as cancer5. Because its analgesic
action time is longer;its analgesia intensity decreased slowly, it is a relatively ideal drug for chronic pain medi-
cation.Most common side effects of tramadol include nausea, vomiting, sweating, fatigue, s edation6, 7, and dry
mouth8. More severe side effects include angioedema, increased effect of anticoagulants, h ypoglycemia7, 9 and
8
serotonin toxicity .Tramadol was identified as a controlled substance in the USA and UK (schedule IV drug)
in 201410, 11, and is also a controlled psychotropic substance in China, as more young people are abusing it to
obtain psychological satisfaction. Having a lower affinity for the μ-opioid receptor, Tramadol has shown to have
a lower risk for addiction with chronic use when compared with other opiates e.g. morphine and o xycodone9, 12.
12–14 4
Thus, many studies on the risks of opioid abuse have excluded tramadol . Mohamed HM reported that
chronic exposure to tramadol induces oxidative damage, inflammation, and apoptosis. However, little research
on long-term tramadol a buse4 has been reported. Moreover, the toxicity mechanism of long-term exposure to
tramadol is unclear.
1
School of Forensic Medicine, China Medical University, No. 77 Puhe Road, Shenbei New District,
Shenyang 110014, China. 2School of Fundamental Sciences, China Medical University, Shenyang 110014,
China. 3These authors contributed equally: Wei Xia and Guojie Liu. *email: gaolina0114@sina.com
Scientific Reports | (2020) 10:11130 | https://doi.org/10.1038/s41598-020-67974-8 1
Vol.:(0123456789)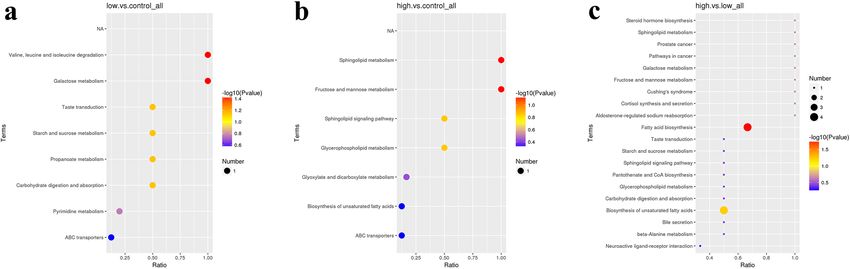
www.nature.com/scientificreports/
Metabolome refers to the collection of all small molecular weight metabolites of an organism or cell in a
specific physiological period, and generally refers to small molecular metabolites with a relative molecular
weight less than about 1,000 Da15. The purpose of metabolomics is to investigate metabolite changes in biological
systems (cells, tissues, etc.) after stimulation or disturbance16. By screening the different metabolites between the
experimental group and the control group, the biological processes associated with differential metabolites can be
studied to reveal the mechanism of life activities involved. Metabolomics is an omics that is closer to phenotype,
which can reflect the physiological state of an organism more directly and accurately. Recently, metabolomics
has been used to investigate the mechanisms involved in poisoning or drug a buse17.
As more young people are abusing tramadol to obtain the “high”, it is essential to research the tramadol’s
effects on cerebrum. In this study, we observed the changes of metabolites in the cerebrum of mice with chronic
exposure to tramdol to investigate the toxicology and the potential adverse reactions of tramadol using the
metabolomics.
Materials and methods
Chemicals and reagents. HPLC-grade methanol was obtained from the CNW Technology Company
(Beijing, China). Pyridine and methylhydroxylamine hydrochloride were purchased from Adamas Industrial,
Inc. (Shanghai, China). l-2-Chlorphenylalanine (purity > 98%) was obtained from Hengbai Biotechnology
Company (Shanghai, China). BSTFA (with 1% TMCS, v/v) was purchased from Regis Technology (Shanghai,
China). The BCA protein assay kit and total superoxide dismutase (SOD) activity detection kit were obtained
from Beyotime Biological Reagent Co., Ltd. (Shanghai, China). The malondialdehyde (MDA) detection kits
were purchased from BestBio Biological Reagent Co., Ltd. (Shanghai, China). GC–MS testing was conducted by
Novogena Co.,Ltd. (Beijing, China).
Instrumentation and conditions. According to the methods published by Gao et al. 18, we set the param-
eters as following: Agilent 7,890 gas chromatography (Agilent Technologies, USA) was coupled with a Pegasus
HT time-of-flight mass spectrometer (LECO Corporation, USA). The DB-5MS column (30 m × 0.25 mm,
0.25 μm film thickness) was from J&W Scientific (Folsom, CA, USA). A 1 μL aliquot of the analyte was injected
in splitless mode. Helium was used as the carrier gas, the front inlet purge flow was 3 mL/min, and the gas flow
rate through the column was 1 mL/ min. The initial temperature was maintained at 50℃ for 1 min, then raised
to 310℃ at a rate of 20℃/min, then maintained at 310℃ for 6 min. The injection, transfer line, and ion source
temperatures were 280℃, 280℃, and 250℃, respectively. The energy in the electron impact mode was 70 eV. The
mass spectrometry data were acquired in full-scan mode with the m/z range of 50–500 at a rate of 12.5 spectra
per second after a solvent delay of 4.8 min.
Animal treatment and sample collection. Kunming mice (originated from Swiss mice, Changsheng
Biotechnology Co., Ltd. Shenyang, China) with a body weight of 35 ± 5 g were used in this study. Eighteen
male mice were randomly divided into three groups, including the control group (n = 6), the low dose tramadol
group (n = 6) and the high dose tramadol group (n = 6). The mice were fed according to the breeding regula-
tions and adapted to the environment for 1 week. All mice were housed at the Laboratory Animal Research
Center of China Medical University at a temperature of 22℃ and a natural light–dark cycle. All experimental
procedures were conducted according to the Institutional Animal Care guidelines and were approved as ethical
by the Administration Committee of Experimental Animals at the Laboratory Animal Center of China Medical
University No. 20181027.
Experimental design. The animals were randomly allocated into three groups (n = 6) as follows:
Group I (control): Mice received physiological saline via oral gavage daily for 5 weeks.
Group II (20 mg tramadol): mice received 20 mg/kg/day tramadol dissolved in physiological saline via oral
gavage for 5 weeks.
Group III (50 mg tramadol): mice received 50 mg/kg/day tramadol dissolved in physiological saline via oral
gavage for 5 weeks.
The dosage of tramadol was adjusted according to changes in body weight. At the end of the experiment, the
mice were euthanized via compressed gas in their home cage by trained personnel. Death was confirmed after
checking for lack of respiration and faded eye color in each mouse. The brain was excised and the cerebrum
quickly separated. Parts of the cerebral cortex were stored at − 80 °C for detection of SOD activity and MDA
content. Parts of the cerebral cortex were homogenized in cold phosphate-buffered saline (PBS), centrifuged,
and the clear homogenate was collected for biochemical assays.
Mice were administered tramadol, which induced seizure-like activity. The frequencies of specific observation
criteria of seizure-like activity were recorded in a composite manner based on observations spanning the first
3 h after administration on the thrity-fifth day after tramadol administration. The frequencies were summed to
obtain the most representative seizure severity score. The criteria comprised facial movements, head nodding,
forelimb clonus, jerky movements, falling and clonic s eizures19.
Metabolite extraction. Sample preparation for untargeted metabolomic profiling was carried out as
described by Gao et al. 18. Take50 ± 1 mg cerebrum sample into the 2 ml EP tubes, extracted with 450µL extrac-
tion liquid (V methanol:V chloroform = 3:1), add 10 µl of L-2-chlorophenylalanine (1 mg/ml stock in dH2O) as
Scientific Reports | (2020) 10:11130 | https://doi.org/10.1038/s41598-020-67974-8 2
Vol:.(1234567890)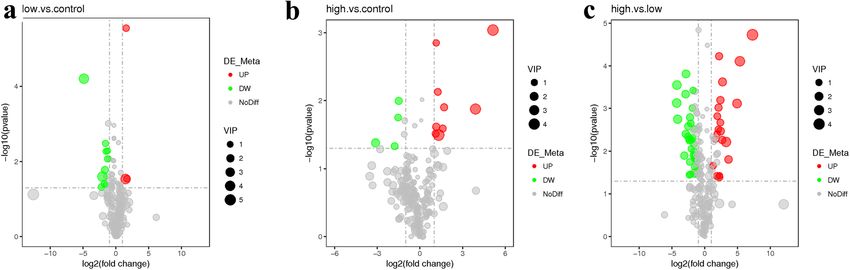
www.nature.com/scientificreports/
internal standard, vortex mixing for 30 s; homogenized in ball mill for 4 min at 45 Hz, then ultrasound treated
for 5 min (incubated in ice water); centrifuge for 15 min at 12000 rpm 4℃; transfer the supernatant 200 µL into
a fresh 1.5 ml EP tubes. The supernatant was completely dried in a vacuum concentrator without heating; 60 μL
methoxyamine hydrochloride (20 mg/mL in pyridine) was added and then incubated for 30 min at 80℃. Next,
80 μL of BSTFA reagent (1% TMCS, v/v) was added to the sample aliquots, and incubated for 1.5 h at 70℃. All
samples were analyzed by gas chromatography coupled to a Pegasus HT time-of-flight mass spectrometer (GC-
TOF–MS).
Quantification of SOD and MDA in cerebrum homogenates. Levels of SOD and MDA in cerebrum
homogenates were evaluated using detection kits, according to the manufacturer’s instructions.
Data analysis. Chroma TOF 4.3X software (LECO Corporation) and the LECO-Fiehn Rtx5 database were
used for raw peaks exacting, data baseline filtering and calibration of the baseline, peak alignment, deconvolu-
tion analysis, peak identification, and integration of the peak a rea20. Both the mass spectrum match and reten-
tion index match were considered for the identification of the metabolites. Partial least squares (PLS) analysis
was performed at SIMCA-P (version 13.0, Umetrics, Sweden)21, 22. Different variables correlating with tramadol
toxicity were monitored as follows: first, the VIP value should be greater than 1.0. Second, to eliminate the prob-
ability of false positives, an adjusted P value from the nonparametric Mann–Whitney U test (PASW Statistics 19,
SPSS Inc., Chicago, IL, United States) should be lower than 0.0523. Third, the value of the area under the receiver
operating characteristic (AUC-ROC) curve was calculated in PASW Statistics 19 (SPSS Inc., Chicago, IL, United
States), and the variables were discarded when AUC-ROC ≤ 0.75. Moreover, the classification performance was
considered excellent when AUC-ROC > 0.9 24. Metabolite heat maps were produced in MultiExperiment View
(Version 4.9.0). The changes in metabolites in each group were shown by a volcano map. The Kyoto Encyclope-
dia of Genes and Genomes (KEGG) pathway database25–27 was used to perform enrichment pathway analysis of
differentially changed metabolites.
The levels of SOD and MDA were present as mean ± standard deviation (SD) and analyzed by SPSS 26.0 (SPSS
Inc., Chicago, USA). The one-way ANOVA testing was used and p < 0.05 was considered statistically significant.
Statement on the welfare of animals. All procedures performed in studies involving animals were in
accordance with the ethical standards of the institution or practice at which the studies were conducted (the
Administration Committee of Experimental Animals at the Laboratory Animal Center of China Medical Uni-
versity. 20181027).
Results
Effect of tramadol hydrochloride on seizure severity score in mice. Tramadol administration was
observed to cause the production of seizure-like behavioral syndrome in mice assessed by the frequency of
facial movements, head nodding, forelimb clonus, falling and clonic seizures. In addition, the severity caused by
tramadol was dose-dependent (Fig. 1).
Metabolomics results. Representative GC–MS results obtained from the cerebrum of mice are shown in
supplement Fig. 1. Detailed information, including peak assignment and multiplicity for the analyzed metabo-
lites are listed in Tables 1, 2, and 3.
The changes in metabolites among the groups were observed in the volcano map of differentially changed
metabolites, as shown in Fig. 2. From the supplement Fig. 2, there are significant different between any two
groups.
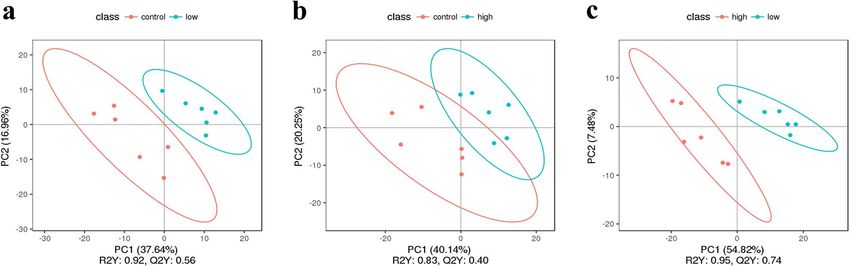
Partial Least Squares Discriminant Analysis (PLS-DA) is a supervised discriminant analysis statistical method.
This method uses partial least square regression to establish a model of the relationship between metabolite
expression and sample category to predict the sample category28. The PLS-DA model of each comparison group
was established, and the model evaluation parameters (R2, Q2) were obtained by sevenfold cross-validation
(seven cycles of interactive validation). If R2 and Q2 were close to 1, the model was more stable and reliable, as
shown in Fig. 3.
In order to judge the quality of the model, the model was also sorted to verify whether the model was "over-
fitting". The lack of "overfitting" indicates that the model can better describe the samples and can serve as the
premise for finding the biomarker group of the model, while "overfitting" indicates that the model is not suitable
for describing the samples and should not be used for later analysis of the data. When R2 is greater than Q2 and
the intercept of the Q2 regression equation with the Y-axis is less than zero, the model is reliable, as shown in
Fig. 4. Clustering, or Cluster analysis, involves grouping a set of objects in such a way that objects in the same
cluster are more similar to each other than to those in other clusters to some extent. As shown in Supplementary
Fig. 2, the high dose tramadol group, low dose tramadol group and the control group showed a clear separation
in the clustering analysis of metabolites.
We identified differentially changed metabolites between the following group comparisons: low dose tramadol
group vs. the control group (Table 1); high dose tramadol group vs. the control group (Table 2); high dose trama-
dol group vs. low dose tramadol group (Table 3). The differentially changed metabolites observed between the low
dose tramadol group and the control group mainly participated in valine, leucine and isoleucine degradation, and
galactose metabolism (Fig. 5a). As shown in Fig. 5b, these differentially changed metabolites mainly participated
in sphingolipid, fructose, and mannose metabolism in the high dose tramadol group and the control group. The
Scientific Reports | (2020) 10:11130 | https://doi.org/10.1038/s41598-020-67974-8 3
Vol.:(0123456789)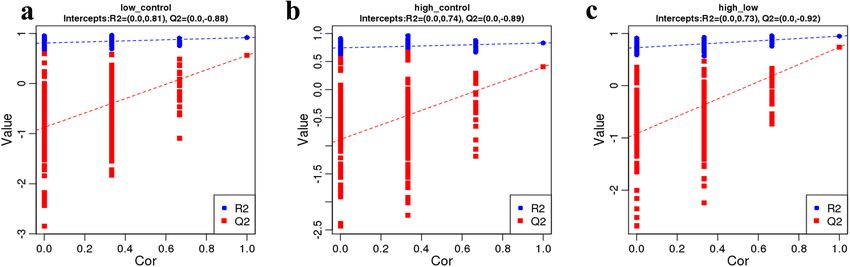
www.nature.com/scientificreports/
50
seizure severity score
40
30
20
10
0
ol
ol
ol
tr
ad
ad
on
am
am
C
tr
tr
kg
kg
g/
g/
m
m
20
50
Figure 1. Tramadol-induced seizures in mice were assessed in terms of the composite seizure severity score.
Values are expressed as mean ± S.E.M. Statistical analysis of the results was performed using one-way ANOVA.
There are significant difference (P ˂ 0.05) between any two groups.
No Name Pvalue ROC VIP Trend
1 Succinate semialdehyde 0.00538 0.916667 1.150771 Down
2 Lactic acid 0.008525 1 1.210481 Down
3 Phenylacetaldehyde 0.003297 0.944444 1.273551 Down
4 Methylmalonic acid 0.0052 0.916667 1.049064 Down
5 Alpha-Aminoadipic acid 2.83E-06 1 1.428335 Up
6 Monoolein 0.016790 0.888888 1.840082 Down
7 γ-Hydroxybutyric acid 0.029341 0.805556 4.068085 Up
Table 1. The distinguished different metabolites between the low dose group and the control group.
differentially changed metabolites observed between the high dose tramadol group and the low dose tramadol
group mainly participated in fatty acid biosynthesis and the biosynthesis of unsaturated fatty acids (Fig. 5c).
SOD activity and MDA content. Oxidative stress is a key factor that leads to mitochondrial damage. Oxi-
dative stress results in a significant increase in MDA levels as well as a decrease in SOD level. As shown in Fig. 6,
compared with those in the control group, the content of MDA in the brain tissue of the high tramadol group
was significantly higher, and the activity of SOD in the brain tissue was significantly lower (MDA (mmol/100 mg
protein) 53.8 ± 9.22 vs. 18.2 ± 1.77; and SOD (U/g protein) 6.17 ± 1.07 vs. 16.5 ± 2.43). Compared with that in
the control group, the content of MDA in the low tramadol group was significantly higher, and the activity of
SOD was significantly lower (MDA (mmol/100 mg protein) 36 ± 6.25 vs. 18.2 ± 1.77; and SOD (U/g protein)
9.67 ± 1.11 vs. 16.5 ± 2.43). There were significant differences in the MDA content and SOD activity between the
low tramadol group and the high tramadol group (MDA (mmol/100 mg protein) 36 ± 6.25 vs. 53.8 ± 9.22; SOD
(U/g protein) 9.67 ± 1.11 vs. 6.17 ± 1.07).
Discussion
Tramadol is a centrally acting analgesic used for the treatment of moderate-to-severe pain. Although tramadol
was classified as having a low abuse potential by the U.S. Drug Enforcement Agency, the adverse reactions related
to tramadol are still a concern. The present study investigated the effect of chronic tramadol administration on
the cerebrum of mice based on metabolomics, with a focus on oxidative stress and inflammation as adverse
reactions of tramadol.
With regard to the dosage of tramadol in animal experiments, we set the dose at 20 mg/kg and 50 mg/kg,
which was consistent with a previous s tudy29. Compared to the median lethal dose in mice (200–300 mg/kg),
the doses used in our animal experiments were lower; however, it is better to study the long-term side effects
of tramadol as a painkiller. Toxic reactions to tramadol, such as seizures and irritability, were observed in the
tramadol group 30.
PLS-DA (Fig. 3) indicated significant differences in metabolic patterns between any two groups (the control
group, the low and high dosage tramadol group). The PLS-DA graph confirmed that the model had good stability
and predictability. KEGG enrichment analysis (Fig. 5) revealed differences in the metabolic patterns between
any two groups. This was mainly reflected in the increase in the content of lactic acid, phenylacetaldehyde,
Scientific Reports | (2020) 10:11130 | https://doi.org/10.1038/s41598-020-67974-8 4
Vol:.(1234567890)www.nature.com/scientificreports/
No Name Pvalue ROC VIP Trend
1 Phosphatidyl ethanolamine 0.010121 0.916667 1.481372 Down
2 Fructose 0.046633 0.916667 1.423181 Down
3 Glutamine 0.04178 0.66666 2.10707 Down
4 Oxalic acid 0.001415 0.972222 1.084615 Up
5 Alpha-Aminoadipic acid 0.007458 0.833333 1.31662 Up
6 Myo-inositol 0.012556 0.888889 1.48524 Up
7 γ-Hydroxybutyric acid 0.032065 0.752222 4.38976 Up
8 Fructose 2,6-biphosphate 0.04663 0.91666 1.42318 Down
9 Fructose-6-phosphate 0.01255 0.88888 1.48524 Down
10 6-Phosphate gluconic acid 0.03075 0.83333 1.44251 Down
Table 2. The distinguished different metabolites between the high dose group and the control group.
No. Name_des Pvalue ROC VIP Up. Down
1 Glutamine 0.01263 0.916667 1.61973 Down
2 Phosphatidyl ethanolamine 0.001618 1 1.519291 Down
3 Fructose 0.030563 0.833333 1.211801 Down
4 Dehydroascorbic Acid 0.012467 1 1.282237 Down
5 Glucose 0.015118 0.944444 1.031273 Down
6 Galactose 0.01019 0.944444 1.263042 Down
7 Lysine 0.015042 0.888889 1.166203 Down
8 Mannitol 0.000155 0.972222 1.893367 Down
9 N-alpha-Acetyl-L-ornithine 0.014213 0.888889 1.254009 Down
10 Lipoic acid 0.012495 0.888889 1.235809 Down
11 Pantothenic acid 0.002624 0.944444 1.539796 Down
12 Gluconic acid 0.002237 0.972222 1.232332 Down
13 Fructose 2,6-biphosphate 0.000463 0.972222 1.722629 Down
14 5-Hydroxyindole-acetic acid 0.005185 0.944444 1.341267 Down
15 Oleic acid 0.000283 1 2.473685 Down
16 Stearic acid 0.004576 0.944444 1.370856 Down
17 Spermidine 0.005586 0.916667 1.269467 Down
18 Fructose-6-phosphate 0.001791 1 2.264901 Down
19 6-Phosphate gluconic acid 0.017809 0.888889 1.170693 Down
20 Pelargonic acid 0.000378 1 1.08774 Down
21 Thymine 0.034584 0.833333 1.092957 Down
22 Oxalic acid 5.98E-05 1 1.503521 Up
23 Azelaic acid 0.040329 0.833333 1.63793 Up
24 Sucrose 7.84E-05 1 3.291901 Up
25 Prostaglandin A2 0.005454 0.944444 1.511029 Up
26 Caprylic acid 0.037437 0.916667 1.059006 Up
27 Capric Acid 0.002148 1 1.303616 Up
28 γ-Hydroxybutyric acid 0.00391 1 1.01887 Up
29 N-Acetyl-L-leucine 0.006074 0.972222 3.048863 Up
Table 3. The distinguished different metabolites between the low and high dosage tramadol groups.
alpha-aminoadipic acid and the decrease in methylmalonic acid and monoolein which participate in valine,
leucine and isoleucine degradation, galactose metabolism, carbohydrate digestion and absorption in the low dose
tramadol group. As shown in Table 1, decreased Monoolein, a kind of glycerides of unsaturated fatty acids, may
be caused by oxidative damage. Aminoadipic acid (2-AAA), an intermediate metabolite of lysine metabolism,
could modulate insulin s ecretion31.
In the high dosage tramadol group, this was mainly reflected in the increase in oxalic acid, alpha-aminoadipic
acid, myo-inositol and the decrease in phosphatidyl ethanolamine and mannitol which participate in sphingolipid
metabolism, fructose and mannose metabolism, and the sphingolipid signaling pathway. From Table 2,decreased
fructose 2,6-biphosphate, fructose-6-phosphate and 6-phosphate gluconic acid, which take part in pentose phos-
phate pathway, indicated that the pentose phosphate pathway was activated to produce more NADPH to defense
Scientific Reports | (2020) 10:11130 | https://doi.org/10.1038/s41598-020-67974-8 5
Vol.:(0123456789)www.nature.com/scientificreports/
Figure 2. The volcano map of differentially changed metabolites between any two groups. (a) shows the
difference in metabolites between the low dose tramadol group and the control group; (b) shows the difference
in metabolites between the high dose tramadol group and the control group; (c) shows the difference
in metabolites between the high dose tramadol group and the low dose tramadol group. Red represents
up-regulation, green represents down-regulation, and gray represents no distinguishable difference between any
two groups. VIP represents the importance projection value of this substance obtained in the PLS-DA model.
Figure 3. PLS-DA score. (a) shows the PLS-DA between the low dose tramadol group and the control group;
(b) shows the PLS-DA between the high dose tramadol group and the control group; (c) shows the PLS-DA
between the high dose tramadol group and the low dose tramadol group.
oxidation damage.Down-regulated fructose indicated that the energy metabolism was disturbed when exposed
to high dosage tramadol (50 mg/kg). In the high dose tramadol group, up-regulated oxalic acid, the end product
of vitamin C, that can be used as an antioxidant for scavenging oxygen radicals, represented vitamin C consump-
tion after oxidative damage. Moreover, phosphatidyl ethanolamine was decreased during lipid peroxidation, and
was consistent with the detection of MDA. In this study, the oxidative damage caused by tramadol was reflected
by the determination of metabolites and MDA.Some r eference32 reported that myo-inositol was thought to pos-
sess anti-oxidant properties, its elevated contents may highlight the importance of oxidative stress in disrupted
balance of metabolic pathways.
From Fig. 2 and Table 3, it can be seen that there were more differentially changed metabolites between the
high dose tramadol group and the low dose tramadol group, which indicated a dose-dependent effect, and was
consistent with the content of MDA and SOD. Up- regulated oxalic acid and down-regulated dehydroascorbic
acid indicated that oxidative damage increase with the dose increasing. Other organic acids such as caprylic acid,
capric acid, pelargonic acid and azelaic acid, are also intermediates of fatty acid metabolism, were up regulated,
which may be related with fatty acid oxidation disorders33.With increased tramadol dose, fatty acid biosynthesis
and the biosynthesis of unsaturated fatty acids were disrupted, such as decreased oleic acid and stearic acid, which
also reflected the oxidative damage caused by tramadol. By measuring MDA and SOD, it can be seen that there
was a dose-dependent relationship, as shown in Fig. 6. Moreover, compared with the low dose tramadol group,
the pentose phosphate pathway (PPP) was stimulated in the high dose tramadol group. The decrease of intracel-
lular fructose- 2, 6-bisphosphonate inevitably leads to the slowdown of glycosysis pathway, which leads to the
accumulation of fructose- 6-phosphate, which will stimulate the pentose phosphate pathway, produces ribose
and NAPDH, and increases the intracellular reduced glutathione. As shown in Fig. 7, the down regulation of
fructose-6-phosphate and 6-phosphate gluconic acid revealed that the PPP produced more NADPH to support
Scientific Reports | (2020) 10:11130 | https://doi.org/10.1038/s41598-020-67974-8 6
Vol:.(1234567890)www.nature.com/scientificreports/
Figure 4. PLS-DA validity. The quality of the fitting model can be explained by the R 2 and Q2 values. R2
2 represents the variance in
represents the variance explained in the model and indicates the goodness of fit. Q
the data predicted by the model and indicates the predictability. (a) shows the PLS-DA validity between the low
dose tramadol group and the control group; (b) shows the PLS-DA validity between the high dose tramadol
group and the control group; (c) shows the PLS-DA validity between the high dose tramadol group and the low
dose tramadol group.
Figure 5. KEGG enrichment bubble chart (a) shows the comparison between the low dose tramadol group and
the control group; (b) shows the comparison between the high dose tramadol group and the control group; (c)
shows the comparison between the high dose tramadol group and the low dose tramadol group. The abscissa in
Fig. 5 is the ratio of the number of differentially changed metabolites in the corresponding pathway to the total
number of identified metabolites. The higher the ratio, the higher the concentration of differentially changed
metabolites in the pathway. The color of the dot represents the P-value of the hypergeometric test. The smaller
the P value, the greater the reliability and the more statistically significant the test. The size of the dot represents
the number of differentially changed metabolites in the corresponding pathway. A larger point size represents a
greater number of differentially changed metabolites in the pathway.
antioxidant defenses18. As shown in Fig. 6, pretreatment with tramadol had a dose-dependent oxidative damage
effect. In addition, fructose, glucose, galactose, and fructose-6-phosphate took part in galactose metabolism.
These metabolites revealed that energy metabolism was affected in the high dose tramadol group. Serotonin is
degraded to 5-hydroxyindole-acetic acid (5-HIAA) by monoamine oxidase. In the high dose tramadol group,
the content of 5-HIAA was decreased compared with the low dose tramadol group. A unique adverse reaction of
tramadol is serotonin syndrome34, and there is a certain relationship with the metabolics pathway of serotonin.
In the high dose tramadol group, down regulated phosphatidyl ethanolamine and up regulated myo-inositol
revealed the distortion of compositional phospholipids, while in the low dose tramadol group, similar metabolite
changes were not found. We suspect that only exposure to high doses (over 50 mg/kg) of tramadol will influence
phospholipid metabolism.
MDA is an aldehyde produced during the process of lipid peroxidation caused by free radicals. MDA can be
used as a cross-linking agent to promote the cross-linking of nucleic acids, proteins and phospholipids and to
change the function of biological macromolecules. The content of MDA can reflect the degree of lipid peroxi-
dation. The role of SOD is to remove superoxide ions, the precursor of H 2O2 and OH·, in order to protect cells
from damage caused by toxic oxygen free radicals. Increased MDA levels and decreased SOD activity can trigger
oxidative stress, leading to cell damage and even cell death, as shown in Fig. 6. The results showed that chronic
tramadol administration significantly increased levels of MDA and suppressed SOD activity. Increased reactive
Scientific Reports | (2020) 10:11130 | https://doi.org/10.1038/s41598-020-67974-8 7
Vol.:(0123456789)www.nature.com/scientificreports/
80 25
MDA (nmol/100mg)
20
60
SOD (u/g)
15
40
10
20 5
0 0
ol
ol
ol
ol
ol
ol
tr
ad
ad
tr
ad
ad
on
on
am
am
am
am
C
C
tr
tr
tr
tr
kg
kg
kg
kg
g/
g/
g/
g/
m
m
m
m
20
50
20
50
Figure 6. Tramadol induces lipid peroxidation, and suppresses SOD activity. MDA was increased in the
cerebrum of mice receiving 20 or 50 mg/kg tramadol for 5 weeks. Data are expressed as Mean ± SEM, n = 6. The
statistical analysis was performed using one-way ANOVA and P < 0.05 was considered statistically significant.
Glucose
G6P
fructose-6-phosphate G6PD
6-Phosphoglucono-δ-lactone
fructose-1,6-biphosphate NADP
NADPH
6-phosphogluconic acid
NADP
NADPH
Ribulose 5-phosphate
Figure 7. The effects of pentose phosphate pathway after tramadol treatment [fructose-6-phosphate and
6-phosphogluconic acid decreased in the tramadol group (50 mg/kg)].
oxygen species (ROS) can induce peroxidation of cell membrane lipids and can damage DNA and proteins,
resulting in cell death. These results were consistent with the results of metabolomics.
It was noteworthy that the change of some neurotransmitters was observed as the dose increases, such as
succinate seminaldehyde, gamma-hydroxybutyric acid and glutamine. As shown in Table 1, in the low dose
tramadol group, up-regulation of gamma-hydroxybutyric acid (GHB) and down regulation of succinic semial-
dehyde (SSA) indicated that the GABAergic system was disrupted. Maitre et al.35 reported that GHB modulated
GABAergic activity in some regions of the brain. The GABAergic system has been investigated extensively as a
major inhibitory neurotransmitter system strongly associated with drug-dependence36. With the dose of tramadol
abuse increasing, in the high dose tramadol group, besides upregulated GHB, glutamine was down regulated,
which was suspected to be influenced by the glutamate-glutamine shuttle. In conclusion, the GABAergic system
was influenced after tramadol abuse as shown in Fig. 8, which correlated with the adverse reaction of tramadol
resulting in seizures. Tramadol is a non-selective opioid receptor agonist37. Moreover, overactivation of opioid
receptors has been shown to accelerate seizure activity in various experimental animals 38.Therefore, it maybe
possible that the stimulation of tramadol induced opioid receptor might mediate the seizurogenic effect of
tramadol. In addition, seizures induced by overactivation of opioid receptor have been associated with signifi-
cant inhibition of GABA r eceptors19, 39. Furthermore, Rehni et al.40 reported that activation of opioid receptor
Scientific Reports | (2020) 10:11130 | https://doi.org/10.1038/s41598-020-67974-8 8
Vol:.(1234567890)www.nature.com/scientificreports/
Figure 8. Metabolic pathway for the synthesis of gamma-hydroxybutyric acid (GHB) and glutamate/glutamine
shuttle in neurons. Succinic semi-aldehyde (SSA) is formed in the mitochondria by GABA-transaminase
(GABA-T). SSA can either be oxidized to succinate by succinic semialdehyde dehydrogenase (SSADH) in
the mitochondria or transported to the cytosol where it is reduced to gamma-aminobutyric acid (GABA)
by succinic semialdehyde reductase (SSR). Glutamate can form GABA by glutamate decarboxylase (GAD).
Glutamine is broken down to glutamate under the action of glutaminase. Glutamate is converted to glutamine
by glutamine synthetase (GS). In the low dose tramadol group, the content of SSA was down regulated and
the content of GHB was up regulated. In the high dose tramadol group, the content of glutamine was down
regulated and the content of GHB was up regulated.
may result in the GABA neurotransmitter system’s inhibition, that might be responsible for the seizurogenicity
of tramadol. By studying the metabolomics of tramadol abuse, we also found that the GABA neurotransmitter
system was disrupted. Moreover, as shown in Fig. 1, there was a dose-dependent relationship between tramadol
and seizure severity, that similar result also was found by Rehin et al.40. Thus, it can be concluded that there may
be a correlation between inhibition of the GABA neurotransmitter system and the seizurogenicity of tramadol.
In conclusion, tramadol abuse may be a risk factor for impaired mental and emotional health, which could
be mediated via the GABA neurotransmitter system. Moreover, long-term abuse of tramadol could cause oxi-
dative damage and lipid peroxidation. These results were also found in the low and high dose tramadol groups
based on metabolomics. It is concluded that metabolomics could explain tramadol’s adverse reactions, including
disruption of the GABA neurotransmitter system, phospholipid metabolism and energy metabolism, and may
be a useful tool in identifying potential biomarkers following long-term tramadol abuse.
Data availability
The datasets supporting the conclusions of this article are included within the article.
Received: 15 March 2020; Accepted: 17 June 2020
References
1. Lee, C. R., McTavish, D. & Sorkin, E. M. Tramadol: a preliminary review of its pharmacodynamic and pharmacokinetic properties,
and therapeutic potential in acute and chronic pain states. Drugs. 46(2), 313–340 (1993).
2. Munro, G. et al. The novel compound (+/−)-1-[10-((E)-3-Phenyl-allyl)-3,10-diaza-bicyclo[4,3,1]dec-3-yl]-propan-1-one(NS7051)
attenuates nociceptive transmission in animal models of experimental pain; a pharmacological comparison with the combined
mu-opioid receptor agonist and monoamine reuptake inhibitor tramadol. Neuropharmacology 54(2), 331–343 (2008).
3. Kimura, M., Obata, H. & Saito, S. Antihypersensitivity effects of tramadol hydrochloride in a rat model of postoperative pain.
Anesth. Analg. 115(2), 443–449 (2012).
4. Hanna, M. M. & Ayman, M. M. Chronic exposure to the opioid tramadol induces oxidative damage, inflammation and apoptosis,
and alters cerebral monoamine neurotransmitters in rats. Biomed. Pharmacother. 110, 239–247 (2019).
5. Chi, X. et al. Comparison of patient-controlled intravenous analgesia with sufentanil versus tramadol in post-cesarean section
pain management and lactation after general anesthesia- a prospective, randomized, double-blind, controlled study. J. Pain Res.
10, 1521 (2017).
6. Nakhaei, A. M., Iri, A. & Akhoondi, S. The definition of recurrent shoulder dislocation in tramadol induced seizure patients. Med.
J. Islam. Repub. Iran. 29, 298 (2015).
7. Shubhakaran, K. P. & Khichar, R. J. Tramadol side effects: seizure and hypoglycemia. Anesth. Essays Res. 10(3), 685–686 (2016).
8. Beakley, B. D., Kaye, A. M. & Kaye, A. D. Tramadol, pharmacology, side effects, and serotonin syndrome: a review. Pain Phys. 18,
395–400 (2015).
9. Makunts, T., Andrew, U., Atayee, R. S. & Abagyan, R. Retrospective analysis reveals significant association of hypoglycemia with
tramadol and methadone in contrast to other opioids. Sci. Rep. 9(1), 12490 (2019).
10. Thiels, C. A., Habermann, E. B. & Hooten, W. M. Chronic use of tramadol after acute pain episode: cohort study. BMJ 365, I1849.
https://doi.org/10.1136/bmj.l1849 (2019).
11. Miotto, K. et al. Trends in tramadol: pharmacology, metabolism, and misuse. Anesth. Analg. 124(1), 44–51 (2017).
Scientific Reports | (2020) 10:11130 | https://doi.org/10.1038/s41598-020-67974-8 9
Vol.:(0123456789)www.nature.com/scientificreports/
12. Dobscha, S. K., Morasco, B. J., Duckart, J. P., Macey, T. & Deyo, R. A. Correlates of prescription opioid initiation and long-term
opioid use in veterans with persistent pain. Clin. J. Pain. 29, 102–108 (2013).
13. Lev, R., Lee, O. & Petro, S. Who is prescribing controlled medications to patients who die of prescription drug abuse?. Am. J. Emerg.
Med. 34, 30–35 (2016).
14. Krebs, E. E., Gravely, A. & Nugent, S. Effect of opioid vs nonopioid medications on pain-related function in patients with chronic
back pain or hip or knee osteoarthritis pain: the SPACE randomized clinical trial. JAMA 319, 872–882 (2018).
15. Goldansaz, S. A. et al. Livestock metabolomics and the livestock metabolome: a systematic review. PLoS ONE 12(5), e0177675
(2017).
16. Wang, Z. et al. Serum metabolomics in rats after acute paraquat poisoning. Biol. Pharm. Bull. 38(7), 1049–1053 (2015).
17. Xiao, S. & Zhou, L. Gastric cancer: metabolic and metabolomics perspectives (Review). Int. J. Oncol. 51(1), 5–17 (2017).
18. Gao, L. et al. Serum metabolomics in mice after paraquat posioning. Mol. Cell. Toxicol. 15, 453–458 (2019).
19. Miura, M., Saino-Saito, S., Masuda, M., Kobayashi, K. & Aosaki, T. Compartment-specifific modulation of GABAergic synaptic
transmission by mu-opioid receptor in the mouse striatum with green fluorescent protein-expressing dopamine islands. J. Neurosci.
27, 9721–9728 (2007).
20. Kind, T. et al. FiehnLib: mass spectral and retention index libraries for metabolomics based on quadrupole and time-of-flight gas
chromatography/mass spectrometry. Anal. Chem. 81(24), 10038–10048 (2009).
21. Bonneh-Barkay, D., Reaney, S. H., Langston, W. J. & Di Monte, D. A. Redox cycling of the herbicide paraquat in microglial cultures.
Brain Res. Mol. Brain Res. 134, 52–56 (2005).
22. Broadhurst, D. I. & Kell, D. B. Statistical strategies for avoiding false discoveries in metabolomics and related experiments. Metabo-
lomics 2, 171–196 (2006).
23. Lin, W. H. et al. Seizure-induced 5-HT release and chronic impairment of serotonergic function in rats. Neurosci. Lett. 534, 1–6
(2013).
24. Gao, Y. et al. Pharmaco metabolomic prediction of individual differences of gastrointestinal toxicity complicating myelosuppres-
sion in rats induced by irinotecan. Acta Pharm. Sin. B. 9, 157–166 (2019).
25. Kanehisa, M. & Goto, S. KEGG: kyoto encyclopedia of genes and genomes. Nucleic Acids Res. 28, 27–30 (2000).
26. Kanehisa, M., Sato, Y., Furumichi, M., Morishima, K. & Tanabe, M. New approach for understanding genome variations in KEGG.
Nucleic Acids Res. 47, D590–D595 (2019).
27. Kanehisa, M. Toward understanding the origin and evolution of cellular organisms. Protein Sci. 28, 1947–1951 (2019).
28. Boulesteix, A. L. & Strimmer, K. Partial least squares: a versatile tool for the analysis of high-dimensional genomic data. Briefings
Bioinform. 8, 32–44 (2017).
29. Ali, T. et al. Genotoxicity and repair capability of Mus musculus DNA following the oral exposure to Tramadol. Saudi J. Biol. Sci.
27(1), 12–17. https://doi.org/10.1016/j.sjbs.2019.03.008 (2020).
30. Beyaz, S. G., Sonbahar, T., Bayar, F. & Erdem, A. F. Seizures associated with low-dose tramadol for chronic pain treatment. Anesth
Essays Res. 10, 376–378 (2016).
31. Xu, W. Y. et al. 2-Aminoadipic acid protects against obesity and diabetes. J. Endocrinol. 243(2), 111–123 (2019).
32. Condorelli, R. A. et al. Myo-inositol as a male fertility molecule: speed them up!. Eur. Rev. Med. Pharmacol. Sci. 21(2), 30–35
(2017).
33. Onkenhout, W., Venizelos, V., van der Poel, P. F., van den Heuvel, M. P. & Poorthuis, B. J. Identification and quantification of
intermediates of unsaturated fatty acid metabolism in plasma of patients with fatty acid oxidation disorders. Clin. Chem. 41(10),
1467–1474 (1995).
34. Hassamal, S., Miotto, K., Dale, W. & Danovitch, I. Understanding the risk of serotonin syndrome and seizures. Am. J. Med. 131(11),
1382-e1. https://doi.org/10.1016/j.amjmed (2018).
35. Maitre, M. et al. Gamma-hydroxybutyric acid as a signaling molecule in brain. Alcohol. 20(3), 277–283 (2000).
36. Azmy, S. M. et al. Does nicotine impact tramadol abuse? Insights from neurochemical and neurobehavioral changes in mice.
Neurotoxicology. 67, 245–258 (2018).
37. Ide, S. et al. Mu opioid receptor-dependent and independent components in effects of tramadol. Neuropharmacology 51, 651–658
(2006).
38. Saboory, E. et al. Mechanisms of morphine enhancement of spontaneous seizure activity. Anesth. Analg. 105, 1729–1735 (2007).
39. Frenk, H. Pro- and anticonvulsant actions of morphine and the endogenous opioids: involvement and interactions of multiple
opiate and non-opiate systems. Brain Res. 287, 197–210 (1983).
40. Rehni, A. K., Singh, I. & Kumar, M. Tramadol-induced seizurogenic effect: a possible role of opioid-dependent γ-aminobutyric
acid inhibitory pathway. Basic Clin. Pharmacol. Toxicol. 103, 262–266 (2008).
Acknowledgements
We thank International Science Editing (https://www.internationalsciencee diting.com) for editing this
manuscript.
Author contributions
W.X. was reponsible for Data curation and Formal analysis. G.L. was responsible for methodology and prepared
figure 2-5. W.X. and G.L. are co-first-authors. Z.S. was reponsible for Methodology and Software. E.X prepared
figure 1. H.Y prepared figure 6-8. J.L was responsible for revised the manuscript. L.G was responsible for Supervi-
sion and wrote the original draft. All authors reviewed the manuscript. This work was supported by the national
natural science foundation of China under Grant [number 81601644,81671864].
Competing interests
The authors declare no competing interests.
Additional information
Supplementary information is available for this paper at https://doi.org/10.1038/s41598-020-67974-8.
Correspondence and requests for materials should be addressed to L.G.
Reprints and permissions information is available at www.nature.com/reprints.
Publisher’s note Springer Nature remains neutral with regard to jurisdictional claims in published maps and
institutional affiliations.
Scientific Reports | (2020) 10:11130 | https://doi.org/10.1038/s41598-020-67974-8 10
Vol:.(1234567890)www.nature.com/scientificreports/
Open Access This article is licensed under a Creative Commons Attribution 4.0 International
License, which permits use, sharing, adaptation, distribution and reproduction in any medium or
format, as long as you give appropriate credit to the original author(s) and the source, provide a link to the
Creative Commons license, and indicate if changes were made. The images or other third party material in this
article are included in the article’s Creative Commons license, unless indicated otherwise in a credit line to the
material. If material is not included in the article’s Creative Commons license and your intended use is not
permitted by statutory regulation or exceeds the permitted use, you will need to obtain permission directly from
the copyright holder. To view a copy of this license, visit http://creativecommons.org/licenses/by/4.0/.
© The Author(s) 2020
Scientific Reports | (2020) 10:11130 | https://doi.org/10.1038/s41598-020-67974-8 11
Vol.:(0123456789)You can also read