Qantas Airways Limited FY18 Results - ASX:QAN US OTC:QABSY 23 August 2018 - Qantas | Investors

Page created by Francisco Long
 
CONTINUE READING
Qantas Airways Limited FY18 Results - ASX:QAN US OTC:QABSY 23 August 2018 - Qantas | Investors
Qantas Airways Limited
FY18 Results
23 August 2018

ASX:QAN
US OTC:QABSY
Qantas Airways Limited FY18 Results - ASX:QAN US OTC:QABSY 23 August 2018 - Qantas | Investors
FY18 Highlights

Record Group financial performance in rising fuel environment                                                                                                                                                  Earnings Per Share (Cents)

     •      Record1 Underlying Profit Before Tax2 (PBT) $1,604m, Statutory PBT $1,391m                                                                                                                                                                               64
                                                                                                                                                                                                                           53                   55           56
                                                                                                                                                                                                                   49                   46
     •      Record Statutory EPS 56 cps, Underlying EPS3 64 cps
                                                                                                                                                                                                      32
                                                                                                                                                                                             25
     •      Strong Return on Invested Capital (ROIC) of                                   22.0%4
     •      Delivered $463m in transformation benefits, >$400m target
     •      Bonus for 27,000 non-executive employees totalling $67m                                                                                                                            FY15                  FY16                 FY17                 FY18
                                                                                                                                                                                                                     Statutory          Underlying
All operating segments delivering ROIC > WACC5
     •      Record Qantas Domestic, Jetstar Domestic and Group Domestic6 earnings7                                                                                                                               Net Free Cash Flow9 ($M)

     •      Record earnings7 for Jetstar Group                                                                                                                                                                      1,674
                                                                                                                                                                                                                                                                1,442
                                                                                                                                                                                                                                          1,309
     •      Unit Revenue improvement drives earnings7 growth at Qantas International8                                                                                                         1,104
     •      Record Qantas Loyalty earnings7 provides growing diversified earnings stream
Record operating cash flow continues to generate strong net free cash flow9
     •      Net debt10 of $4.9b offers significant financial flexibility, FY18 capital expenditure of $1.97m
                                                                                                                                                                                               FY15                 FY16                  FY17                  FY18
     •      10 cents per share dividend, fully franked, on-market share buy-back of up to $332m
                        STRUCTURALLY TRANSFORMED BUSINESS DELIVERING TOP QUARTILE SHAREHOLDER RETURNS OVER THE CYCLE
1. Record Underlying PBT since FY09. 2. Underlying PBT has been the Group’s primary performance reporting measure since FY09. For prior periods, comparison is to Statutory PBT adjusted for disclosed extraordinary items. Refer to Supplementary slide 6 for a
reconciliation of Underlying to Statutory PBT. 3. Underlying Earnings Per Share calculated as Underlying PBT less tax expense (Group effective tax rate of 29.5%) divided by weighted average number of shares during the year, rounded to the nearest cent. 4. Calculated as
ROIC EBIT for 12 months to 30 June 2018, divided by 12-months average Invested Capital. 5. Weighted Average Cost of Capital calculated on a pre-tax basis. 6. Includes Qantas Domestic and Jetstar Domestic. 7. Underlying EBIT. 8. Qantas International includes Qantas             2
International and Freight business. 9. Net cash from operating activities less net cash used in investing activities (excluding aircraft operating lease refinancing). 10. Net debt under the Group’s Financial Framework includes net on balance sheet debt and off balance sheet
aircraft operating lease liabilities.
Qantas Airways Limited FY18 Results - ASX:QAN US OTC:QABSY 23 August 2018 - Qantas | Investors
Integrated Group Portfolio Weighted to Domestic Australia

                        Maximising leading Dual Brand Domestic position through network                                                                                                                Operating Segment EBIT4 ($M)
                        leadership and customer focused investments
                                                                                                                                                                  2000

                                                                                                                                                                                                                                                          Group
                                                                                                                                                                                                                                                      International
                        Group        Domestic1
                                       Underlying EBIT of $1,079m supported by proactive                                                                          1600
          $                                                                                                                                                                                                Group                   Group
                        capacity management                                                                                                                                                            International           International

                                                                                                                                                                                                                                                         Loyalty
                                                                                                                                                                  1200              Group
                        Continued Loyalty earnings growth2 and diversification                                                                                                  International
                                                                                                                                                                                                                                  Loyalty
                                                                                                                                                                                                           Loyalty

                                                                                                                                                                   800             Loyalty

                        Strengthened core airline partnerships and continued structural
                        transformation reduces earnings cyclicality of Group International3
                                                                                                                                                                   400            Group                   Group                   Group                   Group
                                                                                                                                                                                 Domestic                Domestic                Domestic                Domestic

                        Highly trusted brand that supports diversification into new businesses                                                                         0
                                                                                                                                                                                  FY15                    FY16                    FY17                   FY18

                                                                        DOMESTIC AIRLINES & LOYALTY UNDERPIN GROUP EARNINGS
1. Group Domestic includes Qantas Domestic and Jetstar Domestic. 2. Measured on Underlying EBIT compared to FY17. 3. Group International includes Qantas International, Freight, Jetstar International Australian operations, Jetstar New Zealand (including Jetstar
Regionals), Jetstar Asia (Singapore) and the contributions from Jetstar Japan and Jetstar. Pacific (Vietnam). 4. Measured on Underlying EBIT.
                                                                                                                                                                                                                                                                       3
FY18 Key Group Financial Metrics

                     Underlying PBT1                                       Underlying EPS3                                       12 Month ROIC%4                                                               Cash Flow

                         $1,604m                                                     64c                                                                                                                      $3,413m
                                                                                                                                                                                                Operating cash flow, Up $709m2
                           Up $203m2                                               Up 18%2                                              22.0%
                                                                                                                                         > WACC5                                                              $1,442m
                  Statutory PBT $1,391m                                     Statutory EPS 56c
                        Up $210m2                                                Up 21%2                                                                                                        Net free cash flow6, Up $133m2

                       Unit Revenue7                                        Total Unit Cost8                                    Operating Margin9                                                   Traffic/Capacity Growth

                                                                                 +2.7%                                                                                                                 ASKs10 +1.4%
                            +3.9%                                                                                                       10.5%
                                                                               +2.4% ex fuel                                           Up 0.6 pts2
                                                                                                                                                                                                       RPKs11 +4.7%

1. Underlying PBT is a non-statutory measure and is the primary reporting measure used by the chief operating decision-making bodies, being the Chief Executive Officer, Group Management Committee and the Board of Directors, for the purpose of assessing the
performance of the Qantas Group. Refer to Supplementary slide 6 for a reconciliation of Underlying to Statutory PBT. 2. Compared to FY17. 3. Underlying Earnings Per Share is calculated as Underlying PBT less tax expense (based on the Group’s effective tax rate of
29.5%) divided by the weighted average number of shares during the year, rounded to the nearest cent. 4. Calculated as ROIC EBIT for 12 months to 30 June 2018, divided by 12-months average Invested Capital. 5. Weighted Average Cost of Capital calculated on a
pre-tax basis. 6. Net cash from operating activities less net cash used in investing activities (excluding aircraft operating lease refinancing). 7. Ticketed passenger revenue per Available Seat Kilometre (ASK). Compared to FY17. 8. Underlying PBT less ticketed
passenger revenue per Available Seat Kilometre (ASK). Compared to FY17. Ex Fuel refers to Unit cost excluding Fuel, FX on net non-fuel expenditure, impact of discount rates and actuarial assumptions, and share in investments accounted for under the equity method.   4
9. Group Underlying EBIT divided by Group Total Revenue. 10. Available Seat Kilometres. Total number of seats available for passengers, multiplied by the number of kilometres flown. Compared to FY17. 11. Revenue passenger kilometres. Total number of
passengers carried, multiplied by the number of kilometres flown. Compared to FY17.
FY18 Profit Bridge

                                                                                                  Underlying Profit Before Tax ($M)

                                                          193
                                                         (193)

                                                                                  189
                                                                                 (189)                     254                    250
                                                                                                                                 (250)
                                   645
                                                                                                                                                           51
                                                                                                                                                          (51)                     36                     (23)
                                                                                                                                                                                                           23                                           1,604
                                                                                                                                                                                                                                   26
                                                                                                                                                                                                                                  (26)
         1,401

                                                                  Net Revenue benefits2                        $176m
                                                                  Fuel efficiency benefits3                    $ 33m
                                                                  Non-fuel cost reduction                      $254m
                                                                  Transformation benefits                      $463m

         FY17             Ticketed Passenger               Fuel           Cost from Activity &       Transformation                CPI4               Depreciation          FX on Net Non-             Bond Rate6                 Other                 FY18
     Underlying PBT            Revenue1                                    Network Changes           Cost Reduction                                    & Rentals           Fuel Expenditure5                                                        Underlying PBT

1. Represents the change in Unit Revenue and Available Seat Kilometres. 2. Revenue benefits less incremental costs associated with that benefit including costs of increased activity where related to a Transformation initiative. 3. Includes reduction in consumption from   5
fuel efficiency and reduction in into-plane costs following Transformation initiatives. 4. Company estimate, including wage and other inflation. 5. FX other than on ticketed passenger revenue, fuel, and depreciation & non-cancellable aircraft operating lease rentals.
6. Revaluation impact of discount rate and other actuarial assumption changes on employee-related provisions.
Maximising Leading Dual Brand Domestic Position
Dual Brand strategy at the core of Group’s portfolio strength

                                                                                                                                                                                Group Domestic Unit Revenue Growth5

$1,079m               Record Group Domestic1 Underlying EBIT in FY18, up 25%2                                                                                          Market Capacity growth
                                                                                                                                                                                                   6
                                                                                                                                                                                                                Group Domestic Unit Revenue growth

                                                                                                                                                                                                                                                          6.8%
                                                                                                                                                                           4.4%             0.7%       0.0%                                     0.1%
                                                                                                                                                                                                                               2.3%
  >10%               >10% ROIC3 for Qantas and Jetstar Domestic                                                                                                                                                      (0.5%)
                                                                                                                                                                 (1.4%)
                                                                                                                                                                       FY15                     FY16                       FY17                      FY18

                     Increase in Group Domestic Unit Revenue2 in flat market capacity
  6.8%               environment as market demand absorbed excess capacity                                                                                                                     Domestic Margins
                                                                                                                                                                FY17          FY18

                                                                                                                                                                   +1.4 pts                                              +0.6 pts

+1.4pts              Increase in operating margin4 at Qantas Domestic compared to FY17

                                                                                                                                                               11.5%      12.9%                                       11.6%    12.2%

                                                                                                                                                                                           2.7%
                                                                                                                                                                                                                                                 (4.5)%
+0.6pts              Increase in operating margin4 at Jetstar Group compared to FY17                                                                          Qantas Domestic             Virgin Australia            Jetstar Group            Tigerair Australia7
                                                                                                                                                                                             Domestic7

                                                                   DUAL BRAND STRATEGY SUPPORTS RELATIVE MARGIN ADVANTAGE
 1. Includes Qantas Domestic and Jetstar Domestic. 2. Compared to FY17. 3. Calculated as ROIC EBIT for the 12 months ended 30 June 2018, divided by the 12 months average Invested Capital. 4. Calculated as Underlying segment EBIT divided by total segment
 revenue. 5. Compared to prior year. 6. Compared to prior year. Market capacity growth source: BITRE capacity data and published schedules. 7. Competitor operating margins calculated using published data. Calculated as Underlying segment EBIT divided by total   6
 segment revenue.
Building a Resilient Qantas International

                                                                                                                                                                                   Airline Group Operating Margin3

$399m                Underlying EBIT in FY18 up 6.7% compared to FY17
                                                                                                                                                                                                                         11.5%
                                                                                                                                                             Japan Airlines
                                                                                                                                                                                                                              13.6%

                                                                                                                                                                                                                       10.5%
 >10%                >10% ROIC1 since FY15                                                                                                                   Qantas Group                                                                           +0.6pts
                                                                                                                                                                                                                       9.9%

                                                                                                                                                                                                                       10.4%
                                                                                                                                                          Air New Zealand
                                                                                                                                                                                                                         11.1%
                     Ordered 14 new 787-9 Dreamliners to date, 5 deliveries as
    14               of 30 June 2018                                                                                                                                                                               8.0%
                                                                                                                                                                         ANA
                                                                                                                                                                                                                    8.7%

                                                                                                                                                                                                                6.4%
                                                                                                                                                        Singapore Airlines
                    Codeshare destinations across the world further enhancing                                                                                                                                     7.4%
 >240               network reach and Group value through alliance partnerships
                                                                                                                                                                                                             4.9%
                                                                                                                                                            Virgin Australia
                                                                                                                                                                                                         3.3%

                    Reduction in capacity exposure to UK market since FY122,                                                                                                                             3.3%
 18pts              one of the slowest growing and highly competitive markets
                                                                                                                                                             Cathay Pacific
                                                                                                                                                                                          -4.0%                                            FY18       FY17

                                                                             STRONG GROUP MARGIN RELATIVE TO REGIONAL PEERS
1. Calculated as rolling 12 month ROIC EBIT, divided by the 12-months average Invested Capital for each financial period. 2. FY18 ASKs compared to FY12. UK market in FY12 includes Frankfurt routes. 3. Regional peer margins calculated using published Group level
data. Calculated as EBIT (or equivalent) divided by Total Revenue. For all airlines, FY17 represents the period 1 July 2016 to 30 June 2017 and FY18 represents the period 1 July 2017 to 30 June 2018. FY18 based on Bloomberg estimates for Virgin Australia.         7
Segment Results
Qantas Domestic

•       Record1 Underlying EBIT up 19.1% to $768m
                                                                                                                                                                                                                         FY18                FY17           VLY %8
•       Record Operating Margin
                                                                                                                                                       Revenue                                            $M             5,973              5,632                     6.1
       –       Have offset fuel price increases

           •     Unit Revenue up 8% in FY18                                                                                                            Underlying EBIT                                    $M                768                645               19.1

           •     Continued capacity management discipline
                                                                                                                                                       Operating Margin6                                   %               12.9               11.5             1.4pts
       –       Maintained leadership in Corporate market share; growing SME2 share
                                                                                                                                                       ASKs                                                 M          34,385             35,231                 (2.4)
       –       Growth in Resources market revenue; a ~$50m increase in FY18
•       Continued investment in customer experience                                                                                                    Seat factor7                                        %               77.8               76.4             1.4pts
       –       > 15pts customer advocacy3 premium to competitor4

       –       84% on time performance5

       –       More than half of 737 fleet Wi-Fi equipped, improved NPS for in-flight entertainment on Wi-Fi equipped 737s; A330 Wi-Fi roll-out underway

       –       Improved offerings for regional resident travel through expansion of resident fares program; Announced Turboprop refurbishment and regional lounge
               upgrades

       –       Final stages of new Melbourne Qantas Club and Business Lounge scheduled to open mid-November
                                                                           SUSTAINED LEADERSHIP IN THE PREMIUM DOMESTIC MARKET
    1. For Qantas Domestic segment, reported as an operating segment since FY13. 2. Small to Medium Enterprise. 3. Customer advocacy measured as Net Promoter Score (NPS). Based on Qantas internal reporting. 4. Competitor refers to Virgin Australia. Based on
    Qantas internal reporting. 5. On time performance (OTP) of Qantas Domestic operations. Measured as departures within 15 minutes of scheduled departure time for FY18. Source: BITRE. 6. Operating margin calculated as Underlying EBIT divided by total segment
                                                                                                                                                                                                                                                                            9
    revenue. 7. RPKs divided by ASKs. 8. Variance to FY17.
Qantas International1

•      Underlying EBIT up 6.7% to $399m
                                                                                                                                                                                                                       FY18              FY174             VLY %
       –      Unit Revenue increase of                  2.5%2      in competitive market conditions
                                                                                                                                                      Revenue                                           $M             6,892              6,413                     7.5
       –      Maintained strong operating margin in rising fuel price environment

•      Structural transformation continues to build earnings resilience                                                                               Underlying EBIT                                   $M                399                374                    6.7

       –      Successful launch of direct Perth – London service in March 2018
                                                                                                                                                      Operating Margin                                   %                 5.8                5.8              0pts
       –      Completed Singapore hub switch, increased network connectivity
                                                                                                                                                      ASKs                                                M          69,280             66,389                      4.4
       –      Ordered 6 additional Dreamliners, accelerating 747 retirements

       –      Improved customer proposition through extended partnerships and alliances                                                               Seat factor                                        %               84.2               81.0            3.2pts

•      Strengthening international freight markets, domestic freight market stable

•      Continuing investment in customer experience

       –      Higher customer advocacy3 on Dreamliner routes, including Perth – London

       –      New London and Perth transit hub lounge opened

       –      First five 789 Dreamliners delivered at 30 June 2018, enabling new network opportunities, cost efficiencies and yield premium

                                                             RESILIENT QANTAS INTERNATIONAL CONTINUING TO DELIVER ROIC > WACC
    1. The Qantas Freight segment which was previously a separate segment has been consolidated into the Qantas International segment. 2. Calculated as ticketed passenger revenue per ASK including FX (3.3% increase excluding FX). 3. Measured as Net Promoter
    Score (NPS). Based on Qantas internal reporting. 4. Comparatives restated to reflect the consolidation of Qantas Freight into Qantas International segment.
                                                                                                                                                                                                                                                                          10
Jetstar Group

•        Record Underlying EBIT up 10.6% to $461m
                                                                                                                                                                                                                                  FY18                FY17              VLY %
•        Record Domestic               result1,
                               Unit Revenue up 5% driven by a 3 pts seat factor
         improvement on 1% capacity reduction                                                                                                                Revenue10                                            $M              3,767               3,600                   4.6

•        Strong Jetstar International2 earnings3
                                                                                                                                                             Underlying EBIT                                      $M                 461                 417                10.6
•        All Jetstar-branded airlines in                   Asia4      profitable
                                                                                                                                                             Operating Margin                                       %               12.2                11.6             0.6pts
       –      Jetstar Japan maintained domestic LCC5 leadership position6

       –      Jetstar Pacific’s domestic performance1 improved                                                                                               ASKs                                                   M           48,763              48,703                    0.1
       –      Jetstar Asia contributing to benefits from Qantas Singapore hub switch
                                                                                                                                                             Seat factor                                            %               85.6                83.1             2.5pts
•        24 million fares sold7 for under $100

•       Continuing investment in digital transformation and customer experience

       –      Cabin Enhancement Program for A320/321 retrofit progressed with improved NPS for completed aircraft8

       −      Club Jetstar continued growth with more than 250,000 members9

       −      Investing in innovation and digital capability to personalise the customer experience and drive ancillary margin growth

                                                                        RECORD PROFIT WHILE MAINTAINING COMMITMENT TO LOW FARES
    1. Underlying EBIT. 2. Includes Jetstar International Australian operations and Jetstar New Zealand (including Jetstar Regionals). 3. Underlying EBIT, Bali volcano disruption impact $11m in FY18. 4. Includes Jetstar Asia (Singapore), Jetstar Japan and Jetstar Pacific
    (Vietnam). 5. Low Cost Carrier. 6. Measured as percentage of domestic market share for FY18. Source: Diio Mi. 7. Airfares sold within the Jetstar Group including Jetstar Asia (Singapore), Jetstar Japan and Jetstar Pacific (Vietnam). 8. Compared to aircraft with
                                                                                                                                                                                                                                                                                    11
    equivalent seat pitch. 9. Members as at June 2018. 10. Revenue consolidated by the Qantas Group, does not include Jetstar Japan and Jetstar Pacific (Vietnam).
Qantas Loyalty

•          Strategy to mitigate interchange fee regulatory change on track
                                                                                                                                                                                                                          FY18               FY17             VLY %
       –      Record Underlying EBIT of $372m
                                                                                                                                                       Revenue                                            $M             1,546              1,505                   2.7
•          Coalition Business fundamentals continue to strengthen

       –      Co-branded credit card growth outpacing market1, members actively switching                                                              Underlying EBIT                                    $M                372                369                  0.8
              through period of regulatory change
                                                                                                                                                       Operating Margin                                     %              24.1               24.5           (0.4)pts
       –      Growth in everyday earn partners2; full year of Woolworths program,
              successful launch of Red Energy
                                                                                                                                                       QFF Members                                          M              12.3               11.8                  4.2
       –      Expanding member redemption options – enhanced access to air, hotel and
              point of sale

       –      Qantas Classic International redemptions up 10%3
•      Qantas Business Rewards member and partner growth supporting airline SME share growth

•      Qantas Travel Money4: Top 3 product in Prepaid Travel market5, Awarded 5 star Canstar rating for the fourth year6

•      New Businesses delivering positive EBIT contribution

       −      Qantas Insurance7: #2 position in Health for net growth8, on track for 2-3% market share in Health9

       −      Qantas Money: Qantas Premier Everyday and Platinum Cards launched within 6 months
                                   STRENGTHENING THE CORE, CONTINUED DIVERSIFICATION OF THE EARNINGS BASE
    1. Based on number of credit card accounts with interest free periods. Market growth calculated including Qantas’ contribution to market. Based on June 2018 compared to June 2017. Source: RBA credit and card charges statistics. 2. As at June 2018 compared to
    June 2017. 3. Compared to FY17. 4. Previously known as Qantas Cash. 5. Australian prepaid travel market spend. Based on Qantas estimates. 6. Canstar rating awarded for Travel Money Card 2015 to 2018. 7. Previously known as Qantas Assure. 8. Based on FY18        12
    growth in net persons insured compared to all Australian Private Health insurance funds. Source: APRA statistics as at 31 March 2018, Qantas and nib estimates. 9. Target based on revenue within 5 years of operation.
Financial Framework
Financial Framework Aligned with Shareholder Objectives

                 1. Maintaining an Optimal                                                                       2. ROIC > WACC2                                                                   3. Disciplined Allocation
                     Capital Structure                                                                           Through the Cycle                                                                        of Capital

                  Minimise cost of capital by                                                                    Deliver ROIC > 10%3                                                             Grow invested capital with
                 targeting a net debt range of                                                                    through the cycle                                                            disciplined investment, return
                        $5.1b to $6.3b1                                                                                                                                                                surplus capital
                                (See slide 15)                                                                      (See slides 16 to 18)                                                                       (See slide 19)

                                                                                     MAINTAINABLE EPS4 GROWTH OVER THE CYCLE

                                                                              TOTAL SHAREHOLDER RETURNS IN THE TOP QUARTILE5
1. Based on current invested capital of ~$8.8b. 2. Weighted Average Cost of Capital, calculated on a pre-tax basis. 3. Target of 10% ROIC allows ROIC to be greater than pre-tax WACC through the cycle. 4. Earnings per Share. 5. Target Total Shareholder Returns
within the top quartile of the ASX100 and global listed airline peer group as stated in the 2017 Annual Report, with reference to the 2017-2019 LTIP.                                                                                                                 14
Maintaining an Optimal Capital Structure
Leverage and liquidity

            Optimal capital structure                                                                                                                                                         Net Debt Profile FY14 to FY18 ($B)

            •       Net debt1 at $4.9b, below the bottom of the target range
                                                                                                                                                                     8                                          33% Reduction
                  –      Provides significant financial flexibility                                                                                                  6

            •       Extended tenor and diversified funding                                                                                                           4

                                                                                                                                                                     2
                  –      First issuance of innovative A$ Corporate Secured Debt Program utilising
                                                                                                                                                                     0
                         mid-life aircraft as security – A$350m face value, 8 year tenor                                                                                        FY14                FY15                FY16                FY17                FY18

                  –      Syndicated Loan Facility upsized to A$325m and extended for 4 years
                                                                                                                                                                                    Debt Maturity Profile as at 30 June 2018 ($M)5
            •       Unencumbered aircraft valued at ~US$4.0b2; 61% of the Group fleet3

                  –      Enhanced quality of unencumbered pool; 5 new 787-9s added in FY18

                  –      Investment Grade credit ratings from Moody’s (Baa2) and S&P (BBB-)

            Strong short term liquidity

                  –      Cash of $1.7b4; Undrawn facilities of $1b

            Optimising cost of debt

                                                                  MAINTAINING OPTIMAL CAPITAL STRUCTURE DELIVERS LOWEST WACC
 1. Net debt includes on balance sheet debt and aircraft operating lease liabilities under the Group’s Financial Framework. Capitalised aircraft operating lease liabilities are measured at fair value at the lease commencement date and remeasured over lease term on a
 principal and interest basis akin to a finance lease. Residual value of capitalised aircraft operating lease liability denominated in foreign currency is translated at the long-term exchange rate. 2. Based on AVAC market values. 3. Based on number of aircraft as at 30 June   15
 2018. The Group fleet totalled 313 aircraft. 17 Aircraft entered the Corporate Debt Program and 6 leased aircraft were refinanced to unencumbered aircraft in FY18. 4. Includes cash and cash equivalents as at 30 June 2018. 5. Cash debt maturity profile excluding
 operating leases.
Delivering ROIC >10% Through the Cycle
Protecting ROIC through the disciplined hedging program

•       Effective hedging program contained FY18 fuel cost increase to $193m or                                                 Fuel Cost (A$B)
        6%1, market USD Jet prices increased on average ~25% over the same
        period2                                                                                                      3.90
                                                                                                                               3.23       3.04           3.23
•       Hedging program provided lead time to make operational and commercial
        setting adjustments focused on maintaining strong ROIC

       ─      Dual brand decisions for capacity settings in the domestic market

       ─      Sophisticated approach to revenue management to optimise unit revenue                                  FY15      FY16       FY17       FY18
              on each flight

       ─      Introduction of fuel efficient 787-9 Dreamliner at Qantas International                                       Return on Invested Capital

       ─      Network and schedule changes to optimise revenue                                                               22.7%                 22.0%
                                                                                                                                        20.1%
                                                                                                                    16.2%

                                                                                                                                                                10%
                                                                                                                                                                Value Creating
                                                                                                                                                                Threshold
                                                                                                                    FY15       FY16      FY17      FY18

                                                                           MAINTAINED STRONG ROIC IN RISING FUEL ENVIRONMENT
    1. Compared to FY17. 2. Average market spot price increase for FY18.
                                                                                                                                                                                 16
Delivering ROIC >10% Through the Cycle
Fuel and revenue outlook

         Reducing short term earnings volatility                                                                                  Well positioned to substantially recover higher fuel costs

•        FY19 fuel cost is expected to be ~A$3.92b1,                                               •      Expect to recover fuel price increases in the domestic market through capacity discipline and
         FY18 $3.23b                                                                                      effective execution of the dual brand strategy

       –      Fuel price is 73% hedged for the                                                     •      Our strong Group operating margin relative to regional peers gives us confidence that we will
              remainder of FY19; 1H19 87% hedged,                                                         substantially recover the higher fuel costs in the International market
              2H19 64% hedged
                                                                                                        –       Transformation has delivered significantly better earnings resilience at Qantas International
       –      Highly effective hedging in place to
                                                                                                        –       Introducing 787-9 Dreamliner fleet; London network and hub restructure; Commencement of
              protect against adverse movements in
                                                                                                                Perth – London direct service
              fuel and FX
                                                                                                        –       More to come with the accelerated retirement of 747s and growth of the 787-9 fleet opening
       –      The level of options provide an average
                                                                                                                up new network opportunities
              of ~54% participation2 to declines in USD
              Brent prices for the remainder of the                                                •      Growing Loyalty business diversifies earnings base with no direct exposure to higher fuel costs
              financial year
                                                                                                   •      Transformation program to continue to deliver ~$400m gross benefits in FY19

                                                                                                   •      Group to continue to generate strong cash flows

                                                                   WELL POSITIONED TO SUBSTANTIALLY RECOVER HIGHER FUEL COSTS
    1. As at 20 August 2018. Assumes forward market rates of Jet Fuel USD85.80/b and AUDUSD 0.7317. FY19 fuel costs could be impacted by a breakdown in correlation or by increases in refiner margins. 2. Participation from current market Brent prices down
    USD10/bbl for remainder of FY19.                                                                                                                                                                                                                             17
Delivering ROIC >10% Through the Cycle
Transformation status

Achieved $463m Transformation benefits in FY181                                                                                 FY19                      On track to deliver targeted annual gross benefit of $400m in
                                                                                                                               pipeline                   FY19 and FY20
•        Net revenue benefits2 of $176m                                                                                          32%
                                                                                                                                                         •       Additional 787-9 Dreamliners, retirement of 747s, Jetstar A320
       –      787-9 Dreamliner introduction                                                                                   completed4
                                                                                                                                                                 cabin enhancement
       –      Singapore hub switch                                                                                                                       •       Focus across Group operating segments to deliver continuous
                                                                                                                                                                 improvement, e.g. customer disruption management, workforce
       –      Perth – London direct service
                                                                                                                                                                 planning utilisation, IT demand value optimisation
       –      Revenue management system enhancements
                                                                                                                                                                                                                                                                               6% fuel/RTK
•        Non-fuel cost reduction of $254m                                                                                                          Fuel Burn Program                                                                                                           consumption
       –      Technology enabled benefits across the Group                                                                                                                                                                                                                       reduction
                                                                                                                                                         •       Forecasting a further 1% reduction in fuel consumption5
                                                                                                                                                                                                                                                                                since FY146
       –      Commercial sourcing and contract renegotiations                                                                                                    on average per year
                                                                                                                                                                                                                              ~760,000 barrels of fuel saved
                                                                                                                                                                                                                                       since FY14
       –      Scheduled maintenance optimisation in the A380 fleet                                                                                       •       Initiatives to reduce fuel                                                                  0.76
                                                                                                                                                                 burn include auxiliary                                                                         0.52
                                                                                                                                                                                                                                                   0.33
•        Fuel efficiency              benefits3         of $33m                                                                                                  power unit usage, single                                  0.12        0.20
                                                                                                                                                                 engine taxi frequency, on
       –      Utilising ground power units                                                                                                                       board weight reductions                                  FY14        FY15         FY16        FY17        FY18
                                                                                                                                                                                                                       Cumulative fuel consumption reduction since FY14 (m bbl)
       –      Single engine taxi frequency

                                                                                       ON TRACK TO DELIVER $400M GROSS BENEFITS IN FY19
    1. See Supplementary slide 5 for details of Transformation costs treated as items not included in Underlying PBT for FY18. 2. Revenue benefits less incremental costs associated with that benefit including costs of increased activity where related to a Transformation
    initiative. 3. Includes reduction in consumption from fuel efficiency and reduction in into-plane costs following Transformation initiatives. 4. Initiative milestones completed to unlock benefits towards the annual target. 5. For operational initiatives included in the Fuel Burn   18
    Transformation Program compared to prior year. Consumption measured as Kilograms. 6. For Qantas Group. Consumption measured as Fuel per RTK. RTKs are a standard industry metric used to quantify the amount of revenue generating payload carried, taking into
    account the distance flown. RTKs comprise the passengers, freight and mail carried multiplied by the Great Circle Distance (GCD), which is a standard published distance between two airports.
Disciplined Capital Allocation
Capital expenditure and shareholder distributions

                                                                                                                                                                                                                Shares on Issue (M)
•        FY18 net capital expenditure1 of $1.97b, $1.0b in 2H18
                                                                                                                                                                                                                  >26% Reduction3
       –      Sustainable operating cash flow has allowed significant deleveraging of the balance
              sheet, supporting ongoing capital investment and shareholder returns

•        Forecast FY19 net capital expenditure of $1.0b                                                                                                                         2,196       2,062       1,919
                                                                                                                                                                                                        1,919       1,832
                                                                                                                                                                                                                    1,832        1,808
                                                                                                                                                                                                                                 1,808       1,745
                                                                                                                                                                                                                                             1,745       1,683
                                                                                                                                                                                                                                                         1,684        1,634
•       Completed on-market share buy-back of $378m in 2H18

       –      3.5% of issued capital purchased in 2H18 at an average price of $6.14                                                                                            30 Jun      31 Dec       30 Jun      31 Dec       30 Jun      31 Dec      30 Jun      31 Dec
                                                                                                                                                                                2015        2015         2016        2016         2017        2017        2018        2018
       –      Reduced issued capital by ~7% in FY18 at an average price of $6.02

       –      23.4%2 reduction in shares on issue since Oct 2015 at an average price of $4.27                                                                                     Track Record of Delivering Shareholder Returns ($M)
•       On-market share buy-back of up to $332m announced
                                                                                                                                                                                                                                                                      Up
       –      ~26%3 reduction in shares on issue at completion of this buy-back                                                                                                                                                                                        to
                                                                                                                                                                                                                                          373           378
                                                                                                                                                                                 505           500           275                                                      332
•       Announced increased base dividend from 7 to 10 cents per share, fully franked, totalling
                                                                                                                                                                                                                            91
        $168m
                                                                                                                                                                                                             134           127            127           122           168
•       Resumption of franking of dividends; recommencing payment of company tax
                                                                                                                                                                                1H16          2H16          1H17           2H17          1H18          2H18          1H19
                                                                                                                                                                                       Capital Return                    Dividend                    Buy-back

                                                                  >$3.0B OF CAPITAL RETURNS5 TO SHAREHOLDERS SINCE OCTOBER 2015
    1. Equal to net investing cash flows included in the Consolidated Cash Flow Statement (excluding aircraft operating lease refinancing) and the impact to Invested Capital from the disposals/acquisitions of operating leased aircraft. 2. Reduction in shares calculated
    against balance as at 1 July 2015. 3. Reduction in shares calculated against balance as at 1 July 2015. Represents indicative reduction in shares where announced buy-back is calculated based on closing share price on 20 August of $6.76. 5. Subject to completion of    19
    announced on-market share buy-back of up to $332m.
Building Long-Term Shareholder Value
Recognising and Responding to Emerging Global Forces
The long-term context

                                                    Understanding the Long-term Context

                                        New Centres of
                                                                Rapid Digitisation   Shifting Customer
                                       Customer Demand                                                   Resource Constraints
                                                               and the Rise of Big    and Workforce
                                        and Geopolitical                                                  and Climate Change
                                                                      Data              Preferences
                                           Influence

                                                       Clear Strategic Priorities to FY20

      Maximising Leading   Building a Resilient            Aligning Qantas and        Investing in Customer,           Diversification   Focus on People,
       Domestic Position     and Sustainable                Jetstar with Asia’s          Brand, Data and               and Growth at       Culture and
      through Dual Brand   Qantas International,                  Growth                      Digital                  Qantas Loyalty      Leadership
           Strategy         Growing Efficiently
                            with Partnerships

                           OUR ONGOING COMMITMENT TO SAFETY, ENVIRONMENT AND COMMUNITY

                                                                                                                                                            21
Balanced Scorecard to Measure Success to FY20
On track to meet near term targets

                                                                                                TARGET

                                                                                     METRICS             TIMEFRAME                   PROGRESS TO DATE

                                                                                   ROIC > 10%            FY18 – FY20    FY18 ROIC > 10% for all operating segments
                            Segment
                          Performance
                                                       Qantas Loyalty targeting EBIT CAGR1 7-10%            FY22        On track for $500-600m EBIT target by 2022
 ACHIEVING OUR TARGETS

                         Transformation                              Annual $400m gross benefits         FY18 – FY20      $463m in gross annual benefits for FY18

                                                               Continued improvement in employee
                            People                                                                       FY18 – FY20        80% employee engagement in FY18
                                                                          engagement

                           Customer                   Continued improvement in Net Promoter Score        FY18 – FY20      Maintaining NPS premium to competitor2

                                                                                                                       Premier Everyday credit card launched, Perth –
                                                     Identify and develop new products, services and                   London service and new Perth Transit lounge,
                           Innovation                                                                    FY18 – FY20
                                                       processes that drive revenue and efficiency                        Qantas Distribution Platform developed,
                                                                                                                               continuation of AVRO Program

                                     GROUP RETURN ON INVESTED CAPITAL EXCEEDS 10%, SUSTAINABLE RETURNS TO SHAREHOLDERS
1. Compound average growth rate in Underlying EBIT. 2. Competitor refers to Virgin Australia.
                                                                                                                                                                        22
Maximising Leading Domestic Position through Dual Brand Strategy

•        Network and frequency advantage to competitors1

•        Sophisticated disciplined approach to capacity management to optimise earnings

•        Reciprocal codeshare deal with Air New Zealand on domestic network

•        Enhancing distribution via the Qantas Distribution Platform

•        Leveraging investment in customer experience including Wi-Fi, lounges and Jetstar cabin
         enhancements

•        Qantas Frequent Flyer program supports leadership in the Corporate market

•        Qantas Business Rewards supports SME share growth

•        Qantas highly leveraged to resources market recovery

•        Jetstar maintains a substantial scale and unit cost advantage over its competitor 2

•        Qantas and Jetstar domestic airlines complemented by strong branded international presence

•        Generating >80% of the profit pool from
Building a Resilient and Sustainable Qantas International

                                                                Network and                                    Defend and Grow                                             Premium Customer
          Fleet Renewal                                                                                                                      Partner for Success
                                                               Hub Evolution                                    Priority Markets                                               Experience

 •   Five 789s in service as at                     •   Launched direct Perth –                          •   38% of Qantas              •   Emirates partnership      •   Cabin upgrade for A380
     30 June 2018; will                                 London flights                                       International capacity         extended for five years       fleet to be completed by
     increase to eight 789s in                                                                               devoted to high-growth                                       end of 2020
     service by December 2018                       •   Increased hub and                                    Asia markets1              •   American Airlines Joint
                                                        connectivity in Singapore                                                           Business application      •   A330 reconfigurations to
 •   789s fleet size increased                                                                           •   Announced additional           refiled with US DOT           be completed by July 2019
     to 14 by end of 2020                           •   Increased wide body                                  services to Asia
                                                        services on Tasman                                                              •   Expanded and new          •   Will deliver consistent
 •   747 fleet to be retired by                                                                          •   50% capacity growth in         Codeshares with Alaska        product across long haul
     2020                                           •   Launched Sydney – Osaka                              Asia markets since FY152       Airlines and Air France       fleet

 •   Project Sunrise ultra                          •   Announced Dreamliner                                                            •   Continued growth of       •   New lounges opened in
     long-range aircraft under                          routes Melbourne – San                                                              revenue and operational       Perth and London
     evaluation                                         Francisco and Brisbane –                                                            synergies with China
                                                        Los Angeles – New York                                                              Eastern                   •   Announced refurbishment
                                                                                                                                                                          of Sydney business lounge
                                                                                                                                                                          and Auckland lounge

                                                        ONGOING STRUCTURAL TRANSFORMATION REDUCES EARNINGS CYCLICALITY
1. Includes South East Asia, North East Asia and Japan. 2. FY18 ASKs in Asia markets compared to FY15.
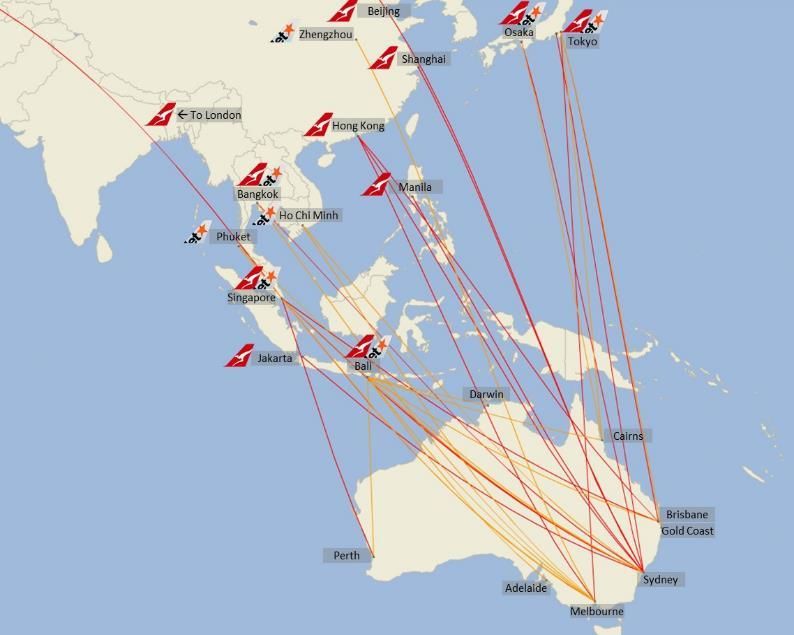
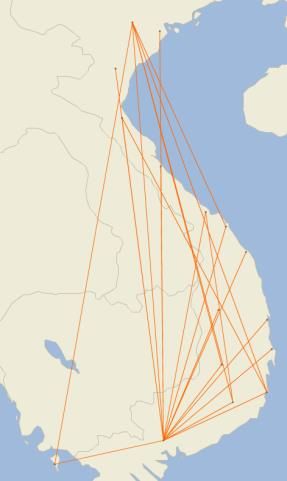
                                                                                                                                                                                                      24
Aligning Qantas and Jetstar with Asia’s growth

•       Qantas routes focused on strong outbound business and
        premium leisure segment demand

•       Qantas Asian network expanded through codeshare and
        alliances

•       Jetstar International routes focused on strong leisure markets
        of Bali and Phuket and connecting with Jetstar-branded
        Airlines in Singapore, Vietnam and Japan                                              Jetstar Japan

•       Greater than 20% of Jetstar International 787-8 passengers
        are Australia inbound1

•       Continued earnings growth2 at Jetstar Japan                       Jetstar Pacific

•       Dual brand international strategy to selected destinations,
        including Bali, Singapore, Tokyo and Osaka

•       Dual brand strategy for China with Qantas focused on
        Shanghai, Beijing and Hong Kong, and Jetstar-branded
        airlines focused on growing Chinese passenger flows

•       Singapore serves as a hub for Qantas London services,
        connecting Jetstar Asia services and midpoint for connecting
        partner services, e.g. Jet Airways, Sri Lankan, Air France             Jetstar Asia

    1. For the FY18 period. 2. Underlying EBIT compared to prior years.
                                                                                                              25
Investing in Customer, Brand, Data and Digital

•       Major lounge investments to support growth in premium international travel

       –      Updates to Sydney International First Lounge and Auckland Lounge, refresh of Tokyo Narita
              Lounge, expanded Brisbane International Lounge

•       Two Regional Lounge upgrades; Tamworth and Hobart

•       Personalising the customer experience through digital platforms

       –      Launched Qantas Distribution Platform as a key part of the digital evolution of Qantas’
              distribution channels

       –      Deployment of Qantas apps to QantasLink Cabin Crew, providing access to real-time
              operational and customer data

       –      Enhanced Jetstar’s ancillary offer through new products and payment options, dynamic pricing
              and growth of Club Jetstar

•       A380 Reconfiguration to commence in 2019; Jetstar Cabin enhancement for A321 complete,
        A320 underway; Turboprop refurbishment underway

•       Half the 737 fleet1 installed with Wi-Fi and launched to passengers; A330 roll-out commencing

•       5 investments through Qantas Ventures’ AVRO accelerator program and direct investments in
        FY18; Second instalment of AVRO launched in July 2018 – a combination of 10 scale-ups and
        start-ups selected from >350 businesses

    1. As at August 2018.
                                                                                                             26
Diversification and Growth at Qantas Loyalty
One of the world’s most diverse airline loyalty programs

•       Growing Loyalty business with advantaged assets and capabilities

       –      12.3 million members, equivalent to ~50% of the Australian population

       –      Unique value of Qantas frequent flyer points driving market share shift and partner retention

       –      Customer data insights from 30 years of Qantas Loyalty, with advanced analytics capability

       –      Working capital benefit to Qantas Group balance sheet

•       Strength of core Qantas frequent flyer program

       –      Greater than 35% share of credit card spend on co-branded credit card1

       –      >400 partners, >55 of which are B2B2 partners; partnerships with all major banks

       –      Breadth and growth in redemption options – further expanding classic flight redemptions through partners; launch of Classic Hotels and Classic Wines

       –      Qantas Business Rewards targeted at SMEs, supporting the SME market share shift to the airline

•       Diversifying earnings streams through broader Coalition and New Businesses

       –      Three-fold increase in revenue from other businesses since FY143 including Qantas Insurance, Qantas Money, Qantas Group Accommodation,
              Qantas Wine and Red Planet

       –      Strong growth momentum to support 2022 targets

                TARGET OF $500-600M EBIT BY 2022 THROUGH COALITION GROWTH AND DEVELOPMENT AND SCALING OF NEW BUSINESSES
    1. Based on Qantas Internal analysis, April 2018. 2. Business-to-Business. 3. For the FY18 period compared to FY14.
                                                                                                                                                                     27
Focus on People, Culture and Leadership

•       Employee engagement at 80% in 2018                                                                                                               Qantas Group Engagement

       –      Strong correlation between high engagement and strong financial performance

       –      Rewarding non-executive employees with over $300m in bonuses for the past 4 years 1

       –      Ongoing investment in customer service and leadership training across the Group                                                                               79%    80%    80%
                                                                                                                                                              75%    75%
                                                                                                                                                71%
•       Embracing diversity and inclusion to drive success in the business                                                                             68%

       –      Driving better business outcomes through diversity of thought and an inclusive and                                                2011   2012   2013   2015   2016   2017   2018
              collaborative culture

       –      Commitment to establishing and growing employee network groups

       –      Target of 35% of senior roles held by women achieved in FY18

       –      Nancy Bird Walton initiative to reach 40% intake of female pilots within 10 years

•       Committed to a second Pilot Academy facility

       –      To ensure a future talent pipeline for Qantas Group airlines

       –      Commercial opportunity to train pilots for other parts of the industry

                                                                                                CONTINUING TO INVEST IN OUR PEOPLE
    1. Cash bonuses and nominal value of staff travel vouchers announced for non-executive employees with respect to the FY15 to FY18 period.
                                                                                                                                                                                                 28
Acting Responsibly

In FY18 the Qantas Group has made significant gains in maintaining high operational standards, acting responsibly and being transparent.

                         Our No.1 Priority – Safety                                                                        Environment                                                                                    Community

  Risk management starts with the safety of                                                        Targeting 'carbon neutral growth'                                                                          Supporting communities
       our customers and employees                                                                and reducing our use of resources                                                                           and engaging our people

                                                                                                                                                                                      • In the 10th year of our Reconciliation Action
   • Continued focus on highest level of                                               • On track to meet the IATA industry target with 1.3%                                            Plan (RAP)
     operational safety standards                                                        fuel efficiency improvement2
                                                                                                                                                                                           ─ 46% growth1 in Indigenous supplier spend;
   • Continuous improvement in Total                                                   • Operated the world’s first dedicated biofuel flight                                                 On boarding 8 new indigenous suppliers
     Recordable Injury Frequency Rate and Lost                                           between the USA and Australia
                                                                                                                                                                                      • Spent over $7 billion with Australia based
     Work Case Frequency Rate1                                                         • Marked the 10th anniversary of carbon offsetting                                               suppliers
   • Leading the region with the implementation                                             ─ A customer offsets their flight every 53 seconds                                        • Launched discounted resident fare schemes
     of a “Trusted Trader” program                                                                                                                                                      in selected regional cities
                                                                                            ─ More than 25 business partners carbon
   • Trialling biometric systems                                                              offsetting through Qantas Future Planet                                                 • Commitment to deliver $3m in drought relief
                                                                                                                                                                                        for Regional Australia

                                                              ACTING RESPONSIBLY TO MAINTAIN OUR SOCIAL LICENCE TO OPERATE
 1. Compared to FY17. 2. Compared to FY17. IATA target of 1.5% fuel efficiency improvement per year from 2009-2020. Measured as Fuel per RTK. RTKs are a standard industry metric used to quantify the amount of revenue generating payload carried, taking into
 account the distance flown. RTKs comprise the passengers, freight and mail carried multiplied by the Great Circle Distance (GCD), which is a standard published distance between two airports.                                                                    29
Fleet Strategic Priorities

             Qantas Group fleet strategy                                  Current Priorities
                                                Qantas International

                Match the right aircraft        •   Grow 787-9 Dreamliner fleet to 14 aircraft
                  to the right route            •   A380 refurbishment program commences in 2019
                                                •   All 747s retired by end of 2020
                                                •   Evaluating Ultra Long-range aircraft under Project Sunrise
                                                Qantas Domestic
                  Maintain flexibility
                                                •   Installing Wi-Fi on 737-8 and A330 fleets
                                                •   Interior refresh of 45 Turboprop regional aircraft
                                                •   Introduction of A320 to QantasLink to service intra WA resources market

                      Maintain                  Jetstar Group
                   competitiveness              •   Cabin Enhancement Program for A321 fleet completed, A320 fleet underway
                                                •   Ordered 18 x A321LR NEOs to replace A320 aircraft and provide flexibility

 Group CEO comment: “The Group can sustain its competitive asset base without exceeding gross capital expenditure of $2b per annum. Growth
            can be met by deferring aircraft retirements or by increasing capital expenditure if value accretive opportunities exist.”

                            INVESTMENT PLAN MAINTAINS FLEET COMPETITIVENESS IN EVERY MARKET SERVED

                                                                                                                                             30
Pathway for Fleet Transition to Next Generation Aircraft Technology

                 Retiring                                                       Sustaining and Investing in                                                               Adopting Next Generation                                          Evaluating Future
                Fleet Type1                                                      Mainstream Technology2                                                                         Technology3                                                   Technology4

                                                                                                              A380 12
         747-4 10
                                                                                                                                                                 787-8 11
  Accelerated retirement                                                          A330 28                                                                                                                                        777X
         by 2020
                                                                                                                                                                                                                               A350ULR
                                                                                                                                                                                                                             Project Sunrise
                                                                        A320/21 CEO 79                                                           A321LR NEO 18
                                                                                                                                                                                                          737 MAX                                      A321 XLR
                                                                                                                                                                                                                                                    Under Evaluation
                                                                                                                                               Orders to replace                                        A321LR NEO
                                                                                                                                                 A320 CEOs                                             Under Evaluation

                                                                                                                                                                                 787-9       5    9

                                                                                                                                                                                                                                                       NMA (797)
                                                                                737 NG 75                                                                                      Orders to replace                                                    Under Evaluation
                                                                                                                                                                                    747s
                           717 20
                                                                                                                                  A220 C series
                                                                                                                                   Embraer E2
                  F100 17                     Q300        5                                                                       Under Evaluation

               Dash8                                                                                                                                                                                                                                   Aircraft in fleet5
                          45
           Q200/Q300/Q400
                                                                                                                                                                                                                                                       Aircraft deliveries6

                                           FLEET RENEWAL PROGRAM FOCUSED ON MAINTAINING COMPETITIVENESS OF TECHNOLOGY
1. Aircraft planned for retirement from Qantas fleet. 2. Aircraft widely operated by global peers and regional competitors as at August 2018. 3. Aircraft with industry-leading technology, and greater fuel efficiency and range flexibility than mainstream technology.
4. Aircraft under production not yet in commercial operation or aircraft under development as at August 2018. 5. As at 30 June 2018. 6. Represents aircraft orders with confirmed delivery date by 2022 at time of publication. Qantas has 39 purchase options for 787-9
                                                                                                                                                                                                                                                                              31
aircraft, and an existing order of 99 A320 aircraft beginning with 18 A321LR NEOs from 2020. Remaining delivery dates yet to be determined.
Outlook
1H19 Outlook – Domestic and International Operating Environment

•       Early signs provide confidence that we will substantially recover higher fuel costs

       –     Value of forward bookings up 6.2% as of 30 June 20181

•       1H19 planned Group capacity to increase by ~0-1%2

•       Group Domestic capacity expected to be flat year on year2

•       Group International capacity expected to increase ~1.0%2; international market capacity is expected to increase by ~4%

                        Qantas retains significant flexibility within its fleet and operational envelopes to respond to market conditions and
                                                                 to maximise our customer proposition

    1. Compared to the balance as at 30 June 2017. 2. Compared to 1H18.                                                                         33
FY19 Group Outlook

•       Current Group operating expectations:

       –      FY19 fuel cost is expected to be ~A$3.92b1

       –      FY19 net depreciation and non-cancellable aircraft operating lease rentals expected to be ~$155m higher than FY18

                FY19 depreciation and amortisation expense expected to be ~$175m higher than FY18

                FY19 non-cancellable aircraft operating lease rentals expected to be ~$20m lower than FY18

       –      FY19 transformation benefits (cost, fuel efficiency and net revenue) expected to be ~$400m

                Fuel efficiency and net revenue benefits from transformation are reflected in guidance for those items

       ‒      FY19 inflation on expenditure forecasted to be ~$250m (including wage growth)

       –      Net capital expenditure2 expected to be $1.0b for FY19

•       The Group will adopt AASB 15 from 1 July 2018. Refer to Supplementary Slide number 17 for additional information.

Group CEO Comment:
    “Our strong balance sheet, forward bookings and the demand environment give the Group confidence that we will substantially recover
                        higher fuel costs. We expect to invest for the future and still deliver strong net free cash flow.”

    1. As at 20 August 2018. Assumes forward market rates of Jet Fuel USD85.80/b and AUDUSD 0.7317. FY19 fuel costs could be impacted by a breakdown in correlation or by increases in refiner margins. 2. Equal to net investing cash flows included in the Consolidated
                                                                                                                                                                                                                                                                            34
    Cash Flow Statement (excluding aircraft operating lease refinancing) and the impact to Invested Capital from the disposals/acquisitions of operating leased aircraft.
Questions?
Disclaimer & ASIC Guidance

This Presentation has been prepared by Qantas Airways Limited (ABN 16 009 661 901) (Qantas).

Summary information
This Presentation contains summary information about Qantas and its subsidiaries (Qantas Group) and their activities current as at 23 August 2018, unless otherwise stated. The information in this Presentation does not purport to be complete. It should be read in
conjunction with the Qantas Group’s other periodic and continuous disclosure announcements lodged with the Australian Securities Exchange, which are available at www.asx.com.au.

Not financial product advice
This Presentation is for information purposes only and is not financial product or investment advice or a recommendation to acquire Qantas shares and has been prepared without taking into account the objectives, financial situation or needs of individuals. Before
making an investment decision prospective investors should consider the appropriateness of the information having regard to their own objectives, financial situation and needs and seek legal and taxation advice appropriate to their jurisdiction. Qantas is not licensed to
provide financial product advice in respect of Qantas shares. Cooling off rights do not apply to the acquisition of Qantas shares.

Not tax advice
Tax implications for individual shareholders will depend on the circumstances of the particular shareholder. All shareholders should therefore seek their own professional advice in relation to their tax position. Neither Qantas nor any of its officers, employees or advisers
assumes any liability or responsibility for advising shareholders about the tax consequences of the return of capital and/or share consolidation.

Financial data
All dollar values are in Australian dollars (A$) and financial data is presented within the twelve months ended 30 June 2018 unless otherwise stated.

Future performance
Forward looking statements, opinions and estimates provided in this Presentation are based on assumptions and contingencies which are subject to change without notice, as are statements about market and industry trends, which are based on interpretations of
current market conditions. Forward looking statements including projections, guidance on future earnings and estimates are provided as a general guide only and should not be relied upon as an indication or guarantee of future performance.

An investment in Qantas shares is subject to investment and other known and unknown risks, some of which are beyond the control of the Qantas Group, including possible delays in repayment and loss of income and principal invested. Qantas does not guarantee any
particular rate of return or the performance of the Qantas Group nor does it guarantee the repayment of capital from Qantas or any particular tax treatment. Persons should have regard to the risks outlined in this Presentation.

No representation or warranty, express or implied, is made as to the fairness, accuracy, completeness or correctness of the information, opinions and conclusions contained in this Presentation. To the maximum extent permitted by law, none of Qantas, its directors,
employees or agents, nor any other person accepts any liability, including, without limitation, any liability arising out of fault or negligence, for any loss arising from the use of the information contained in this Presentation. In particular, no representation or warranty,
express or implied is given as to the accuracy, completeness or correctness, likelihood of achievement or reasonableness of any forecasts, prospects or returns contained in this Presentation nor is any obligation assumed to update such information. Such forecasts,
prospects or returns are by their nature subject to significant uncertainties and contingencies. Before making an investment decision, you should consider, with or without the assistance of a financial adviser, whether an investment is appropriate in light of your
particular investment needs, objectives and financial circumstances.

Past performance
Past performance information given in this Presentation is given for illustrative purposes only and should not be relied upon as (and is not) an indication of future performance.

Not an offer
This Presentation is not, and should not be considered, an offer or an invitation to acquire Qantas shares or any other financial products.

ASIC GUIDANCE
In December 2011 ASIC issued Regulatory Guide 230. To comply with this Guide, Qantas is required to make a clear statement about whether information disclosed in documents other than the financial report has been audited or reviewed in accordance with
Australian Auditing Standards. In line with previous years, this Presentation is unaudited. Notwithstanding this, the Presentation contains disclosures which are extracted or derived from the consolidated Financial Report for the full year ended 30 June 2018 which is
being audited by the Group’s Independent Auditor and is expected to be made available in August 2018.

                                                                                                                                                                                                                                                                                       36
You can also read