BUSINESS PLAN 2021-2024 - Sword Group
←
→
Page content transcription
If your browser does not render page correctly, please read the page content below

BUSINESS PLAN 2021-2024

BUSINESS PLAN
2021-2024

              Services      Software

      INTERNATIONAL CONSULTING, SERVICES AND
   SOFTWARE COMPANY DRIVING GLOBAL LEADERS IN
    THEIR DIGITAL & TECHNOLOGY TRANSFORMATION

                                                s
                                          Winner
Our Common
Values
Respect
Rigour
Involvement
BUSINESS PLAN
2021-2024

This document is in line with our constant concern for transparency
vis-à-vis our staff, our clients, our partners and our investors.

It is for this reason that we have chosen to draft a single document
to present our 2024 business plan.

The overall objective is designed to be realistic but remains rather
conservative however since it does not take account of:

     Acquisitions
     The booster effect of the exceptional R&D plan
     The booster effect of our extremely substantial backlog

I would like to thank all the actors who have enabled the Group to
reach this level of quality.

Jacques Mottard
President

                                           Services        Software
The following document is a business plan that has been drawn up honestly
by the Company given the Group’s current situation and the economic and
social perspectives of the next four years.

It is not a commitment since it can be impacted by external factors that are
impossible to anticipate at the current time.

However, the Management believes that the Group is henceforth
sufficiently solid to disseminate this information.
1 |				2021-2024 Strategy - English Version

2 |				2021-2024 Strategy - French Version

3 |				A set of slides presenting the Group
       in terms of:
       Expertise, Figures, Investments, the
       Future
PRESENTATION OF OUR
                   2021-2024 STRATEGY

          A French version will follow in order to ensure broader access to this information
2021 - 2024 | STRATEGY                                                                         1

January 2021
SUMMARY

INTRODUCTION                          | PAGE 3

TECHNOLOGIES, CLIENTS & MANAGEMENT    | PAGES 4-5
STRUCTURE

ORGANISATION                          | PAGE 6

STARTING POINT OF THE BUSINESS PLAN   | PAGE 7

2021 BUDGET                           | PAGE 8

2021-2024 BUSINESS PLAN               | PAGE 9

OTHER POTENTIAL GROWTH DRIVERS        | PAGES 10-11

2021 - 2024 | STRATEGY                                2

January 2021

INTRODUCTION
The Group experienced a period of important structural change in 2020.
Following the disposal of the French operations, we now find ourselves in a very strong position in terms of our
key underlying business drivers:
KPIs (profitability, organic growth, backlog, etc.),
Technologies,
Markets (international organisations, governments, key sectors of the economy, etc.),
Geographic presence (North America, Europe, South-East Asia, Australia, etc.),
as such, I’m confident that we are well positioned on the one hand to continue to perform strongly during the
current period of uncertainty bought upon by the COVID pandemic, and on the other hand to take advantage of
the future opportunities which will undoubtedly arise when the economy rebounds.
Along with the key underlying business fundamentals, our strength is also very much due to the quality of the staff
throughout the organisation and the management structures we have put into place.
The management structures are both decentralised and flexible allowing us to respond in a nimble manner to
local market requirements, whilst at the same time possessing strong internal controls, which allow us to track the
performance of the business in granular detail, to identify trends and to allow us to make strategic decisions based
upon real time information.
Following the current year disposal of the French operations and the prior year disposal of APAK, I feel that the
group now offers a much more focussed and coherent proposition to the market.
We have strengthened all of the following areas:
Management teams and wider staff members,
Our technological and functional expertise,
Our global geographic coverage,
Our potential internal synergies.
As such moving in the FY2021, I am extremely confident in relation to the current strength of the Group and its
future financial performance.
2021 - 2024 | STRATEGY 3
January 2021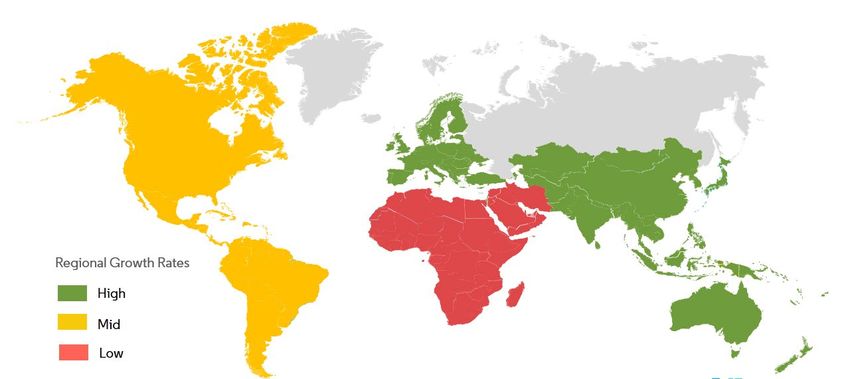
TECHNOLOGIES, CLIENTS & MANAGEMENT STRUCTURE
Ever since its creation 20 years ago, Sword Group has specialised in the management of information and data.
With changes in technology of which Sword has always been at the forefront, our activities have evolved from
document management to the digital management, analysis, and optimisation of information on behalf of our
clients.
The technologies in which we have competencies throughout the organisation are numerous and too widespread
to list, however some of the key areas in which we specialise are:
Software: GRC, Venue Management,
Services: CRM, CS, AI, GIS, IP, RPA, ML, BI, BIG DATA, DATA SCIENCE.
Although the central theme linking all the parts of Sword Group is « Information Management », this can take
many forms and as such, we are present in numerous different vertical markets.
Our client base is wide and diverse which limits our exposure to any one individual vertical market; however, most
of our key clients are either:
Multi-national global organisations,
Governmental organisations,
Financially strong blue-chip clients.
In terms of Sword Group’s offerings, we have subsidiaries, which are present in both the provision of software
and the provision of IT services.
Software
Our principal software subsidiary specialises in the provision of GRC software which analyses large
amounts of disparate information in order to mitigate operational risks on behalf of our clients.
The GRC subsidiary has an impressive client base, which includes clients such as the US Air Force, the
MoD and the Naval Group, which is testament to the credibility of their capabilities and their strategic
importance to their clients.
The company is currently putting in place an ambitious R&D programme to ensure that they remain a
leader in their current markets as well as extending their international presence.
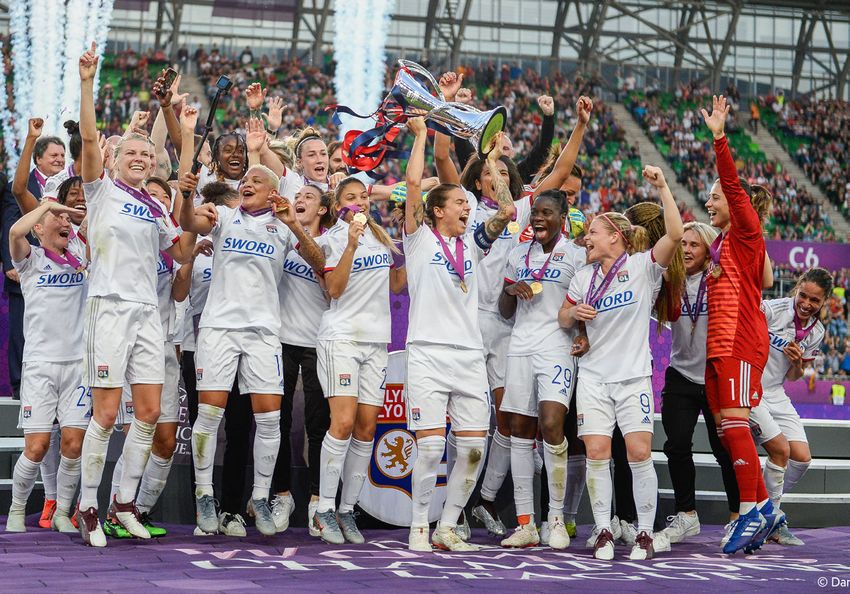
Sword Group is also in the process of launching additional software offerings such as Venue.
Venue is a product, which was initially developed for a Sport Federation and specialises in managing all
areas of the logistical requirements relating to the hosting of large-scale sporting events within stadiums.
This product will also have the potential to be rolled out to other similar markets such as the logistical
requirements relating to the hosting of events within any public building or large-scale gathering.
Due to multiple factors relating to software such as its technical nature, the requirement to have a common
central vision relating to product development, the need for clear client communication etc., we tend to
have one central manager for our software businesses irrespective of whether the organisation spans
multiple geographies.
2021 - 2024 | STRATEGY 4
January 2021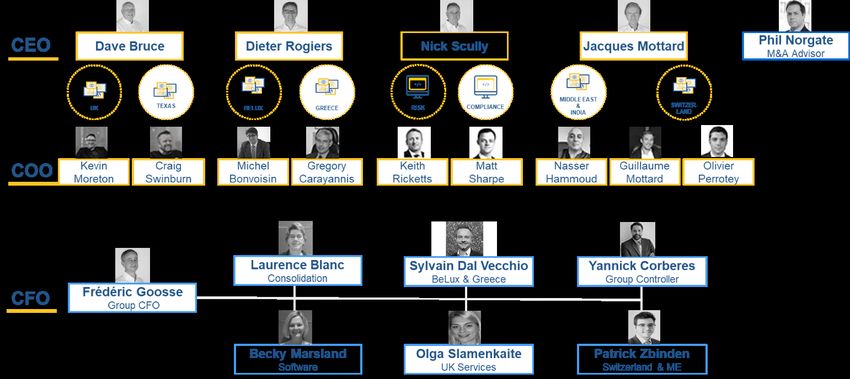
Services
Our services subsidiaries core offerings are centred around information management; however, the exact
offerings vary between subsidiaries and geographies. The decentralised structure we have put in place
allows each subsidiary to fulfil the requirements of their specific vertical and geographical markets. As a
result, each subsidiary has developed deep domain knowledge and functional expertise in their local
markets, for example:
o The European Union in BeLux, we are specialists in providing services to key departments within
the European Union (Customs, Research, Court of Justice, Parliament, EUROSTAT, etc.),
o Governmental Institutions and Oil & Gas in the UK, we have developed strong, lasting
relationships within key sectors of the UK economy (Health, Police, the North Sea, etc.),
o Sport, Luxury goods and International Organisations within Switzerland and New York, we have
long term relationships with international football organisations, leading companies in the luxury
goods industry as well as organisations such as the UNO,
o Governmental and banking markets in the Middle East and the offshore provision of IT services
from Chennai / India as well as Beirut / Lebanon.
The services subsidiaries are managed on a local geographical basis rather than by service or product
line as per the software businesses as this allows us to generate local deep domain knowledge within
specific geographical and vertical markets.
Each individual operation is responsible for their own performance and meeting their own internal growth
targets; however, the subsidiaries will leverage the strength of the Group’s infrastructure and shared
client base wherever possible.
.
2021 - 2024 | STRATEGY 5
January 2021 ORGANISATION
Functional Organisation Chart
Geographical Locations
Clients in 30 countries
GRC Software
Offices in UK / US / Australia / Malaysia
Clients in UK / US / NLA / AUS
UK - US Services
Offices in UK / US / NLA / AUS
Clients in Europe
BeLux - Greece Services
Offices in Belgium / Luxembourg / Greece / Spain
Clients in Switzerland / Canada
Switzerland - Canada Services
Offices in Switzerland / Canada
Clients in US / Canada / Europe / Middle East
Other Services
Offices in India / Lebanon / Dubai / US / Australia
2021 - 2024 | STRATEGY 6
January 2021 STARTING POINT OF THE BUSINESS PLAN
Excluding the entities disposed of in FY2020, the full year financial figures for the Group are as follows:
Revenue: €169.2 million
EBITDA margin: 14.0%
Net cash position: €105.8 million (former standard)
Embedded growth: 8%+
Revenue distribution: 10% products | 90% services
The Group benefits from a dominant position (N°1) in the following key markets:
Risk Management: Defence, Aviation,
UK Services: Oil & Gas,
Services in the BeLux countries: European Union.
In all the other geographical locations where we have a presence, we have become key actors in the local markets,
(for example: Luxury goods and Sport in Switzerland or the UNO in New York and Geneva).
The 2020 consolidated financial performance (including acquisitions) can be found below:
€212.5m 13.9%
Revenue EBITDA
2021 - 2024 | STRATEGY 7
January 2021 2021 BUDGET
Organic Growth
The 2021 budgeted organic growth by entity can be found in the diagram below:
+13.4% | Software worldwide +18.8% | Switzerland-Canada Services
+13.9% | UK-US Services +2.6% | Others Services
+10.9% | BeLux-Greece Services
The 2021 budgeted consolidated financial performance (excluding acquisitions) can be found below:
€191m+ +13%+ 13%+
Organic
Revenue Growth EBITDA
The 2021 targeted consolidated financial performance (including acquisitions) can be found below:
.
€200m+
Consolidated
Revenue
2021 - 2024 | STRATEGY 8
January 2021 2021-2024 BUSINESS PLAN
The revenue performance as per the 2021-2024 business plan (excluding acquisitions and new initiatives) is as
follows:
NB: The table below takes into account a reasonable forecast of our performance up to the end of 2024. However,
several initiatives could make it possible to outperform: some are already present in the document, others are to
come.
Revenue (€m) 2021 2022 2023 2024
SOFTWARE (i) GRC 18.6 20.8 23.3 26.1
BELUX
56.1 62.8 72.4 81.8
GREECE
SWITZERLAND
CANADA 35.4 39.6 44.4 49.7
SERVICES
UK
69.5 79.0 85.8 93.2
US
OTHERS 11.7 12.9 14.2 16.6
TOTAL 191.3 215.1 240.1 267.4
(i)
The revenue of Sword Venue is not included.
The consolidated EBITDA margin will remain at 13%.
The FY2021 to 2024 business plan is based purely on organic growth, any acquisitions which take place or new
initiatives such as R&D programmes will result in higher levels of growth than outlined in the above figures.
2021 - 2024 | STRATEGY 9
January 2021 OTHER POTENTIAL GROWTH DRIVERS NOT BUILT INTO OUR BP
Tipik
Tipik’s recent strategic focus has been on developing high value-added business activities, they have
become specialists in Digital Communication and Applications.
Historically Tipik had a strong presence in the Events Management sector within the European Union.
Although demand for this service has clearly reduced as a result of COVID related factors we still have a
vast amount of knowledge and experience in this sector. Once we come out of the current pandemic it is
felt that there will be a large amount of pent up demand in this sector and Tipik will be well placed to fulfil
future requirements in this field. Due to current uncertainties, we have not factored this potential relay of
growth into our BP.
Tipik has historically worked exclusively with the European Union and they have developed an intricate
understanding of how large-scale organisations operate. Moving forwards, we will be using this
knowledge in order to target other large scale institutions such as the IOC, the UNO, Sport Federations
and other large NGO’s. If successful, this will fuel a further relay of growth, which is not accounted for in
the current BP.
Development of our IT services activities in North America
Our North American strategy is currently headed up by Nick Scully who manages the GRC Software
product out of Washington (Hendon / Virginia).
As a result of demand from our current client base we also have four additional services operations
starting up in North America:
o UNICEF resourcing requirements in NYC,
o IT infrastructure management in Montreal,
o Indian offshore services in Toronto,
o IT services for the Oil & Gas market in Houston.
As these are start-up operations the assumptions made in our BP have been prudent, however moving
forwards we will create a plan that will aim at combining these opportunities in order to create additional
scale and facilitate further penetration into the North American market which could lead to additional
growth.
Sword Venue
Sword Venue is a product that was originally developed in collaboration with a Sport Federation making
it possible to manage all areas of the logistical requirements relating to the hosting of large-scale sporting
events within stadiums.
This product enables our clients to have easy access to some of the following features:
o Simple and efficient access to all diagrammatic plans relating to the stadium (this is all
encompassing and could include architectural autocad designs, details of the pipework,
emergency exits etc.),
o A virtual tour of the building or stadium from distance using Google vision technology allowing
our clients to showcase their stadium to multiple parties at distance. This will be particularly
relevant moving forward given the current COVID crisis and has the capacity to enable our clients
to make huge costs savings associated with travel expenses,
o A simulation function that allows our clients to visualise the reconfiguration of their stadium
depending upon the function it is being used for (for example a concert rather than a sporting
event),
o A logistical visualisation tool which enables any individual to track their movements directly from
arrival at the airport to their seat in the stadium whilst taking into account any necessary security
or social distancing requirements.
Currently this product is focussed purely on stadiums and is being rolled out in collaboration with a Sport
Federation.
2021 - 2024 | STRATEGY 10
January 2021Moving forwards, we will look to develop a commercial plan, which has the objectives of:
o Rolling out the product to other markets (for example: congress centres, public buildings, etc.),
o Further developing a specific COVID related module allowing the product to be updated in real
time to take into account different social distancing regulations in different regions,
o Collaborating with a manufacturer of smart carpets to allow the product to track the movement of
crowds and spectators through the building or stadium.
Sword GRC
Having been in active discussions with potential acquisition targets in the current year we have determined
that the acquisition multiples being requested by potential targets in the GRC sector have been
unreasonable and not accretive for the Group.
As such it has been determined that the most effective way to facilitate growth within the GRC sector is
via an ambitious and aggressive R&D plan to increase our product capabilities and hence the potential
size of our target market.
The table below tracks our current product capabilities in relation to the entire GRC market, the R&D plan
we are putting in place will gradually allow us to fill in the empty boxes in the areas we feel will be most
profitable and easiest to sell into. The increased product capabilities will increase our potential market
share of the whole GRC market.
The current BP does not factor in the potential increased growth, which will be generated as a direct result
of the planned investment into the product.
Acquisitions
The current BP does not take into account the additional growth, which will be generated via acquisitions.
Our key focus is upon driving organic growth within our existing business; however, we will actively look
at potential targets if the opportunity arises and if they fulfil our acquisition criteria.
When evaluating acquisitions, the criteria we look for them to fulfil are:
Market Consolidation,
Geographic expansion,
Deep domain expertise,
Vertical market expansion,
Complementary service offerings,
Accretive.
Given the current uncertainties in the economic environment, we are confident that we will be able to
identify several targets over the coming financial year, which will further facilitate the growth of the Group
moving into FY2021.
2021 - 2024 | STRATEGY 11
January 2021PRÉSENTATION DE NOTRE
STRATÉGIE 2021-2024
2021 - 2024 | STRATÉGIE 1
Janvier 2021SOMMAIRE INTRODUCTION | PAGE 3 OFFRES DU GROUPE | PAGE 4 ORGANISATION | PAGE 5 POINT DE DÉPART DU BUSINESS PLAN | PAGE 6 BUDGET 2021 | PAGE 7 BUSINESS PLAN 2021-2024 | PAGE 8 AUTRES RELAIS DE CROISSANCE | PAGES 9-10 2021 - 2024 | STRATÉGIE 2 Janvier 2021
INTRODUCTION
Le Groupe s’est reconfiguré en 2020, avec la cession de la France, pour être préparé au mieux en termes de :
KPI (rentabilité, croissance interne, backlog, …),
Technologies,
Marchés (organisations internationales, gouvernements, secteurs-clés de l’économie, …),
Localisations (Amérique du Nord, Europe, Asie du Sud-Est, Australie, …),
dans cette période qui connaîtra des risques majeurs (santé publique) et des opportunités importantes (reprise
de l’économie).
Notre force vient de la qualité du staff que nous avons su agréger dans une organisation flexible, extrêmement
décentralisée et contrôlée.
J’ai personnellement l’impression que nous avons atteint, après les cessions d’Apak et de la France, le périmètre
idéal :
Idéal quant à la qualité :
Des personnes qui composent nos équipes,
De nos expertises technologiques et fonctionnelles,
De la couverture géographique mondiale,
Des synergies possibles.
2021 - 2024 | STRATÉGIE 3
Janvier 2021 OFFRES DU GROUPE
Le Groupe opère globalement dans le Data Management qui est son ADN depuis sa création.
En 20 ans, l’offre a évolué du Document Management vers la Gestion Digitale des sociétés et des organisations.
En ce qui concerne la clientèle, Sword Group travaille exclusivement pour des grands comptes, des organisations
internationales et des offices gouvernementaux.
Les principales technologies développées sont :
Software : GRC, Gestion d’Espaces (Venue Management),
Services : CRM, CS, IA, SIG, PI, RPA, ML, BI, BIG DATA, DATA SCIENCE.
Nos cibles clients dépendent du domaine d’activité concerné et de la localisation de nos filiales.
Software
Notre filiale spécialisée en GRC adresse des clients prestigieux. Les noms même mentionnés dans la
liste de ces clients prouvent la crédibilité de l’offre et de la Société : US Air Force, MoD, Naval Group.
Cette Société va développer de nouveaux produits issus d’initiatives en R&D.
Le Groupe travaille par ailleurs au lancement d’autres produits tels que Venue.
Services
Contrairement à l’offre software qui est globalisée et dont le management est centralisé par ligne de
produits, les activités services seront organisées selon une approche locale, pays par pays ou groupe de
pays par groupe de pays.
Outre les technologies présentées précédemment, la valeur ajoutée de nos filiales provient aussi de leur
connaissance fonctionnelle et de leur adaptation à chaque culture, comme par exemple :
o L’Union Européenne au BeLux, avec la déclinaison de nos savoir-faire par grands domaines
fonctionnels (Douanes, Recherche, Cour de Justice, Parlement, EUROSTAT),
o Les Institutions Gouvernementales et « l’Oil & Gas » au Royaume-Uni, avec la déclinaison de
nos savoir-faire par grands marchés (Santé, Police, Mer du Nord, …),
o Le Sport, le Luxe et les Organisations Internationales en Suisse et à New-York, avec notre
capacité à servir des organismes tels que l’ONU ou des Sociétés leaders dans le monde du luxe
ou des organisations internationales dans le sport,
o Les marchés gouvernementaux et bancaires au Moyen-Orient, ainsi que l’offre offshore depuis
Chennai / Inde et Beyrouth / Liban.
La croissance organique requise se fera localement, mais pourra aussi se faire géographiquement en profitant
de la présence de nos clients dans d’autres pays.
2021 - 2024 | STRATÉGIE 4
Janvier 2021 ORGANISATION
Organigramme fonctionnel
Présentation succinte des implantations
Clients dans 30 pays
GRC Software
Bureaux en UK / US / Australie / Malaisie
Clients en UK / US
UK - US Services
Bureaux en Ecosse / Angleterre / US
Clients en Europe
BeLux - Grèce Services
Bureaux en Belgique / Luxembourg / Grèce / Espagne
Clients en Suisse / Canada
Suisse - Canada Services
Bureaux en Suisse / Canada
Clients aux US / Canada / Europe / Moyen Orient
Autres Services
Bureaux en Inde / Liban / Dubaï / US / Australie
2021 - 2024 | STRATÉGIE 5
Janvier 2021 POINT DE DÉPART DU BUSINESS PLAN
Sans prendre en compte les entités cédées en 2020, les chiffres du Groupe à fin 2020 sont les suivants :
Chiffre d’affaires : 169,2 M€
Marge d’EBITDA : 14,0 %
Position cash nette : 105,8 M€ (anciennes normes)
Croissance embarquée : 8 %+
Répartition du CA : 10 % produits | 90 % services
Le Groupe bénéficie d’une position dominante (numéro 1) dans des secteurs-clés tels que :
Risk Management : Défense, Aviation,
Services au UK : « Oil & Gas »,
Services au BeLux : Union Européenne.
De plus, partout ailleurs où nous sommes implantés, nous sommes devenus des acteurs-clés sur certains
marchés (ex : luxe et sport en Suisse, ou l’ONU à New-York et à Genève).
Les résultats financiers consolidés pour 2020 (y compris les acquisitions) sont présentés ci-dessous :
212,5 M€ 13,9 %
Chiffre EBITDA
d’Affaires
2021 - 2024 | STRATÉGIE 6
Janvier 2021 BUDGET 2021
Croissance organique
Le budget 2021 prévoit que chaque entité va croître de façon organique selon le schéma suivant :
+13,4% | Software monde +18,8% | Suisse Services
+13,9% | UK - US Services +2,6% | Autres Services
+10,9% | BeLux - Grèce Services
De manière consolidée, le budget 2021 -sans intégrer les acquisitions- sera le suivant :
191 M€+ +13 %+ 13 %+
Chiffre Croissance
d’Affaires Organique EBITDA
En termes consolidés, nous ciblons de conserver un chiffre d’affaires 2021 supérieur à 200 M€ grâce à
des petites acquisitions.
200 M€+
Chiffre
d’Affaires
Consolidé
2021 - 2024 | STRATÉGIE 7
Janvier 2021 BUSINESS PLAN 2021-2024
En termes de chiffres d’affaires, le business plan 2021-2024 -hors acquisitions et en-dehors de nouvelles
initiatives- est le suivant :
Chiffre d’Affaires (M€) 2021 2022 2023 2024
SOFTWARE (*) GRC 18,6 20,8 23,3 26,1
BELUX 56,1 62,8 72,4 81,8
GRÈCE
SUISSE 35,4 39,6 44,4 49,7
CANADA
SERVICES
UK 69,5 79,0 85,8 93,2
US
AUTRES 11,7 12,9 14,2 16,6
TOTAL 191,3 215,1 240,1 267,4
(*) ces prévisions ne prennent pas en compte des initiatives telles que le lancement du software Sword Venue.
La marge d’EBITDA consolidée restera à 13 %.
Il n’y aura pas de changement majeur par rapport aux principes du budget 2021 : croissance organique, micro-
acquisitions, développement du GRC. Le chiffre d’affaires des micro-acquisitions n’est naturellement pas
budgété.
Il est par contre souhaitable, durant ces années, de renforcer le pôle Software, et outre le plan de R&D, nous
resterons en veille pour saisir d’éventuelles opportunités d’acquisitions en temps voulu dans ce domaine.
2021 - 2024 | STRATÉGIE 8
Janvier 2021 AUTRES RELAIS DE CROISSANCE NON ENCORE PRIS EN COMPTE
DANS NOTRE BP
Tipik
Tipik est à l’origine une « Communication Agency » qui a petit à petit signé des marchés avec l’Union
Européenne sur de la communication, des outils digitaux de communication et de l’organisation
d’événements.
Quand Sword a reconsolidé Tipik, c’était avec une stratégie précise : se spécialiser dans les outils digitaux
de communication et limiter notre implication dans la gestion physique des événements. Notons que ce
métier reste encore accessible à Tipik dans le cas d’appels d’offres globaux de l’UE.
Cette stratégie, qui a conduit à réduire significativement le chiffre d’affaires de Tipik (la tendance de chiffre
d’affaires actuelle est de 10 M€), a permis de développer des savoir-faire qui, dans la période actuelle,
s’avèrent salutaires pour le devenir de cette Société.
Pour preuve, l’exemple du dernier contrat événementiel avec l’UE où Tipik était en charge d’une
manifestation regroupant 35 speakers, 450 participants capables de prendre la parole à la demande, et
échangeant en 23 langues.
Pour le moment, nous avons conservé une stratégie ciblant exclusivement l’UE, mais dans les mois à
venir, nous envisagerons d’élargir la cible de Tipik aux grandes organisations telles que le CIO, l’ONU,
les fédérations sportives, les grandes ONG, …
Le continent nord-américain et le Service
Pour le moment, la stratégie nord-américaine est portée par le GRC et le software depuis Washington
(Herndon / Virginie).
Il s’avère que, de manière opportuniste, nous avons 4 activités en démarrage :
o L’UNICEF à NYC,
o Des activités de gestion d’infrastructures informatiques à Montréal,
o Des missions dans « l’Oil & Gas » à Houston,
o Des activités de développement offshore pour nos clients de Toronto.
D’ici quelques mois, nous allons envisager un plan qui fédère ces initiatives et qui pourrait booster notre
activité Services dans cette région.
Sword Venue
Sword Venue est un outil développé initialement pour une grande fédération sportive, permettant de gérer
les stades par :
o Une vision géographique des plans en tous genres (un clic pour obtenir un plan de canalisations,
aussi bien qu’un plan de masse),
o Une vision Google intérieure au stade (« googleisation » réalisée naturellement par nos soins et
interfacée avec la vision Google globale qui conduit aux portes du stade),
o L’annotation qui consiste à reconfigurer un stade en fonction de son utilisation (exemple : concert
vs compétition sportive)
o La mobilité qui permettra à toute personne d’être conduite depuis l’aéroport à son siège en
respectant les règles sécuritaires et sanitaires.
Pour le moment, cette activité est freinée par la crise Covid et ne s’adresse qu’aux stades (exemple :
Wembley, qui est une initiative cogérée par une grande fédération sportive et nous-mêmes).
D’ici quelques mois, nous travaillerons sur un plan de développement :
o Qui intègre d’autres marchés (exemple : centres de congrès, bâtiments publics, etc…),
o Qui prenne en compte les contraintes sanitaires et donc les barrières sociales nécessaires.
Et nous allons de plus nous associer avec un fournisseur de tapis intelligents permettant de repérer des
mouvements de foule.
2021 - 2024 | STRATÉGIE 9
Janvier 2021 Sword GRC
Après avoir mené des discussions avec des cibles d’acquisitions potentielles en 2019 et en 2020, nous
avons conclu que les multiples d’acquisitions demandées dans ce secteur étaient déraisonnables et
surtout très loin d’être relutifs pour le Groupe.
Nous avons donc décidé que le meilleur moyen de dynamiser notre croissance était d’envisager un plan
de R&D ambitieux et agressif, visant à augmenter les capacités de nos produits existants et de développer
des produits complémentaires sur ce marché.
Le tableau ci-dessous synthétise l’ensemble des produits existants et des produits à développer :
Le plan en question est programmé sur les années 2021 et 2022.
Le business plan actuel ne prend pas en compte la croissance complémentaire générée par cette
initiative.
Acquisitions
Le business plan présenté ne prend pas en compte la croissance complémentaire qui pourrait être
générée par des petites acquisitions.
En tout état de cause, notre objectif principal est de nous développer sur une base de croissance
organique. Cependant, nous examinerons activement des cibles potentielles si l’occasion se présente.
Les critères recherchés sont les suivants :
o Consolidation du marché,
o Expansion géographique,
o Nouvelles expertises,
o Offres de services complémentaires,
o Relutivité.
Compte-tenu des incertitudes économiques, nous pensons que nous pourrons identifier plusieurs cibles
en 2021 et en 2022 qui viendront compléter la croissance organique du Groupe.
2021 - 2024 | STRATÉGIE 10
Janvier 2021APPENDICES Group’s Offer | PAGES 1-4 Group’s Offer by Divisions | PAGES 5-21 2020 Figures | PAGES 22-29 2021 Budget | PAGES 30-31 Software Sizing Markets | PAGES 32-38 Competition | PAGES 39-41 Sword GRC R&D Plan | PAGES 42-49
Group’s Offer

                Sword Group - January 21   1
Group’s Offer | Software & IT Services
SERVICES SOFTWARE
Creating Value through technology & improvement Adding Value through innovative software solutions
CRM ANALYTICS CS AI GIS SEARCH VENUE GRC
PORTAL
DIGITAL DATA
PERFORMANCE OPTIMISATION
Skills & expertise, to accelerate Making Data Work Smarter
your digital transformation.
Health Luxury Aerospace Sport Energy Finance Transportation Government International Construction
Industry & Defence Orgs
Sword Group - January 21 2Leadership
GRC Number 1 in Risk Management worldwide Software
UK Number 1 in Oil & Gas sector in Scotland Services
BELUX Number 1 in new contracts with the EU Services
Sword Group - January 21 3Key Player
SWITZERLAND Luxury, Sport Services
WORLDWIDE UN Services
Sword Group - January 21 4Group’s Offer by
Divisions
Sword Group - January 21 5HIGHLIGHTS
4 Offices:
Kuala Lumpur, London, Melbourne, Washington
#1 in Project Risk Management Worldwide
2021 TRENDS GOVERNANCE
€18.0m+
Revenue RISK & COMPLIANCE
+13.0%
Organic Growth at constant
perimeter and constant exchange
rates
25.0%
EBITDA MarginSword GRC Software
Software
Highlights:
2020 EBITDA performance
A resilient business Still winning new customer every 12 days
maintaining profitability New version of ARM released
& strongly placed for Strength of Defence Sector
future growth Customer retention (95%+)
ANZ and US
Global
#1 in Project Risk
Management Revenue US & ANZ
Worldwide
$5.6m Europe remains engine
$4.2m $3.4m supported by strong
organic growth across US
$1.9m & ANZ
2018 2020
2018 2020
2018 US ANZ
Sword Group - January 21 7Sword GRC | Growth Opportunities
Software
Stable, resilient business
Current Market leading product in capital projects (ARM) Deliver significant profitable
status Dominant position A&D and Transportation revenue growth across Europe,
Global multinational blue chip clients US & ANZ whilst pushing further
Strong client retention rates into Asia & South America.
Strong profitability (25% EBITDA margin)
Extensive R&D Initiative leading to:
Expansion into Enterprise Risk Management
Improvement New offering in Health & Safety market
Further inroads into capital project arena
Strengthening of Financial Services solution
Maintain and extend capital projects leadership
2025 objective
Gain market share in Financial Services, leading to:
Strong growth,& doubling of revenue over five
years (£15m end of 2020 to £32m in 2025)
Targeted EBITDA margin of 30% by 2025
Sword Group - January 21 8HIGHLIGHTS
7 Offices:
Aberdeen, Edinburgh, Glasgow, Houston, London,
Perth, Staines
#1 in the Oil & Gas Sector in Scotland
UK
2021 TRENDS
€69.0m+
Revenue
+13.0%+
Organic Growth at constant
perimeter and constant exchange
rates
14.0%
EBITDA MarginSword UK Services
Services
Revenue by Sector
£42m
Platform
We’ve created a £17m
strong platform 2020
£6.5m £7m
for growth 2017
£4m
2020 £2m
2017 2020
UK 2017
Energy Public Finance/Other
#1 in the Oil & Gas
Revenue by Location
Sector in Scotland
70% 60% Diversification
Strong organic growth
34% across multiple sectors,
2017 2020 14%
focusing on London
16%
6% 2020 growth
2017 2020 2017
Aberdeen Edinburgh/ Glasgow London
Sword Group - January 21 10Sword UK Services | Growth Opportunities
Services
A strong business
Team capable of delivering double digit growth Deliver revenues across all
Current sectors whilst reducing overall
status
Blue chip clients
Leading company on the Oil & Gas market dependency on energy
Greater sector focus
Reduce dependency on energy
Improvement Increase sales in public & finance
Acquire in public & finance sectors
Support energy transition to renewables
Focused in three sectors (Government, Energy, Finance)
2025
Annuity, IP and International revenues
objective
€120m revenue in 2025 (from €60m in 2020)
Sword Group - January 21 11HIGHLIGHTS
4 Offices:
Athens, Barcelona, Brussels, Luxembourg
Top player in application services and
communication services at the European
Institutions
BELUX-GREECE
2021 TRENDS
€56.0m+
Revenue
+12.0%+
Organic Growth at constant
perimeter and constant exchange
rates
9.0%
EBITDA MarginSword BeLux-Greece Services
Services
Highlights
New signed contracts in 2020 > €120m
Important backlog of > €230m
New offers with overall value of > €350m
Acquisition of Lemonade Software Development
Sword Greece: growth engine
BeLux-Greece
Key player in
application services and Revenue in Greece Expanding Business
communication services
at the European €6.5m Strong organic growth across
Institutions €5.7m multiple activity domains,
€4.4m
capitalising the opportunities
€3.0m and budget increase of many
2020
2019 non BeLux-Greece based
€1.0m 2018
2017 European Agencies &
2016
Institutions
Greece
Sword Group - January 21 13Sword BeLux-Greece | Growth Opportunities
Services
Top 7 player at the European Institiutions
Very high winning rate of > 75 %
Current Strong nearshore delivery capacity
status Yearly Organic growth of > 15 % since 2015 Focus on Strong
Strong recurrent revenues of > 90 % and continuous
Important backlog of > 200 Million Euro organic growth
across multiple
activity domains,
Startup and Initiation of newly signed Framework Contracts
capitalising the
Accelerate growth path while securing existing business opportunities and
Improvement Focus on profitability budget increase of
Enlarge customer basis
many non BeLux-
Leverage the nearshore business model on TIPIK
Greece based
European
Agencies &
Top 3 player at the European Institutions Institutions
2025 objective
€100m revenue in 2025 (from €50m in 2020)
EBITDA margin: 9%+ in 2025
Backlog of > 350 Million Euro
Sword Group - January 21 14HIGHLIGHTS
5 Offices:
Freiburg, Geneva, Lausanne, Montreal, Nyon
Key player in Sport, Luxury
and at the United Nations
Top 5 in IT outsourcing companies in CH landscape
SWITZERLAND
2021 TRENDS
€35.0m+
Revenue
+18.0%+
Organic Growth at constant
perimeter and constant exchange
rates
10.0%
EBITDA MarginSword Switzerland Services
Services
Fundamentals Highlights
Within global context, Solid organic growth +9%
Swiss economy remains robust, Launch of Sword Venue product
with strong fundamentals and New “Long Term Agreements” signed
pragmatic support from Federal State. within Public and Insurance sectors
#1 place worldwide for Innovation A leading actor in cloud transformation
with major deals signed in the financial
Switzerland industry and Public Sector
Revenue by sectors
Key player in Sport,
Luxury
18% 23% 22% 24% 12% 20% 48% 33%
and at the United Sword Switzerland
Nations maintains strong presence
in 3 key sectors: Luxury,
International Organisations
Top 5 in IT outsourcing (UN + Sport) and Public
2019 2020 2019 2020 2020 2019 2020
companies in CH Administration
2019
landscape
Int. Organisations Public Other
Luxury & Retail (UN + Sport) Administration Markets
Percentage of consolidated revenues by industry, Sword Switzerland Sword Group - January 21 16Sword Switzerland -1- | Growth Opportunities
Services
Top 5 global IT outsourcing partner in French-speaking CH
Current Established Long Term Agreements for 2020-2024
status Client portfolio incl. International Organisations and Institutions 2025: Continuous growth leading
Strong recurring revenue (>60%) Technological Transformation for
International Organizations and
Administrations
Organic growth inside UN agencies and Financial Services
Top 3
Improvement Build innovating service and product offering in Sport
Institutions
Develop nearshore based offerings
Top 3
Int. Organizations
Sword Venue to become the leading product in its market field
2025 objective Sword to become #1 in local governments (cantons)
Top 3 global IT outsourcing partner in French-speaking CH Industry
€34m revenue in 2025 (from €20m in 2020) Sport & Events
Sword Group - January 21 17Sword Switzerland -2- | Growth Opportunities
Services
Swiss reference in Microsoft Cloud technologies
deployment
Current A highly spread turnover
status 24/7 IT operations department
Strong annual organic growth: c.20%
mitigating risk
Recurring revenue up to 80% thanks MSP contracts
Improvement Use Canada for 24/7 IT operations
Set up Devops practice
Acquisition of a small company
2025 objective Reach 9% EBITDA margin (from 6% in 2020)
+50% backlog in term of months
€22m Revenue in 2025 (from €9.3m in 2020)
Sword Group - January 21 18HIGHLIGHTS
4 Offices:
Beirut, Chennai, Dubai, New-York
Near/Off-Shore services Reach 5 Continents
OTHERS
2021 TRENDS
€11.0m+
Revenue
2.0%
Organic Growth at constant
perimeter and constant exchange
rates
16.0%+
EBITDA MarginSword Middle East & India Services
Services
2020 Highlights:
A Robust business
Strong Profitability
maintaining Growth &
High Business resilience to the Pandemic
(Customer retention = 100%)
Profitability
New Customers & Long term projects
New Version of the Mobile & Internet
Banking App
Global Increase in backlog
Near/Off-Shore services
Reach 5 Continents
Revenue by Market Location
54% 40%
24%
2018 2020 20% 21 % 21%
15%
5%
2018 2020 2020 2018 2020
2018
Middle East
Europe North America (UAE, Kuwait, A-NZ
Lebanon, Jordan)
(France, Switzerland, UK) (USA, CANADA) (Australia, NZ)
Sword Group - January 21 20Sword Middle East & India | Growth Opportunities
Services
Customers over 5 continents
Current Multinational blue chip clients
status Focused on growth & high profitability (20%+ EBITDA margin) 2021+: Continue to develop multi-
Strong recurring revenue (70%) national prestigious Clients while
focusing on Quality & Innovation
Reinforce our commercial presence in North America & UK
Build capacity in new technologies (Cloud, AI, RPA, AR/VR)
Improvement Add new features to our internal banking product (BEAM)
Accelerate the growth in UAE by micro acquisitions
Build Innovating offering for GCC Markets
Multiple Long Term Agreements with International
Organisations
Higher market share in North America thanks to our offshore
2025 objective offerings
Increase BEAM revenue
€20m Revenue in 2025 (from €8.9m in 2020)
Doubling the number of customers with recurring revenues
Sword Group - January 21 212020 Figures
Not audited at January, 25th
Sword Group - January 21 22Figures | Consolidated Performance -1-
13.9%
EBITDA Margin
€212.5m
2020 Consolidated
Revenue
Sword Group - January 21 23Figures | Consolidated Performance -2-
€m (i) 2020 REVENUE 2020 EBITDA
Perimeter without France 169.2 23.7 | 14.0%
Sold Perimeter 43.3 5.8 | 13.4%
TOTAL 212.5 29.5 | 13.9%
(i) adjusted figures
Sword Group - January 21 24Figures | 2020 Synthesis
€m (*) FY2020 FY2019
Organic Growth
France excluded
EBITDA EBITDA
Revenue EBITDA Revenue EBITDA
% %
Governance Risk & Compliance 16.4 25.3% 4.1 17.5 24.4% 4.3 -6.3%
BeLux 50.6 9.7% 4.9 45.3 9.4% 4.3 +11.7%
Switzerland 29.8 10.2% 3.0 28.0 12.3% 3.4 +6.4%
UK 61.0 15.6% 9.5 52.1 12.2% 6.4 +13.2% (i)
Others 11.4 18.0% 2.1 10.7 14.3% 1.5 +6.5%
IT Services 152.8 12.8% 19.5 136.1 11.5% 15.6 +12.3%
TOTAL 169.2 14.0% 23.7 153.6 12.9% 19.9 +9.2%
(*) Percentages and amounts are calculated from figures in €k.
(i) Note that the UK Services growth rate is impacted by the acquisition made by the UK
Sword Group - January 21 25Figures | Breakdown
Breakdown FY/Q4/Q3/H1 in 2020 for the pro forma perimeter (excluding France):
€m FY Q4 Q3 H1
Revenue 169.2 45.3 41.8 82.1
EBITDA 23.7 7.6 6.2 9.9
EBITDA Margin 14.0% 16.8% 14.7% 12.1%
Organic Growth +9.2% +13.0% +12.8% +6.4%
Sword Group - January 21 26Figures | Net Cash Position
31/12/2020 | former standard
Net Cash Position: €105.8m
31/12/2020 | IFRS16 & earn out excluded
Net Cash Position: €98.0m
Sword Group - January 21 27Figures | Backlog
Number of Months Compared to
Total 17.5 €230m
France 7.6 €60m
Total post closing 26.4 €170m
Sword Group - January 21 282020 Dividends | €2.4
+24% +21% 0% +22% -1%
2016 Total Share 2017 Total Share 2018 Total Share 2019 Total Share 2020 Total Share
Return (TSR) Return (TSR) Return (TSR) Return (TSR) Return (TSR)
01/01: €24.30 - 31/12: 01/01: €29.04 - 31/12: 01/01: €33.84 - 31/12: 01/01: €29.00 - 31/12: 01/01: €34.10 - 31/12:
€29.04 €33.84 €29.00 €34.10 €31.35
Dividend paid in 2016: Dividend paid in 2017: Dividend paid in 2018: Dividend paid in 2019: Dividend paid in 2020:
€4.8 €1.2 €4.8 €1.2 €2.4
+7.2% +20.8% -21.6% +19.0% +1.2%
CAC MID&SMALL CAC MID&SMALL CAC MID&SMALL CAC MID&SMALL CAC MID&SMALL
2016 2017 2018 2019 2020
+46% +19% +29% +15%
2015 2014 2013 2012 Sword Group - January 21 292021 Budget
Sword Group - January 21 302021 | Simplified Budget
ORGANIC
€m REVENUE EBITDA MARGIN EBITDA
GROWTH
SOFTWARE (i)
GRC 18.6 25.0% 4.7 +13.4%
SOFTWARE | TOTAL 18.6 25.0% 4.7 +13.4%
IT SERVICES
BELUX - GREECE 56.1 9.0% 5.0 +10.9%
SWITZERLAND - CANADA 35.4 10.2% 3.6 +18.8%
UK - US 69.5 14.3% 9.9 +13.9%
MIDDLE EAST - INDIA 11.7 16.7% 2.0 +2.6%
IT SERVICES | TOTAL 172.7 11.9% 20.6 +13.0%
TOTAL 191.3 13.2% 25.2 +13.1%
(i) The Revenue of Sword Venue is not included
Sword Group - January 21 31Software Sizing Markets
Sword Group - January 21 32Market Sizing
Sword Group - January 21 33Sword GRC | Market Sizing
GRC
$32 Market
Place
billion Source:
MarketsAndMarkets
Global GRC market size is
expected to grow from USD 32.6
Source:
GRC/2020
billion in 2020 to USD 60.2 billion
by 2025 Source:
MarketsAndMarkets
Projected Value Compound Annual
Growth Rate
$60 billion
In 2025
Global projected value of selected segments by 2025.
13.5%
Sword Group - January 21 34Sword GRC | Market Sizing & Focus
GRC
Focus & Strategic growth areas
Growth and market leadership achieved
by delivering superior solutions for our
key target industries
Government: The largest USA Federal
Agencies including Department of
Defence; Department of Energy; and the
Department of Homeland Security;
Aerospace & Defence: 8 of the 9 largest
Global A&D companies as customers
including Lockheed Martin; Raytheon;
BAE Systems; Northrop Grumman;
General Dynamics; Airbus Group;
Thales; Pratt & Whitney
Construction: The largest
construction company in the United
States - Bechtel
Sword Group - January 21 35Market Sizing
Sword Group - January 21 36Sword Venue | Event Management Software Market Sizing
VENUE
Source:
Estimate Sword 2020
Source: Mordor Intelligence $5.7 billion Event Mgt Software market
Source: MarketsAndMarkets
Source: MarketsAndMarkets
Projected Value Compound Annual Global Event Management
Growth Rate Software market is expected to
$11.4 billion
in 2024
Global ‘Events Industry’ market size for all segments by 2026
15% grow from $5.7 billion in 2019 to
$11.4 billion by 2024
Sword Group - January 21 37Sword Venue | Event Management Software Market Sizing & Focus
VENUE
FOCUS ON…
Sport industry operating a major shift
Some Major upcoming events 2020-2024
towards digital adoption post COVID-19
Budget: €6.8 billion
Budget: €500 million Budget: €1.7 billion
Sword Group - January 21 38Sword Competition
Sword Group - January 21 39Competition | IT Services
CRM ANALYTICS CS AI GIS SEARCH
PORTAL
SPECIALISTS
OPENTEXT 1SPATIAL
INCREMENTAL PALANTIR DOCUMENTUM PEAK AI EXAKIS
ARX IT
ANDURIL GPARTNER
THE
GROUP NUANCE COMPUTHINK ESRI PS
Q ASSOCIATES INDUSTRIES JOUVE
GRAPH LAND
INC OPTALITIX SMILE
MAGELLIUM
GENERALISTS
ACCENTURE, ARHS, ATOS, BULL, CAP GEMINI, CGI, ELCA, EUROPEAN DYNAMICS,
THE
EVERIS, FUJITSU, IBM, INTRASOFT, ORANGE, SERCO, SOPRA, SQLI, UNISYS, WIPRO
Sword Group - January 21 40Competition | Software
GRC VENUE
ACUMEN RISK
SPECIALISTS
BWISE ATTENDIFY
RESOLVER EVENTUAOSITY
THE
RISK DECISIONS ONEPLAN
XACTIUM UNGERBOECK
GENERALISTS
ARCHER, CURA, DNV EASY RISK, IBM ACTIVE NETWORKS, ATOS, AVENTRI,
THE
OPENPAGES, METRICSTREAM, SAP, EVENTBOOKING, EVENTBRITE, SOCIAL
SCHLEUPEN AG, WOLTERS KLUWER TABLES, WHOVA, RAINFOCUS, SECUTIX,
WETRACK
Sword Group - January 21 41Sword GRC
R&D Plan
Sword Group - January 21 42Sword GRC | Why Invest?
GRC
It is business imperative to ensure that solutions within this sector remain relevant at all times & if
possible, at the forefront of technological advancement
Sword GRC are at a cross-roads:
Either
> a) carry on as we are & drip feed new product, or
> b) seize initiative & capitalise on success enjoyed to date, combined with expected upturn in interest in
risk management, driven by the pandemic
There may never be quite as good a time for this type of investment than now
Sword Group - January 21 43Sword GRC | Why Invest?
GRC
Investment is requested across ARM as well as SORM & SAM (latter acquired from Magique Galileo in
January 2019)
ARM:
> Health & Safety Module
> Enterprise Risk Management
> Schedule Risk Analysis
> Business Continuity Planning
> Desktop re write
Relevant to ARM, SORM & SAM:
> Visualiser
> Risk Connectivity
SORM & SAM
> SCM (Sword Compliance Manager)
> SPM (Sword Policy Manager) & ViewPoint Integration
Sword Group - January 21 44Sword GRC | How much to Invest?
GRC
£10.0m
This will enable 53 extra development staff over a two year period (inclusive of additional costs
such as recruitment)
Other costs such as extra sales are enabled as part of the annual standard budget process
This investment would catapult Sword GRC forward and provide huge potential for future
growth
Sword Group - January 21 45Sword GRC | What get back from Investment?
GRC
By 2025, annual revenue estimated at £32m with EBITDA at c.£9.5m vs £23.3m with EBITDA of £5.8m
forecasted in our BP 2021-2024 for 2024
With this investment, and the appropriate execution thereafter, the Enterprise Value of Sword GRC
should increase to c.£150m on the basis of the current market
Sword Group - January 21 46Sword GRC | Post Investment Position
GRC
Sword Group - January 21 47Sword GRC | Why not Invest in all hexagonal areas?
GRC
Even with a €10m investment, it is not possible to cover every area of the GRC landscape
1. IT GRC
a) This is the stronghold of Archer (Dell) & is the favourite of IT Directors. IT GRC provides for control and governance over
the IT landscape & encompasses many different integration points to plug data into such as vulnerability databases etc.
b) It is also the area that Cyber risk management occupies. This is a specialist area that would take significant expenditure
to create a viable solution
c) This is a potential “Acquisition” area, but prices are typically high
Sword Group - January 21 48Sword GRC | Why not Invest in all hexagonal areas?
GRC
2. Internal Control Management
a) Is partially covered by the investment in ERM
b) But this also includes automatic control management from external data sources such as battery health levels in a power
plant. We have no plan in this area
3. Environmental Management
- Loosely tied to Health and Safety
- Perhaps the next project once this investment is completed
4. Remaining boxes
a) We expect some natural cross over into these through the investment
b) This could then be extended with future development if we could demonstrate a market opportunity
c) This would be longer term aspirations for building, or targets for acquisition
Sword Group - January 21 49FOLLOW SWORD
sword-group.com @Sword_Group Sword Group @SwordGroup Sword Group
Sword Group SE
www.sword-group.com 2, Rue d’Arlon
L-8399 Windhof investorrelations@sword-group.luYou can also read