Fourth quarter 2018 - Scatec Solar
←
→
Page content transcription
If your browser does not render page correctly, please read the page content below
Fourth quarter 2018
About Scatec Solar
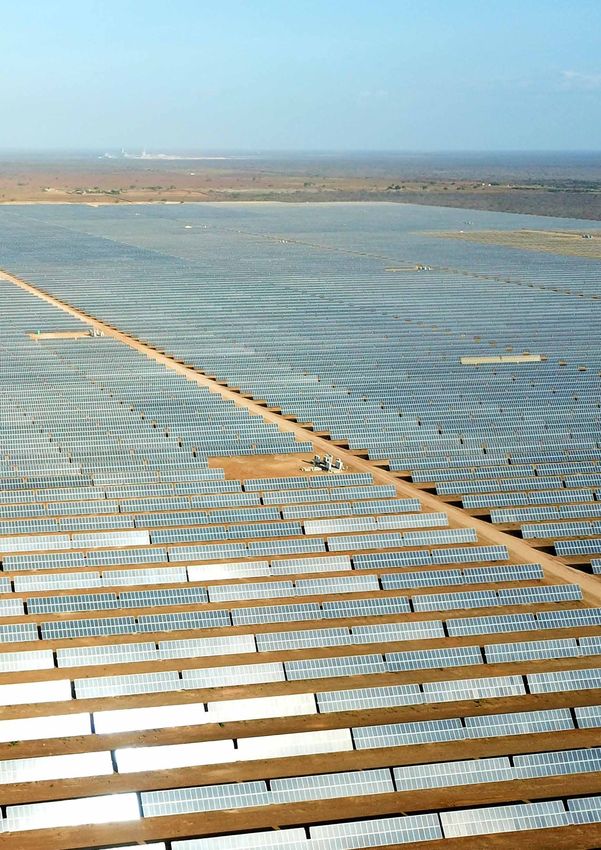
Scatec Solar is an integrated independent solar power producer, delivering affordable, rapidly deployable and sustainable clean
energy worldwide. A long- term player, Scatec Solar develops, builds, owns, operates and maintains solar power plants and
has an installation track record of more than 1 GW. The company has a total of 1.7 GW in operation and under construction
in Argentina, Brazil, the Czech Republic, Egypt, Honduras, Jordan, Malaysia, Mozambique, Rwanda, South Africa and Ukraine.
With an established global presence and a significant project pipeline, the company is targeting a capacity of 3.5 GW in operation
and under construction by end of 2021. Scatec Solar is headquartered in Oslo, Norway and listed on the Oslo Stock Exchange
under the ticker symbol ‘SSO’.
Asset portfolio 1)
CAPACITY ECONOMIC
MW INTEREST 2)
In operation
South Africa 190 45 %
Brazil 162 44 %
HQ
Honduras 95 51 %
Ukraine Malaysia 65 100 %
Jordan 43 59 %
Czech Republic Czech Republic 20 100 %
Jordan Rwanda 9 54 %
Total 584 55 %
Egypt
Under construction
Mali
Egypt 400 51 %
Honduras
South Africa 258 46 %
Malaysia Malaysia 179 100 %
Argentina 117 50 %
Rwanda Ukraine 77 70 %
Brazil Mozambique 40 52 %
Mozambique Total 1,071 59 %
South Africa Projects in backlog
Argentina Ukraine 174 65 %
Mali 33 51 %
Honduras 18 70 %
Total 225 64 %
Grand total 1,880 58 %
Projects in pipeline 4,454
Solar power plants in operation: 584 MW Plants under construction: 1,071 MW Projects in backlog: 225 MW
Segment overview
Power Production
The plants produce electricity for sale under 20-25 year fixed priced contracts, normally with inflation adjustments, power
purchase agreements or feed-in tariff schemes. The segment also comprise asset management services provided to solar power
plants controlled by Scatec Solar.
Operation & Maintenance
The Operation & Maintenance segment comprises services provided to solar power plants controlled by Scatec Solar. Revenues
are generated on the basis of fixed service fees with additional profit-sharing arrangements.
Development & Construction
The Development & Construction segment derives its revenues from the sale of development rights and construction services
delivered to power plant companies controlled by Scatec Solar.
Corporate
Corporate consists of activities of corporate services, management and group finance.
1) Per reporting date.
2) Scatec Solar’s share of the total estimated economic return from its subsidiaries. For projects under development the economic interest may be subject to change.Scatec Solar ASA 3
Q4’18 Highlights
• Solid operational performance and strong financial results
Proportionate revenues and EBITDA
NOK MILLION
• Q4’18 proportionate revenues of NOK 1,666 million
and EBITDA of NOK 329 million
2,000
• D&C revenues of NOK 1,466 million and EBITDA of
1,500
NOK 202 million – 16% gross margin
• 162 MW in Brazil and 65 MW in Malaysia in commercial 1,000
operation, capacity reached 584 MW
500
• Construction start for four projects in Argentina,
Malaysia and Ukraine totaling 241 MW 0
Q4 2017 Q1 2018 Q2 2018 Q3 2018 Q4 2018
• The Board of directors has proposed dividends of
NOK 0.95 per share Revenues and other income EBITDA
Key figures
NOK MILLION Q4 2018 Q3 2018 Q4 2017 FY 2018 FY 2017
PROPORTIONATE FINANCIALS 1)
Revenues and other income 1,666 1,259 444 4,725 1,680
Power Production 180 155 132 622 544
Operation & Maintenance 15 22 15 81 69
Development & Construction 1,466 1,077 294 4,005 1,054
Corporate 5 4 4 17 13
EBITDA 329 257 106 961 792
Power Production 139 127 107 492 454
Operation & Maintenance (O&M) 2 11 4 34 28
Development & Construction (D&C) 202 130 10 488 361
Corporate -14 -11 -15 -53 -50
Operating profit (EBIT) 276 200 66 773 632
Profit/(loss) 204 110 -35 398 326
Net interest- bearing debt 4,214 3,093 2,013 4,214 2,013
Power production (GWh) 108 73 71 318 282
SSO proportionate share of cash flow to equity 2): 183 141 22 481 265
CONSOLIDATED FINANCIALS 3)
Revenues and other income 344 294 282 1,213 1,492
EBITDA 257 221 207 902 1,231
Basic earnings per Share (NOK) 0.40 0.13 -0.34 1.29 3.37
Power Production (GWh) 224 155 167 681 627
1) See Other definitions appendix for definition.
2) See Alternative Performance Measures appendix for definition.
3) See Note 2 Operating Segments in Condensed interim financial information for reconciliation between proportionate and consolidated financials.4 Fourth quarter 2018
Group – Proportionate financials
FY FY The proportionate revenues increased by 32% in fourth
NOK MILLION Q4’18 Q3’18 Q4’17 2018 2017
quarter 2018 compared to previous quarter, mainly explained
by a significant increase in D&C activities. Furthermore,
Revenues and other income 1,666 1,259 444 4,725 1,680
power revenues increased based on achieving commercial
Gross profit 432 342 188 1,321 1,068
operation for the Los Prados (Honduras), Gurun (Malaysia)
Operating expenses -103 -85 -83 -360 -276
and Apodi (Brazil) power plants. Revenues and profitability in
EBITDA 329 257 106 961 792
the other business segments remained fairly stable.
EBITDA margin 1) 20% 20 % 24 % 20% 47 %
D&A and impairment -53 -57 -40 -188 -160
Operating expenses increased in fourth quarter, mainly
EBIT 276 200 66 773 632
Cash flow to equity 1) 183 141 22 481 265
driven by operating expenses on the new plants in operation.
Development & Construction activities contributed with
NOK MILLION
NOK 202 million of a total EBITDA of NOK 329 million for the
2,000 quarter. EBITDA for the full year increased strongly compared
1,500 to last year mainly explained by higher construction activities.
The EBITDA in 2017 was included a NOK 375 million gain
1000
on the partial sale of the Apodi project in Brazil in third
500 quarter 2017.
0
Q4 2017 Q1 2018 Q2 2018 Q3 2018 Q4 2018 During the fourth quarter, financial close was achieved for
Revenues and other income EBITDA the Guanizuil project (117 MW) in Argentina, the Redsol
project (47 MW) in Malaysia as well the Rengy (47 MW)
and Kamianka (30 MW) projects in Ukraine.
1) See Alternative Performance Measures appendix for definition.
Power Production
FY FY The Power Production segment had an installed capacity
NOK MILLION Q4’18 Q3’18 Q4’17 2018 2017
of 584 MW at the end of the fourth quarter and reached
production of 108 GWh compared with 73 GW in the
Revenues and other income 180 155 132 622 544
previous quarter and 71 GW in the same quarter last year.
Operating expenses -41 -29 -25 -130 -90
The increase in production volume and revenues is mainly
EBITDA 139 127 107 492 454
driven by new power plants reaching commercial operation
EBITDA margin 1) 77% 82% 81% 79% 83%
as well as asset management services rendered to new power
D&A and impairment -52 -38 -39 -164 -156
plants. Further, Scatec Solar’s increased ownership share in
EBIT 88 89 68 328 298
Cash flow to equity 1) 48 47 30 157 143
the South African plants Kalkbult, Linde and Dreunberg with
effect from September 2018.
The increase in operating expenses from fourth quarter last
NOK MILLION GWH
year is explained by the new plants set in operation, as well
200 125 as commencement of asset management activities for plants
150 100 under construction. As asset management services yields
75 lower margin than sale of electricity, the EBITDA margin for
100
50 the fourth quarter and full year is reduced compared to last
50 25 year. This margin impact is reinforced during construction as
0 0 the company is earning asset management revenues but no
Q4 2017 Q1 2018 Q2 2018 Q3 2018 Q4 2018 power sales revenue is this phase.
Revenues and other income EBITDA
Power production (GWh) See additional information on page 16 for a specification of
financials and power production for each individual power
1) See Alternative Performance Measures appendix for definition. plant company.Scatec Solar ASA 5
Operation & Maintenance (O&M)
FY FY O&M revenues in the fourth quarter reflect steady operation
NOK MILLION Q4’18 Q3’18 Q4’17 2018 2017
of the power plant portfolio and includes revenues from the
Apodi plant in Brazil, the Gurun plant in Malaysia as well
Revenues and other income 15 22 15 81 69
as the Los Prados plant in Honduras which all commenced
Operating expenses -13 -11 -11 -48 -41
operations in the quarter. The quarter on quarter decrease
EBITDA 2 11 4 34 28
in revenues is explained by weather seasonality resulting in
EBITDA margin 1) 12% 49% 25% 41% 40%
lower performance ratio for the portfolio in South Africa.
D&A and impairment - - - -1 -1
EBIT 2 11 4 33 27
The revenue and profitability growth in 2018 are explained by;
Cash flow to equity 1) 2 9 3 26 22
commencement of O&M operations in Malaysia, Brazil and
Honduras, as well as the catch-up of previously unrecorded
revenues for two of the plants in Jordan.
NOK MILLION
30 Operating expenses mainly constitute fixed expenses and
recurring maintenance activities according to a maintenance
20
schedule.
10
The profitability of the segment reflects somewhat lower
0 margins on new O&M contracts as well as increased
Q4 2017 Q1 2018 Q2 2018 Q3 2018 Q4 2018 overhead cost in preparation for O&M for plants under
Revenues and other income EBITDA construction.
1) See Alternative Performance Measures appendix for definition.
Development & Construction (D&C)
FY FY The D&C revenues in the fourth quarter were generated
NOK MILLION Q4’18 Q3’18 Q4’17 2018 2017
by the projects in Honduras, Malaysia, Brazil, Mozambique,
Egypt, South Africa, Ukraine and Argentina. Accumulated
Revenues and other income 1,466 1,077 294 4,005 1,054
progress across construction projects under way at the end of
Gross profit 232 160 38 601 442
the fourth quarter was 43%.
Gross margin 1) 16% 15% 13% 15% 42%
Operating expenses -30 -30 -28 -113 -82
Construction was completed for Gurun in Malaysia and Apodi
EBITDA 202 130 10 488 360
in Brazil in the quarter. Financial close was achieved and
D&A and impairment -1 -18 -1 -21 -3
EBIT 201 113 7 467 358
construction started for the 117 MW Guanizuil project in
Cash flow to equity 1) 157 105 8 383 167 Argentina, the 47MW Redsol project in Malaysia as well as the
47MW Rengy project in Ukraine.
NOK MILLION
The 15.9% gross margin for the quarter reflects the current
1,500 mix of projects under construction and development. Quarterly
fluctuations in gross margin must therefore be expected. For
1,000
the full year, the gross margin reached the target of 15%.
500
Operating expenses comprised of approximately NOK 17
0 million (18) for early stage development of new projects and
Q4 2017 Q1 2018 Q2 2018 Q3 2018 Q4 2018 NOK 13 million (9) related to the construction business.´
Revenues and other income EBITDA
Depreciation, amortization and impairment amounted to
NOK 1 million (1).
1) See Alternative Performance Measures appendix for definition.
2) Figures in brackets refer to same quarter previous years. The gross profit in 2017 was positively affected by the NOK
375 million gain on the partial sale of the Apodi project in Brazil.6 Fourth quarter 2018
Corporate
FY FY Revenues in the corporate segment refers to management
NOK MILLION Q4’18 Q3’18 Q4’17 2018 2017
fees charged to the other operating segments for corporate
services rendered across the Group and remains fairly stable
Revenues and other income 5 4 4 17 13
from quarter to quarter.
Operating expenses -19 -16 -19 -70 -63
EBITDA -14 -11 -15 -53 -50
Operating expenses are fairly stable during 2018 and the
D&A and impairment -1 -1 - -2 -1
increase compared to 2017 reflects the strengthened
EBIT -15 -12 -15 -55 -51
corporate functions over the recent quarters. These functions
Cash flow to equity 1) -24 -20 -19 -85 -65
include management and corporate services such as finance,
1) See Alternative Performance Measures appendix for definition. legal, HR, IT, corporate communication and sustainability.
Short term guidance
Power production well as increased overhead cost in preparation for O&M for
The estimated production for full year 2019 is based on plants under construction.
production from plants in operation at year-end 2018.
Development & Construction
GWH Q4’18 Q1’19E 2019E D&C revenues and margins are dependent on progress on
development and construction projects.
Proportionate 108 140-160 575 – 625
100% basis 224 260-300 1,050 - 1,150
The 1,071 MW currently under construction represent
awarded Development & Construction contracts with a value
Operation & Maintenance of about NOK 8.4 billion. The remaining, not booked, contract
2019 Operation & Maintenance revenues are expected to reach value at the end of 2018 was about NOK 4.8 billion.
NOK 110-120 million with an EBITDA margin of around 30%.
Corporate
The increased revenues reflect commencement of O&M Corporate costs are expected to remain at current levels as
services for new power plants while the lower EBITDA margin the corporate functions have been strengthened over the
reflects somewhat lower margins on new O&M contracts as recent quarters.Scatec Solar ASA 7
Outlook
The solar market is growing strongly, and Scatec Solar is continuously developing a large project pipeline across a number of
markets and is well positioned for continued solid growth over the years to come. Refer also to project overview on page 10
for details.
Scatec Solar’s targets for capacity growth and financial performance towards 2021 as announced at the Capital Markets
Update 30 May 2018 remain unchanged:
1.7 GW 1.8 GW TOTAL
IN OPERATION & UNDER NEW CAPACITY 3.5 GW
CONSTRUCTION TOWARDS 2021 BY END 2021
Post tax equity IRR 15% 15% 15%
D&C gross margin 15% 12 - 15% 12-15%
SSO’s economic interest 57% 50% – 70% 50% – 70%
Capex (NOK million), 100% 20,700 13,000 – 15,000 34,000 – 36,000
SSO’s equity investments (NOK million) 3,500 1) 1,800 – 2,300 5,200 – 5,800
D&C Cash flow to equity (NOK million) 950 – 1,050 1,000 – 1,500 2,000 – 2,500
Annual cash flow to equity Power Production and O&M (NOK million) 500 – 550 250 – 300 750 – 850
1) About NOK 500 million remains to be invested. Based on equity financing of the Los Prados project.
Figures in the table above are estimates.
Recent corporate activity across the solar energy sector dynamics. To assist the Board and the management in their
indicates an increased interest for renewable assets from further considerations, the Group has engaged J.P. Morgan
both industrials and financial investors. As a leading inde- and Carnegie as financial advisors.
pendent solar power producer in emerging markets Scatec
Solar should be well prepared to take part in these market8 Fourth quarter 2018
Consolidated statement of profit and loss
Profit and loss Net financial items
NOK MILLION Q4’18 Q3’18 Q4’17 FY 18 FY 17 NOK MILLION Q4’18 Q3’18 Q4’17 FY 18 FY 17
Revenues 344 294 282 1,213 1,492 Financial income 13 61 10 197 51
EBITDA 257 221 207 902 1,241 Financial expenses -164 -121 -147 -518 -524
Operating profit (EBIT) 187 143 148 629 993 Foreign exchange gains/(loss) 59 -22 1 15 -60
Profit before income tax 95 60 12 323 460 Net financial items -92 -83 -136 -306 -532
Profit/(loss) for the period 76 36 -1 226 438
Profit/(loss) to Scatec Solar 45 14 -35 140 339
Profit/(loss) to non-controlling
During the second quarter 2018, forward exchange contracts
interests 31 22 33 86 99 (FEC) were set up in order to eliminate currency exchange
risk in the Upington projects in South Africa. The fourth
Revenues quarter loss following the mark-to-market revaluation of
Revenues from power sales were up 9% compared to the open USD and EUR FECs amounts to NOK 22 million (0). For
same quarter last year. The increase in revenues is mainly the full year, the Group recorded a gain of NOK 147 million.
explained by the grid connection of the Los Prados and The FECs are carried at fair value and fluctuate with
Gurun power plants 30 September and 21 December 2018 changes in the exchange rates throughout the contract period.
respectively. For the remaining power plants, the change
in production volume from last year is driven by regular Financial expenses mainly consist of interest expenses on
operational variability. non-recourse financing, NOK 113 million (100), and corporate
funding, NOK 18 million (11). The interest expenses are in
Revenues also include increased earnings, NOK 33 million line with the trend from 2017. In the fourth quarter 2017
(-7), from joint ventures mainly related to the equity the Group recorded a one-off expense of NOK 27 million
consolidated investments in Brazil and Argentina. related to the refinancing of the senior unsecured bond.
See note 6 for further information on the bond.
Included in the revenues and net profit for 2017 was a
gain of NOK 375 million related to the partial sale of the Profit before tax and net profit
Apodi project in Brazil to Equinor. The effective tax rate was 20% in the fourth quarter. The
underlying tax rates in the companies in operation are in the
Operating profit range of 0% to 33%. In some markets, Scatec Solar receives
Following the increased portfolio of power producing assets, special tax incentives intended to promote investments in
the profitability has increased in both relative and absolute renewable energy. The average effective tax rate fluctuates
terms compared to the first three quarters of 2018. The from quarter to quarter mainly based on construction
Group has in recent quarters invested in both early progress. For further details, refer to note 7.
stage development activities and also strengthening of the
organisation following the commencement of several Non-controlling interests (NCI) represent financial investors
construction projects. This explains the growth in operating in solar power plants. The allocation of profits between
expenses compared to last year. NCI and Scatec Solar is impacted by the fact that NCI only
have shareholdings in solar power plants, while Scatec Solar
Consolidated operating expenses amounted to NOK 87 also carries the cost of project development, construction,
million (74) in the fourth quarter. This comprised operation & maintenance and corporate functions.
approximately NOK 42 million (32) for operation of
existing power plants, NOK 17 million (18) for early stage For the full year power production revenues increased to
development of new projects, NOK 13 million (9) related to NOK 1,151 million (1,121). Operating expenses increased to
construction and NOK 15 million (15) of corporate expenses NOK 311 million (250) while net profit decreased to NOK 226
(excluding eliminated intersegment charges). million (438), mainly driven by the Apodi projects sale in 2017.Scatec Solar ASA 9
Impact of foreign currency changes in the quarter quarter. These currency effects are to a large extent related
During the fourth quarter the NOK depreciated against the to non-cash effects on intercompany balances.
ZAR, USD and CZK compared to the average rates for the
third quarter. This positively affected consolidated revenues Following the movements in currencies in the fourth quarter,
by approximately NOK 4 million quarter on quarter while the Group has recognised a foreign currency translation gain
the net impact on net profit in the quarter was approximately of NOK 102 million in other comprehensive income related
NOK 3 million. to the conversion of the subsidiaries’ statements of financial
position from the respective functional currencies to the
The quarter-on-quarter net foreign currency gains were up Group’s reporting currency.
NOK 81 million, from a loss of NOK 22 million in the third
quarter compared to a gain of NOK 59 million in the fourth Scatec Solar has not hedged the currency exposure on the
expected cash distributions from the power plant companies.
Consolidated statement of financial position
Assets Equity and liabilities
NOK MILLION Q4’18 Q4’17 NOK MILLION Q4’18 Q4’17
Property, plant and equipment 9,008 5,618 Equity 2,475 1,887
Other non-current assets 1,407 961 Non-current non-recourse project financing 8,643 6,164
Total non-current assets 10,415 6,580 Other non-current liabilities 1,940 1,254
Other current assets 1,139 797 Total non-current liabilities 10,583 7,418
Cash and cash equivalents 3,303 2,863 Current non-recourse project financing 364 317
Total current assets 4,442 3,661 Other current liabilities 1,413 619
Total assets 14,857 10,240 Total Current liabilities 1,800 935
Total liabilities 12,384 8,353
In the consolidated statement of financial position, the solar Total equity and liabilities 14,857 10,240
power plant assets are valued at the Group’s cost, reflecting Book equity ratio 16.7% 18.4%
elimination of gross margins generated through the project
development and construction phase. At the same time, the Total equity increased by NOK 588 million during 2018.
ring-fenced non-recourse debt held in power plant assets is The main drivers being the share capital increase and profit,
consolidated at full value. These accounting principles reduce partly offset by dividend distributions. The decreased book
the consolidated equity ratio. equity ratio is mainly explained by the net effect of the above
as well as increased current liabilities. The latter is associated
The 58% net increase of non-current assets is mainly driven by with the progress of the construction activities and related
the construction activities in Mozambique, Honduras, Malaysia, supplier credits as well as shareholder loans provided by
Brazil, Egypt, South Africa, Ukraine and Argentina. This is partly non-controlling interests in the Egypt project portfolio.
offset by depreciation of the operating power plants. Also related to the increased construction activities, current
and non-current non-recourse project finance debt had a
Current assets increased 21% compared to fourth quarter net increase NOK 2,526 during 2018.
2017 mainly driven by increased cash balance following draw
down on non-recourse loans for the above-mentioned projects. The more relevant equity to capitalisation ratio for the
See note 6 for a detailed breakdown of cash balances and as Recourse Group 1) (excluding the non-recourse financed
well as an overview of movement of cash at the group level project entities) as defined in the corporate bond agreement
(Recourse Group). was 81% at the end of the third quarter. See note 6 for more
information on the corporate bond agreement.
1) See Alternative Performance Measures appendix for definition.10 Fourth quarter 2018
Consolidated cash flow Republic, partly offset by debt repayments for 2018 in line
with the agreed repayment schedule on the non-recourse
Net cash flow from consolidated operating activities financing loans. The cash flow to equity in the O&M segment
amounted to NOK 184 million (176) in the fourth quarter is on a normalized level and influenced by seasonal variations.
2018, compared to the EBITDA of NOK 257 million. The The cash flow to equity in the Development & Construction
difference is primarily explained by changes in working segment is driven by the increased portfolio of construction
capital, mainly related to power plants under construction. projects throughout the year.
Net cash flow from consolidated investing activities was
NOK -1,268 million (-536), driven by further investment in Risk
new power plants as well as development of project pipeline
and backlog. Scatec Solar has entered into long-term fixed price contracts
for the sale of electricity from all its current solar power
Net cash flow from financing activities was NOK 2,230 million plants and the entry into such contracts is a prerequisite for
(1,932), impacted by proceeds from non-recourse- and NCI financing and construction of the projects in the backlog and
financing of NOK 2,397 million (1,974) and NOK 163 million pipeline. All existing electricity sales contracts are entered
(10) respectively, partly offset by interest and down payments into with state-owned utilities typically under regulation of
on non-recourse financing of NOK 330 million (276). various state programs to promote renewable energy. As a
consequence, Scatec Solar is to a certain degree subject to
For the full year, net cash flow from consolidated operating political risk in the countries it operates.
activities was NOK 1,248 million (844), while the net negative
cash flow from consolidated investing activities was NOK Scatec Solar mitigates political risk in emerging markets
-3,732 million (-874). Net cash flow from consolidate through partnerships with multilateral development banks as
financing activities amounted to NOK 2,857 million (1,640). project finance lenders and/or through establishing project
risk insurance covering from the World Bank and others.
Refer to note 6 for a detailed cash overview.
The main economic risk going forward relates to operational
Proportionate cash flow to equity performance of existing power plants, timely completion
of solar plants under construction and progress in the
Scatec Solar’s “proportionate share of cash flow to equity” 1), transitioning of projects in backlog through financial close
is an alternative performance measure that seeks to estimate and into construction.
the Group’s ability to generate funds for equity investments
in new solar power plant projects and/or for shareholder Scatec Solar operates in several regions of the world with
dividends over time. complex risk environments. This primarily relates to political,
compliance, integrity and security risk. The Group mitigates
these risks through comprehensive due diligence processes
NOK MILLION Q4’18 Q3’18 Q4’17 FY 18 FY 17
whereby country risk, permits, project agreements, partners,
execution plans, security and all other relevant aspects of the
Power Production 48 47 30 157 143
project are carefully assessed. These assessments are done in
Operation & Maintenance 2 9 3 26 22
close cooperation with a number of advisors including global
Development & Construction 157 105 8 383 167
risk and security consultancies.
Corporate -24 -20 -19 -85 -65
Total 183 141 22 481 265
In terms of specific financial risks, Scatec Solar is mainly
exposed to currency risk, credit risk, liquidity risk and to some
The increased cash flow to equity in the Power Production extent interest rate risk. Financial risk management in Scatec
segment compared to fourth quarter and full year 2017 Solar is based on the objective of reducing cash flow effects
is primarily explained by the new plants set in operation in and to a less extent accounting effects of these risks.
Brazil, Honduras and Malaysia, asset management fees to
plants in construction and higher production in the Czech For further information refer to the 2017 Annual Report.
1) See Alternative Performance Measures appendix for definition.Scatec Solar ASA 11
Related parties Dividend policy
Note 27 in the annual report for 2017 provides details of The Group’s objective is to pay shareholders consistent and
transactions with related parties and the nature of these growing cash dividends. Scatec Solar’s dividend policy is to,
transactions. For details on fourth quarter 2018 related over time, pay its shareholders dividends representing 50%
party transactions, see note 9 of this interim report. of free cash distributed from the producing power plant
companies. For 2018, NOK 216 million has been distributed
from the power plant companies.
Forward looking statements
In line with the dividend policy, the Board of Directors have
Forward-looking statements reflect current views about resolved to propose to the ordinary General Meeting of Scatec
future events and are, by their nature, subject to significant Solar that a dividend of NOK 0.95 should be paid for 2018.
risk and uncertainties because they relate to events and
depend on circumstances that will occur in the future.
Although Scatec Solar believes that these assumptions were
reasonable when made, the Group cannot assure that the
future results, level of activity or performances will meet
these expectations.12 Fourth quarter 2018
Project overview
Q4’18 Q3’18
CAPACITY CAPACITY
PROJECT STAGE (MW) 1) (MW)
In operation 584 357
Under construction 1,071 1,057
Project backlog 225 459
Project pipeline 4,454 3,820
1) Status per reporting date.
Projects under construction and backlog
Project backlog is defined as projects with a secure off-take agreement and assessed to have more than 90% likelihood of
reaching financial close and subsequent realisation.
ANNUAL
CAPEX (100%, PRODUCTION SSO ECONOMIC
LOCATION CAPACITY (MW) CURRENCY 1)
MILLION) (100%, GWH) DEBT LEVERAGE INTEREST
In Operation 584 9,526 1,091 55%
Under construction
BenBan, Egypt 400 USD 450 870 75% 51%
Upington, South Africa 258 ZAR 4,760 650 77% 46%
Jasin & Merchang, Malaysia 132 MYR 823 186 80% 100%
Guanizuil, Argentina 117 USD 95 310 60% 50%
Redsol, Malaysia 47 MYR 200 65 75% 100%
Rengy, Ukraine 47 EUR 52 60 70% 51%
Mocuba, Mozambique 40 USD 80 75 72% 52%
Kamianka, Ukraine 30 EUR 35 39 70% 100%
Total Under Construction 1,071 NOK 2) 11,215 2,257 59%
Backlog
Segou, Mali 33 EUR 52 60 75% 51%
Los Prados II, Honduras 18 USD 20 35 70% 70%
Ukraine 174 EUR 193 221 70% 65%
Total Backlog 225 NOK 2) 2,588 316 64%
Total 1,880 NOK 2) 23,330 3,664 58%
1) ‘Currency’ specifics of PPA tariff, capex and project finance debt.
2) All exchange rates to NOK are as of 31 December 2018.
Total annual revenues from the 1,880 MW in operation, under construction and in backlog is expected to reach NOK 3,600 million
based on 20-25-year Power Purchase Agreements (PPAs).
Scatec Solar will build, own and operate all power plants in the project backlog and pipeline.Scatec Solar ASA 13
Under construction Commercial operation for the Gurun solar plant was reached
on December 19, 2018.
BenBan, Egypt, 400 MW
In April 2017, Scatec Solar and partners signed six 25-year Commercial operation for the two other solar plants has been
PPAs for projects in “Round 2” of the FiT program in Egypt delayed and is expected to be achieved within the next couple
totalling 400 MW (DC). of months.
All located in the Ben Ban area near Aswan in Upper Egypt. Guanizuil, Argentina, 117 MW
Total investments for the 400 MW of solar plants is estimated In June 2018, Scatec Solar together with Equinor signed an
at USD 450 million and the plants are expected to generate agreement with the Portuguese company Martifer Renewables
annual revenues of about USD 60 million over the 25-year for the acquisition of the Guanizuil IIA project in Argentina.
contract period.
The project was awarded a PPA in the RenovAR auction
Scatec Solar is partnering with local developers, KLP Norfund process held by CAMMESA, the Argentinian Wholesale
Investments and Africa50 for equity investments in the projects. Power Market Administrator, in November 2017. The
partners signed the 20-year PPA in November 2018.
European Bank for Reconstruction and Development (EBRD)
is leading a consortium of banks providing total debt of USD Total capital expenditure to realise the plant is estimated
335 million. at USD 103 million and the plant will be owned 50% by
Scatec Solar and 50% by Equinor.
Construction started in the second quarter 2018 and grid
connection is expected during second half of 2019. Scatec Solar will be project lead in a jointly owned construction
company while Equinor will provide a construction bridge loan
Upington, South Africa, 258 MW covering 60% of the capex required for the project. The project
In April 2015 Scatec Solar was awarded preferred bidder company will source all major components to the project directly.
status for three projects in Upington in the fourth bidding The partners have started a process to secure suitable long-
round under REIPPP (Renewable Energy Independent Power term project financing to the project.
Producer Programme) in South Africa.
Construction started late 2018 with expected commercial
Scatec Solar will build, own and operate the solar power operation by the end of 2019.
plants with a 42% shareholding. Norfund holds 18%, the
surrounding Community of Upington 5% and a South African Rengy, Ukraine, 47 MW
Black investor hold the remaining 35% of the equity. In December 2018, Scatec Solar and partners reached financial
close for the Rengy project in the Mykolaiv region in the south
Financial close for the projects was reached in April 2018. of Ukraine with a total investment of EUR 52 million.
A consortium of commercial banks and Development
Finance Institutions with Standard Bank in the lead are EBRD and the Black Sea Trade and Development Bank (BSTDB)
providing non-recourse project finance to the project. signed credit agreements of 50% each of the non-recourse debt
financing of the project. The credit facilities amount to EUR 36
Construction activities are on track with grid connection million and covers 70% of the total project costs.
expected towards the end of 2019.
Scatec Solar owns 51% of the project and Rengy Development
Jasin & Merchang, Malaysia, 132 MW Group holds the balance.
In December 2016, Scatec Solar partnered with a local
ITRAMAS-led consortium that had signed three 21-year The project will be realised under the country’s 10-year Feed-
PPAs with the country’s largest electricity utility, Tenaga in-Tariff scheme and are expected to produce about 58 GWh
Nasional Berhad (TNB). per year. Public land will be leased for an extended time-period
and the plants are expected to deliver power also beyond the
Financial close and construction start was in October 2017. Feed-in-tariff period.
Project debt financing was raised through an Islamic Green
Bond of MYR 1,000 million. Construction started late 2018 with commercial operation
expected during 2019.14 Fourth quarter 2018
Redsol, Malaysia, 47 MW Backlog
In December 2017, Scatec Solar were awarded the Redsol
project under Malaysia’s second large scale solar tender Ukraine, 174 MW
round. The power plant is expected to deliver 67 GWh of During 2018, Scatec Solar signed agreements securing projects
electricity per year with annual revenues of approximately with total capacity of 251 MW in Ukraine. Two of these projects
USD 6 million. secured financing in 2018 and moved into construction.
Scatec Solar closed financing for the project in December 2018 All the projects will be realized under the country’s Feed-in-
with a total investment of approximately USD 47 million. Tariff scheme and the portfolio is expected to produce about
BNP Paribas will provide the non-recourse project finance 220,000 MWh per year. The plants are expected to deliver
facility for the project, covering 73% of the project cost. power also beyond the 10-year Feed-in-tariff period.
Construction started late 2018 with grid connection Total capex for the projects is estimated to EUR 193 million.
expected in fourth quarter 2019. The project finance process has been initiated for the projects
with the European Bank of Reconstruction and Development
Mocuba, Mozambique, 40 MW (EBRD) and FMO in lead. Grid connection of the plants is
In October 2016, Scatec Solar and Norfund signed a PPA expected towards the end of 2019.
securing the sale of solar power over a 25-year period to the
state-owned utility Electricidade de Mozambique (EDM). Scatec Solar will be the lead equity investor in the projects
and is targeting to secure additional equity partners for
Scatec Solar will build, own and operate the solar power the projects. Further, Scatec Solar will be the Engineering,
plants with a 52.25% shareholding. Norfund and EDM will Procurement and Construction (EPC) provider and provide
hold the remaining part of the equity. Operation & Maintenance as well as Asset Management
services to the power plants.
Scatec Solar and partners reached financial close in March
2018 with debt financing from IFC, the International Finance Segou, Mali, 33 MW
Corporation, a member of the World Bank Group, and the In July 2015, Scatec Solar ASA together with its development
Emerging Africa Infrastructure Fund, managed by Investec partners International Finance Corporation (IFC) and Power
Asset Management and a part of the Private Infrastructure Africa 1, signed a 25-year PPA with Energie du Mali (EDM).
Development Group (PIDG).
IFC and African Development Bank (AfDB) will provide the
Construction activities continues according to plan with non-recourse project finance for the project. The project
expected grid connected during first half of 2019. has also been awarded a USD 25 million concessional loan
from the Climate Investment Funds under the Scaling Up
Kamianka, Ukraine, 30 MW Renewable Energy Program.
In December 2018, Scatec Solar closed financing for the
30 MW Kamianka project in the Cherkassy region in Scatec Solar will build, own and operate the solar power plant
central Ukraine with a total investment of EUR 35 million. with a 51% shareholding. IFC Infraventures and Power Africa
will hold the remaining part of the equity.
EBRD and FMO, the Dutch development bank signed credit
agreements for the non-recourse debt financing of the The lenders, IFC and the African development Bank, have
project. The credit facilities amount to EUR 24.5 million approved the project finance for the project. Scatec Solar
and covers 70% of the total project costs. and partners are working to obtain final approvals from the
Government of Mali on the project agreements.
The project will be realised under the country’s 10-year
Feed-in-Tariff scheme and are expected to produce about Los Prados II, Honduras, 18 MW
39 GWh per year. Public land will be leased for an extended In October 2015, Scatec Solar and Norfund acquired the
time-period and the solar power plant is expected to deliver Los Prados project holding a 20-year PPA with Empresa
power also beyond the Feed-in-tariff period. Nacional de Energía Eléctrica (ENEE), the state-owned utility.
The project is owned 70% by Scatec Solar and 30% by KLP
Construction started early 2019 with commercial operation Norfund Invest.
expected in fourth quarter 2019.Scatec Solar ASA 15
The 35 MW Phase I of the project was grid connected and In addition to South Africa, Scatec Solar is developing a broad
reached commercial operation at the end of third quarter pipeline of projects across a number of markets including
2018. The 18 MW Phase II will be realised after required Egypt, Nigeria, Kenya and in a number of other countries on
grid upgrades have been completed by ENEE. the continent, in addition to negotiating a number of potential
corporate PPAs.
Pipeline Europe and Central Asia (523 MW)
Ukraine, Poland and Pakistan are key markets currently
In addition to projects in backlog Scatec Solar holds a solid being pursued by Scatec Solar in Europe and Central Asia.
pipeline of projects totalling 4,454 MW across four key
regions. The pipeline has increased by more than 600 MW In Ukraine, Scatec Solar is developing projects totalling
over the last quarter through systematic project development 163 MW in addition to the 251 MW in project backlog and
efforts in a number of markets where both governments and under construction. Ukraine is committed to integrate with
corporate off-takers are seeking to source solar energy. the EU energy system with ongoing electricity market reforms
and aiming to replace nuclear reactors and reduce supply of
Russian gas with a target of 11% renewables by 2020.
LOCATION CAPACITY (MW)
In Pakistan, the 150 MW project portfolio in Sindh were
Latin America 833
awarded a “costs plus tariff” of 52.6 USD/MWh in January
Africa 2,186
2018. Scatec Solar and Nizam Energy has applied for the
Europe & Central Asia 523
issuance of the power purchase agreement and the
South East Asia 912
implementation agreement.
Total pipeline 4,454
South East Asia (912 MW)
Latin America (833 MW) Malaysia, Bangladesh and Vietnam are key markets for Scatec
Scatec Solar’s development efforts in Latin America is mainly Solar in South East Asia. In Malaysia, it is expected the new
focused on Brazil and Argentina. Scatec Solar is partnering government will maintain the same level of ambition for the
with Equinor in these markets. renewable energy sector as before. Scatec Solar continues
to prepare for the next tender round as well as pursuing a
Argentina is targeting to further expand its RenovAR number of bi-lateral opportunities.
program. PPAs have already been awarded to renewable
energy projects of more than 4 GW. Over the past 18 months, In Bangladesh, the first project developed by Scatec Solar of
approximately 1.5 GW of solar projects have been awarded in 60 MW has been approved by the Prime Minister and a tariff
two consecutive utility scale solar auctions. level has been awarded. Scatec Solar is now working with the
authorities to finalise project agreements. In parallel, Scatec
Brazil is a well-established market for renewable energy with Solar is developing other projects and is in total working on a
about 1 GW of solar capacity installed and another 1 GW portfolio of about 310 MW.
under construction.
In Vietnam, the government is expected to announce a new
In both markets Scatec Solar is seeking to acquire project rights feed-in tariff level shortly. Scatec Solar is currently working
from previous tender rounds, secure sites for participation on a portfolio of about 400 MW of projects in the country to
in upcoming tenders as well negotiating corporate PPAs. be positioned for the future feed-in tariff in Vietnam.
Africa (2,186 MW)
Scatec Solar holds sites representing 516 MW ready to be bid
in the upcoming tender rounds in South Africa. A new tender
(“round 5”) under the REIPPP program is expected to be
launched in 2019.16 Fourth quarter 2018
Proportionate financials
Break down of power production segment
Key financials
Q4 2018
CZECH SOUTH
NOK MILLION REPUB. AFRICA RWANDA HONDURAS JORDAN BRAZIL MALAYSIA OTHER TOTAL
Revenues 14 102 2 22 15 10 4 11 180
OPEX -4 -9 -1 -5 -3 -3 -1 -16 -41
EBITDA 10 93 2 16 12 7 3 -4 139
EBITDA margin 74 % 91 % 68 % 72 % 83 % 68 % 74 % -37 % 77 %
Net interest expenses 1) -5 -29 -2 -4 -7 -1 - 4 -44
Normalised loan repayments 1) -7 -15 -1 -5 -6 -1 -1 - -36
Normalised income tax payments 1) 1 -13 - - - -1 - 2 -11
Cash flow to equity -1 37 -1 8 -1 4 2 1 48
SSO economic interest 100% 45% 54% 51% 60% 44 % 100 % - -
Net production (GWh) 2.8 51.8 1.7 18.1 10.7 16.1 7.5 - 108.5
1) See Alternative Performance Measures appendix for definition.
Q4 2017
CZECH SOUTH
NOK MILLION REPUB. AFRICA RWANDA HONDURAS JORDAN BRAZIL MALAYSIA OTHER TOTAL
Revenues 11 85 4 11 15 - - 5 132
OPEX -3 -7 -1 -2 -2 - - -11 -25
EBITDA 8 78 4 9 13 - - -5 107
EBITDA margin 69 % 92 % 87 % 79 % 88 % N/A N/A -92 % 81 %
Net interest expenses 1) -5 -24 -1 -4 -7 - - - -41
Normalised loan repayments 1) -6 -11 -2 -5 -4 - - - -28
Normalised income tax payments 1) 1 -11 - - - - - 1 -9
Cash flow to equity -2 32 1 - 2 - - -4 30
SSO economic interest 100% 39% 54% 40% 60% - - - -
Net production (GWh) 2.4 46.6 1.8 9.3 10.9 - - - 70.9
1) See Alternative Performance Measures appendix for definition.Scatec Solar ASA 17
Financial position and working capital breakdown
Proportionate financials
31 DEC 2018
POWER PLANT COMPANIES POWER PLANT COMPANIES
IN OPERATION UNDER CONSTRUCTION
TOTAL
CZECH SOUTH HONDU- MALAY- SOUTH MOZAM- MALAY- ARGEN- PROPOR-
NOK MILLION REPUB. AFRICA RWANDA RAS JORDAN SIA 1) BRAZIL AFRICA BIQUE EGYPT SIA UKRAINE TINA TIONATE
Project equity 2) 145 173 22 618 206 494 324 11 82 358 78 30 164 2,705
Total assets 574 1,341 91 924 764 2,709 779 553 237 1,524 150 66 174 9,884
PP&E 2) 478 1,115 84 830 571 2,207 690 194 180 879 4 16 142 7,390
Cash 40 129 4 46 166 452 47 75 14 368 78 12 19 1,451
Gross interest bearing debt 2) 377 1,018 65 205 462 2,076 394 357 142 934 - - - 6,030
Net interest bearing debt 1) 337 889 62 159 296 1,624 347 282 128 566 -78 -12 -19 4,579
Net working capital 2) -31 -13 -6 -57 -118 -84 -38 101 34 72 -4 5 -60 -200
SSO economic interest 100% 45% 54% 51% 60% 100% 44% 46% 53% 51% 100 % 70 % 50% N/A
1) The Gurun power plant in Malaysia reached CoD in December 2018. This column also contains the remaining two power plant companies Jasin & Merchang
which are currently still in construction.
2) See Alternative Performance Measures appendix for definition.
Bridge from proportionate to consolidated financials
31 DEC 2018
RESIDUAL EQUITY- D&C, O&M,
TOTAL OWNERSHIP CONSOLIDATED CORPORATE,
NOK MILLION PROPORTIONATE INTERESTS ENTITIES ELIMINATIONS CONSOLIDATED
Project equity 1) 2,705 1,837 1,068 -999 2,475
Total assets 9,884 6,629 2,129 473 14,857
PP&E 7,390 4,806 1,862 -1,378 8,956
Cash 1,451 892 147 1,107 3,303
Gross interest bearing debt 1) 6,030 3,878 901 743 9,750
Net interest bearing debt 1) 4,579 2,986 754 -364 6,447
Net working capital 1) -200 -34 -208 -773 -799
1) See Alternative Performance Measures appendix for definition.18 Fourth quarter 2018
Condensed interim financial information
Interim consolidated statement of profit or loss
NOK MILLION NOTES Q4 2018 Q4 2017 FY 2018 FY 2017
Revenues 2 311.4 285.8 1,150.6 1,121.1
Net gain/(loss) from sale of project assets 2,3 - 2.6 - 377.8
Net income/(loss) from JVs and associated companies 2 32.5 -7.0 62.6 -7.4
Total revenues and other income 343.9 281.5 1,213.2 1,491.5
Personnel expenses 2 -37.9 -28.7 -136.7 -107.0
Other operating expenses 2 -48.7 -45.4 -174.0 -143.2
Depreciation, amortisation and impairment 2,3 -70.6 -59.8 -273.3 -248.1
Operating profit 186.7 147.6 629.2 993.2
Interest and other financial income 4,5 12.7 10.4 197.3 51.2
Interest and other financial expenses 4,5 -164.0 -146.7 -518.3 -523.8
Net foreign exchange gain/(losses) 4,5 59.2 0.7 15.1 -59.8
Net financial expenses -92.1 -135.6 -305.9 -532.3
Profit/(loss) before income tax 94.7 12.0 323.3 460.9
Income tax (expense)/benefit 7 -18.8 -13.4 -97.4 -23.0
Profit/(loss) for the period 75.9 -1.4 225.8 437.9
Profit/(loss) attributable to:
Equity holders of the parent 45.4 -34.9 139.8 339.1
Non-controlling interests 30.5 33.5 86.0 98.8
Basic earnings per share (NOK) 11 0.40 -0.34 1.29 3.36
Diluted earnings per share (NOK) 11 0.40 -0.34 1.28 3.35Scatec Solar ASA 19 Interim consolidated statement of comprehensive income NOK MILLION NOTES Q4 2018 Q4 2017 FY 2018 FY 2017 Profit/(loss) for the period 75.9 -1.4 225.8 437.9 Other comprehensive income: Items that may subsequently be reclassified to profit or loss Net movement of cash flow hedges 5 -107.6 0.9 -73.8 -61.8 Income tax effect 7 29.0 -0.7 19.6 16.9 Foreign currency translation differences 101.8 37.7 -4.2 30.8 Net other comprehensive income to be reclassified to profit or loss in subsequent periods 23.3 37.9 -58.4 -14.2 Total comprehensive income for the period net of tax 99.1 36.5 167.4 423.7 Attributable to: Equity holders of the parent 99.3 -50.4 136.4 336.1 Non-controlling interests -0.2 86.9 31.1 87.7
20   Fourth quarter 2018

     Interim consolidated statement of financial position

     NOK MILLION                                         NOTES   AS OF 31 DECEMBER 2018   AS OF 31 DECEMBER 2017

     ASSETS
     Non-current assets
     Deferred tax assets                                     7                   526.2                    401.9
     Property, plant and equipment – in solar projects       3                 8,955.7                  5,580.4
     Property, plant and equipment – other                   3                    52.7                     37.9
     Goodwill                                                                     24.4                     24.1
     Financial assets                                      4,5                        -                      0.2
     Investments in JVs and associated companies                                 744.5                    415.1
     Other non-current assets                                9                   111.9                    120.1
     Total non-current assets                                                 10,415.2                  6,579.8

     Current assets
     Trade and other receivables                                                 279.3                    238.8
     Other current assets                                    9                   711.5                    558.5
     Financial assets                                      4,5                   148.8                       0.2
     Cash and cash equivalents                               6                 3,302.6                  2,863.1
     Total current assets                                                      4 442.2                  3,660.6
     TOTAL ASSETS                                                             14,857.5                 10,240.4
Scatec Solar ASA 21 Interim consolidated statement of financial position NOK MILLION NOTES AS OF 31 DECEMBER 2018 AS OF 31 DECEMBER 2017 EQUITY AND LIABILITIES Equity Share capital 2.8 2.6 Share premium 1,794.5 1,194.7 Total paid in capital 1,797.4 1,197.2 Retained earnings 89.4 31.0 Other reserves 79.0 81.7 Total other equity 168.4 112.7 Non-controlling interests 508.8 577.3 Total equity 8 2,474.5 1,887.2 Non-current liabilities Deferred tax liabilities 7 344.8 184.9 Non-recourse project financing 4 8,643.1 6,163.9 Bonds 6 742.9 740.8 Financial liabilities 4,5 114.8 28.7 Other non-current liabilities 9 737.8 299.4 Total non-current liabilities 10,583.4 7,417.7 Current liabilities Trade and other payables 10 161.7 216.3 Income tax payable 7 34.4 19.4 Non-recourse project financing 4 363.7 316.6 Financial liabilities 4,5,6 9.3 26.6 Other current liabilities 9 1,230.3 356.5 Total current liabilities 1,799.6 935.4 Total liabilities 12,382.9 8,353.1 TOTAL EQUITY AND LIABILITIES 14,857.5 10,240.4 Oslo, 24 January 2019 The Board of Directors of Scatec Solar ASA
22   Fourth quarter 2018

     Interim consolidated statement of changes in equity

                                                                                                     OTHER RESERVES

                                                                                                    FOREIGN                                       NON-
                                                           SHARE       SHARE       RETAINED        CURRENCY       HEDGING                   CONTROLLING          TOTAL
     NOK MILLION                                          CAPITAL    PREMIUM       EARNINGS      TRANSLATION      RESERVES         TOTAL      INTERESTS         EQUITY

     At 1 January 2017                                         2.3       819.1        -222.0            83.7            1.6        684.7            628.0       1,312.7
     Profit for the period                                       -            -        339.1                -              -       339.1             98.8        437.9
     Other comprehensive income                                  -            -           0.6           20.8          -24.4          -3.0           -11.1         -14.2
     Total comprehensive income                                  -            -        339.7            20.8          -24.4        336.1             87.7        423.7
     Share-based payment                                         -          2.9              -              -              -          2.9                -          2.9
     Share capital increase 1)                                 0.2       379.7               -              -              -       379.9                 -       379.9
     Transaction cost, net after tax                             -         -6.9              -              -              -         -6.9                -         -6.9
     Dividend distribution                                       -            -         -73.3               -              -       -73.3           -185.3       -258.6
     Capital increase from NCI 2)                                -            -              -              -              -            -            33.5         33.5
     Step-by-step acquisition                                    -            -         -13.4               -              -       -13.4             13.4             -
     At 31 December 2017                                       2.6     1,194.7           31.0          104.5          -22.8      1,309.9            577.3       1,887.2

     At 1 January 2018                                         2.6     1,194.7           31.0          104.5          -22.8      1,309.9            577.3       1,887.2
     Profit for the period                                       -            -                             -              -       139.8             86.0        225.8
     Other comprehensive income                                  -            -          -0.8           18.4          -21.0          -3.5           -55.0         -58.4
     Total comprehensive income                                  -            -        139.1            18.4          -21.0        136.4             31.1        167.4
     Share-based payment                                         -          4.6              -              -              -          4.6                -          4.6
     Share capital increase 3)                                 0.3       605.7               -              -              -       606.0                 -       606.0
     Transaction cost, net after tax                             -       -10.4               -              -              -       -10.4                 -        -10.4
     Dividend distribution                                       -            -         -80.7               -              -       -80.7           -215.8       -296.4
     Capital increase from NCI 2)                                -            -              -              -              -            -           116.2        116.2
     At 31 December 2018                                       2.8     1,794.5           89.4          122.9          -43.9      1,965.8            508.8       2,474.5

     1) During first quarter 2017 the Group increased the share capital with NOK 379.7 million.
     2) Non-controlling interests.
     3) During first half year 2018 the Group increased the share capital with NOK 6.2 million in first quarter and with NOK 600.0 million in second quarter.
Scatec Solar ASA 23 Interim consolidated statement of cash flow NOK MILLION NOTES Q4 2018 Q4 2017 FY 2018 FY 2017 Cash flow from operating activities Profit before taxes 94.7 12.0 323.3 460.9 Taxes paid 7 -25.4 -3.5 -65.3 -17.4 Carry-back tax payment received 7 - 8.5 - 8.5 Depreciation and impairment 3 70.6 59.8 273.3 248.1 Net gain/loss sale of fixed assets 3 4.6 - 4.6 - Net income associated companies/sale of project assets -32.5 3.3 -62.6 -370.6 Interest and other financial income 4 -12.7 -10.4 -197.3 -51.2 Interest and other financial expenses 4 164.0 146.7 518.3 523.8 Unrealised foreign exchange (gain)/loss 4 -59.2 -116.9 -15.1 -55.7 (Increase)/decrease in trade and other receivables -54.0 -45.1 -40.5 -7.3 (Increase)/decrease in other current/non-current assets -325.0 -306.4 -365.5 -420.9 Increase/(decrease) in trade and other payables 10 -98.9 185.3 -54.6 187.0 Increase/(decrease) in other current liabilities 9 485.9 40.6 851.1 153.9 Increase/(decrease) in financial assets and other changes 5,9 -28.3 202.1 78.6 185.2 Net cash flow from operating activities 183.7 175.9 1,248.2 844.1 Cash flow from investing activities Interest received 4 16.0 10.4 77.1 51.2 Investments in property, plant and equipment 3 -1,118.0 -341.3 -3,565.3 -673.1 Net investment in associated companies -166.1 -205.1 -244.0 -252.3 Net cash flow from investing activities -1,268.1 -536.0 -3,732.1 -874.1 Cash flow from financing activities Proceeds from NCI shareholder financing 1) 163.0 10.1 551.8 31.4 Interest paid 4 -232.2 -191.1 -587.6 -475.9 Proceeds from non-recourse project financing 4 2,396.9 1,973.8 2,854.6 1,973.8 Repayment of non-recourse project financing 4 -97.6 -85.0 -266.0 -230.6 Share capital increase - - 595.6 373.0 Proceeds from corporate bond issue 6 - 750.0 - 750.0 Repayment of corporate bond 6 - -523.3 - -523.3 Dividends paid to equity holders of the parent company 8 - - -80.7 -73.3 Dividends and other distributions paid to non-controlling interest - -2.7 -210.8 -185.3 Net cash flow from financing activities 2,230.0 1,931.8 2,856.8 1,639.8 Net increase/(decrease) in cash and cash equivalents 1,145.5 1,571.7 372.9 1,609.8 Effect of exchange rate changes on cash and cash equivalents 116.4 172.5 66.7 116.1 Cash and cash equivalents at beginning of the period 6 2,040.7 1,118.9 2,863.1 1,137.2 Cash and cash equivalents at end of the period 6 3,302.6 2,863.1 3,302.6 2,863.1 Cash in power plant companies in operation 6 730.4 793.3 730.4 793.3 Cash in power plant companies under construction 6 1,466.5 1,323.9 1,466.5 1,323.9 Other restricted cash 6 66.6 57.8 66.6 57.8 Free cash 6 1,039.1 688.1 1,039.1 688.1 Total cash and cash equivalents 6 3,302.6 2,863.1 3,302.6 2,863.1 Hereof presented as: Cash and cash equivalents 3,302.6 2,863.1 3,302.6 2,863.1 1) Proceeds from non-controlling interest shareholder financing include both equity contributions and shareholder loans.
24   Fourth quarter 2018

     Notes to the condensed interim
     consolidated financial statements

     Note 1       Organisation and basis for preparation

     Corporate information                                              interpretations mentioned in note 32 of the Group’s annual
     Scatec Solar ASA is incorporated and domiciled in Norway.          report 2017 with effective date from financial year 2018
     The address of its registered office is Karenslyst Allé 49,        (IFRS 9 Financial Instruments and IFRS 15 Revenue from
     NO-0279 Oslo, Norway. Scatec Solar was established on              Contracts with Customers), do not have a significant impact
     2 February 2007.                                                   on the Group’s condensed interim consolidated financial
                                                                        statements.
     Scatec Solar ASA (“the Company”), its subsidiaries and invest-
     ments in associated companies (“the Group” or “Scatec Solar”)      From first quarter 2018 the segment financials are reported
     is a leading independent solar power producer. The Company         on a proportionate basis in line with how the management
     is pursuing an integrated business model across the complete       team assesses the segment performance. With proportion-
     life cycle of utility-scale solar photovoltaic (PV) power plants   ate financials Scatec Solar reports its share of revenues,
     including project development, financing, construction,            expenses, profits and cash flows from its subsidiaries without
     ownership and operation and maintenance.                           eliminations, based on Scatec Solar’s economic interest in
                                                                        the subsidiaries. The Group uses proportionate financials to
     The condensed interim consolidated financial statements            improve transparency on underlying value creation across
     were authorised by the Board of Directors for issue on             Scatec Solar’s business activities.
     24 January 2019.
                                                                        The functional currency of the companies in the Group is
     Basis of preparation                                               determined based on the nature of the primary economic
     These condensed interim consolidated financial statements          environment in which each company operates. The functional
     are prepared in accordance with recognition, measurement           currency of the parent company Scatec Solar ASA and the
     and presentation principles consistent with International          presentation currency of the Group is Norwegian kroner
     Financing Reporting Standards as adopted by the European           (NOK). All amounts are presented in NOK million unless
     Union (“IFRS”) for interim reporting under International           otherwise stated.
     Accounting Standard (“IAS”) 34 Interim Financial Reporting.
     These condensed interim consolidated financial statements          As a result of rounding adjustments, the figures in some
     are unaudited.                                                     columns may not add up to the total of that column.

     These condensed interim consolidated financial statements          Significant estimates and judgements
     are condensed and do not include all of the information and        The preparation of condensed interim consolidated financial
     notes required by IFRS for a complete set of consolidated          statements in conformity with IFRS requires management to
     financial statements. These condensed interim consolidated         make judgements, estimates and assumptions that affect the
     financial statements should be read in conjunction with the        application of policies and reported amounts of assets and
     annual consolidated financial statements.                          liabilities, income and expenses.

     The accounting policies adopted in the preparation of the          Judgements
     condensed interim consolidated financial statements are            In the process of applying the Group’s accounting policies,
     consistent with those followed in the preparation of the           management make judgements of which the following have
     Group’s annual consolidated financial statements for the year      the most significant effect on the amounts recognised in the
     ended 31 December 2017, with exception for the reporting           condensed interim financial statements:
     on operating segments as described below. Standards and
Scatec Solar ASA 25
Consolidation of power plant companies economic interest in the companies is 45.5%. During fourth
Scatec Solar’s value chain comprises all downstream activities quarter 2018 two power plant companies (holding the Rengy
such as project development, financing, construction and and Kamianka projects in Ukraine) were consolidated for the
operations, as well as having an asset management role first time. Scatec Solar’s economic interest in the companies
through ownership of the solar power plants. Normally is 51% and 100% respectively. The Group has concluded
Scatec Solar enters into partnerships for the shareholding that it through its investment has the power to control these
of the power plant companies owning the power plants. entities. Furthermore, Scatec Solar is exposed to variable
To be able to utilise the business model fully, Scatec Solar seeks returns and has the ability to affect those returns through its
to obtain operational control of the power plant companies. power over the companies.
Operational control is obtained through governing bodies,
shareholder agreements and other contractual arrangements. As the construction of the Guanizuil IIA project in Argentina
Other contractual arrangements may include Scatec Solar’s commenced in fourth quarter 2018, the construction and
role as the developer of the project, EPC provider (construction), power plant companies were reported for the first time.
operation and maintenance service provider and asset The joint venture companies held by Scatec Solar and Equinor
management service provider. are equity consolidated as the parties have joint control.
Scatec Solar would normally seek to undertake the following Refer to note 2 of the 2017 annual report for further
distinct roles in its projects: information on judgements, including control assessments
made in previous years.
• As the largest shareholder providing equity financing to
the project Estimates and assumptions
• As (joint) developer, including obtaining project rights, The estimates and underlying assumptions are reviewed
land permits, off-take agreements and other local approvals on an ongoing basis, considering the current and expected
• As EPC supplier, responsible for the construction of future market conditions. Changes in accounting estimates
the project are recognised in the period in which the estimate is revised
• As provider of operation and maintenance services to if the revision affects only that period or in the period of the
the projects, responsible for the day-to-day operations revision and future periods if the revision affects both current
of the plant and future periods.
• As provider of management services to the power
plant companies Seasonality in operations
Interim period results are not necessarily indicative of
Even though none of the projects Scatec Solar are involved results of operations or cash flows for an annual period.
with are identically structured, the five roles/activities The Group’s operating results are impacted by external
described above constitute the main and relevant activities factors, such as weather conditions. The power production
which affect the variable return. When assessing whether at the PV solar parks is directly impacted by seasonal changes
Scatec Solar controls a power plant company as defined by in solar irradiance which is normally at its highest during the
IFRS 10 Consolidated Financial Statements, all of the above summer months. This effect is to a certain degree offset in
roles and activities are analysed. During second quarter the consolidated revenues due to the fact that the Group
2018 three power plant companies (holding the Upington operates PV solar parks on both the northern and southern
projects) were consolidated for the first time. Scatec Solar’s hemisphere.You can also read