Roadmap Electrical and Electronics Technical Team Roadmap - October 2017 - Department of Energy
←
→
Page content transcription
If your browser does not render page correctly, please read the page content below
Electrical and Electronics
Technical Team Roadmap
  October 2017
Roadmap

                 i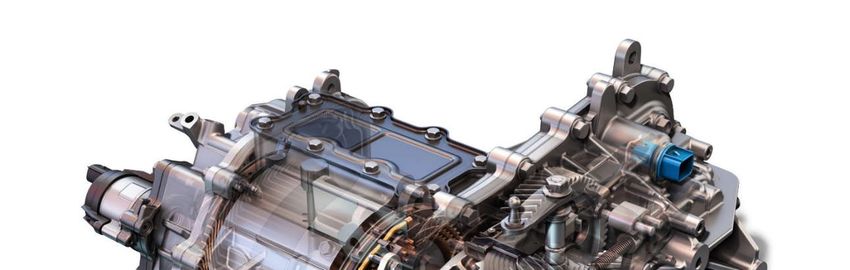
Electrical and Electronics Tech Team Roadmap

This roadmap is a document of the U.S. DRIVE Partnership. U.S. DRIVE (Driving Research and Innovation
for Vehicle efficiency and Energy sustainability) is a voluntary, non-binding, and non-legal partnership
among the U.S. Department of Energy; USCAR, representing FCA US LLC, Ford Motor Company, and
General Motors; five energy companies—BP America, Chevron Corporation, Phillips 66 Company,
ExxonMobil Corporation, and Shell Oil Products US; two utilities—Southern California Edison and DTE
Energy; and the Electric Power Research Institute (EPRI).

Electrical and Electronics Tech Team is one of 13 U.S. DRIVE technical teams that work to accelerate the
development of pre-competitive and innovative technologies to enable a full range of efficient and clean
advanced light-duty vehicles, as well as related energy infrastructure.

For more information about U.S. DRIVE, please see the U.S. DRIVE Partnership Plan, at
www.vehicles.energy.gov/about/partnerships/usdrive.html or www.uscar.org.

                                                     ii
Electrical and Electronics Tech Team Roadmap

Executive Summary
Electric traction drive systems (ETDS) have experienced significant changes over the past 20
years. Battery electric vehicles with a range of 200 to 300 miles are available today with
equivalent or better performance than comparable internal combustion engine (ICE) vehicles.
Electric vehicle charging (refueling) at home has become a feature highly valued by consumers,
and fast-charging capability brings the promise of refueling times comparable to ICE vehicles. In
the last 2 years this drastic improvement in vehicle electrification has coincided with a radical
transformation of society’s understanding of mobility. Historically, personal vehicles have
opened the door to freedom-of-movement and self-expression, but now transportation is
available as a service (oftentimes called mobility-as-a-service, or MaaS). These changes—
improved electrification and transformed mobility—drive the four fundamental trends
impacting the Electrical and Electronics Technical Team (EETT):

   1. Adoption of electrified skateboard chassis that includes both the electric traction drive
      system and energy storage. This provides greater vehicle design freedom, more usable
      passenger space, and a modular platform to increase production scale.
   2. MaaS trades the traditional ownership model driven by personal taste for a fleet
      ownership model driven by lifecycle cost. This drives on-board power and
      electromagnetic interference requirements, autonomous and extreme fast charging,
      and the need to maximize usable space on the vehicle.
   3. Production scale needed for mass market viability has moved from 100,000 to 500,000
      units per platform. This has been driven by intense competition in the auto industry.
   4. Vehicle performance requirements are driving demand for higher-power ETDS.
      Consumers want significantly faster acceleration and larger, more versatile vehicles.

These trends require that ETDS design evolves rapidly to achieve and maintain commercial
success. The systems must fit in a skateboard chassis requiring nearly an order of magnitude
(8x) increase in power density, have twice the reliability (300,000 miles), and be modular and
scalable for use on vehicle platform variants, all while producing higher power. Achieving this
will require heterogeneous or multi-physics integration of materials, nano-carbon infused
metals, a new class of isolation materials, high-temperature materials, and new thermal
management techniques. Additionally, there is a need to understand and quantify the physics
of materials and their interactions under extreme power and temperature. This document
describes the research and development necessary to achieve the future vision of energy-
efficient transportation which is vital for both increased personal mobility and continued U.S.
economic growth.

                                                iii
Electrical and Electronics Tech Team Roadmap

This roadmap was developed collaboratively through an iterative process to ensure it
represents a united vision of industry and government stakeholders. The EETT OEM partners
were actively involved in the 2025 target development process. Technology gaps and strategy
to achieve the targets are based on OEM and supplier input. Industry engagement took the
form of a face-to-face multi-day meeting and individual company follow up throughout the
course of roadmap development. As a result, the roadmap includes two specific technical
guidance documents, one for power electronics and one for electric motors (included in the
appendix), which were driven by the OEMs and confirmed by the suppliers. The gap between
current technology and the 2025 technical targets defines the need for new technologies,
material advancements and new manufacturing processes. OEM, supplier, and national
laboratory engagement were instrumental in developing the strategy for this roadmap.

The chosen strategy to overcome current barriers and achieve the technical targets is to
conduct R&D with industry input aimed at achieving a significant technology push. DOE national
laboratories are working with the supply base to improve wide bandgap-based power
electronics and non-rare earth or magnet-less electric motors to meet the 2025 ETDS R&D
targets. Component targets and material requirements were identified and reviewed with
suppliers. Supplier-based solutions were encouraged as the national laboratories focus on
early-stage research to close the technical gaps in knowledge and on conducting system and
component tradeoffs (see Figure ES-1). This will result in basic technology building blocks to be
used as inputs for automotive OEM advanced development groups. The OEMs will provide
guidance by reviewing requirement development and conducting design reviews. Program
status is evaluated in relation to the technical targets on an annual basis.

                            Figure ES-1. Automotive Product Development Cycle

                                                    iv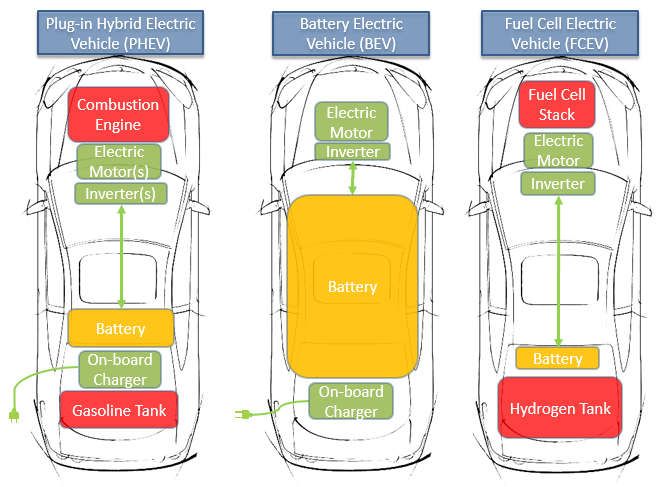
Electrical and Electronics Tech Team Roadmap

Table of Contents
Executive Summary........................................................................................................................... iii

Acronyms ....................................................................................................................................... viii

Team Mission and Scope ....................................................................................................................1
   Mission ...................................................................................................................................................... 1
   Scope ......................................................................................................................................................... 1
Key Challenges to Technology Commercialization and/or Market Penetration .....................................4
   Market Status ............................................................................................................................................ 4
   Key Challenges: Cost and Size ................................................................................................................... 5
   Future Trends ............................................................................................................................................ 6
Technical Targets & Status .................................................................................................................8
   Target Definition ....................................................................................................................................... 8
   Electric Traction Drive System Targets ..................................................................................................... 9
   High-Voltage Power Electronics Technical Targets ................................................................................... 9
   Electric Traction Motor Technical Targets .............................................................................................. 10
   DC/DC Converter Technical Targets ........................................................................................................ 10
   On-Board Charger Technical Targets ...................................................................................................... 11
   Current Technical Target Status .............................................................................................................. 12
Gaps and Barriers to Reach 2025 Technical Targets ........................................................................... 14
   Power Electronics.................................................................................................................................... 15
   Electric Motors ........................................................................................................................................ 15
Strategy to Overcome Barriers and Achieve Technical Targets ........................................................... 17
   Power Electronics Strategy ..................................................................................................................... 17
   Power Electronics R&D Areas ................................................................................................................. 18
       Multi Physics Integration .................................................................................................................. 19
       Thermal Strategy ............................................................................................................................... 19
       Power Module ................................................................................................................................... 20
       Passives ............................................................................................................................................. 20
       In-Board Devices ............................................................................................................................... 21
       Chip Set Integration .......................................................................................................................... 21
   Electric Motors Strategy.......................................................................................................................... 22
   Electric Motor R&D Areas ....................................................................................................................... 24
       Material Physics Based Models ......................................................................................................... 24
       Base Materials ................................................................................................................................... 25
       Non-Rare-Earth Magnets .................................................................................................................. 25
       Conductive Material .......................................................................................................................... 25
       High Voltage Insulators ..................................................................................................................... 25
       Thermally Conductive Epoxy, Fillers, and Winding Insulation .......................................................... 26

                                                                                  v
Electrical and Electronics Tech Team Roadmap

Appendix A – Wide Bandgap Advanced Integrated Power Module 2025 Technical Guidelines .......... A-1

Appendix B – Non-Heavy Rare Earth Advanced Electric Motor Design 2025 Technical Guideline....... B-1

Appendix C – ORNL Testing and Evaluation Data on 2016 BMW i3 ................................................... C-1

                                                          vi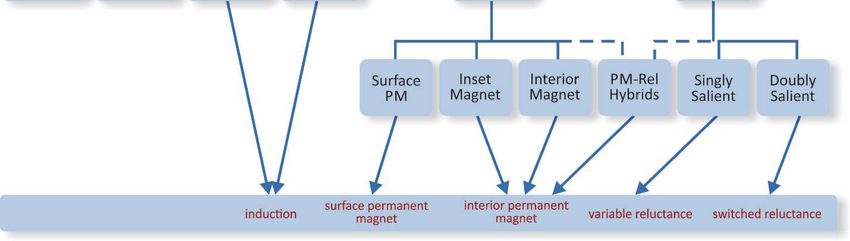
Electrical and Electronics Tech Team Roadmap
Table of Figures
Figure ES-1. Automotive Product Development Cycle ................................................................................ iv
Figure 1. Components of Generic ETDS ........................................................................................................ 2
Figure 2. EDV Architecture Layouts .............................................................................................................. 3
Figure 3. Light Duty Electric Drive Vehicles Monthly Sales Updates ............................................................ 4
Figure 4. Average Combined ETDS Peak Power for HEVs and PEVs 2010-2016 (bubble size represents
relative annual sales and “2009” includes data from prior years. 2017 data through
September.................................................................................................................................... 5
Figure 5. Projected EDV Sales ....................................................................................................................... 6
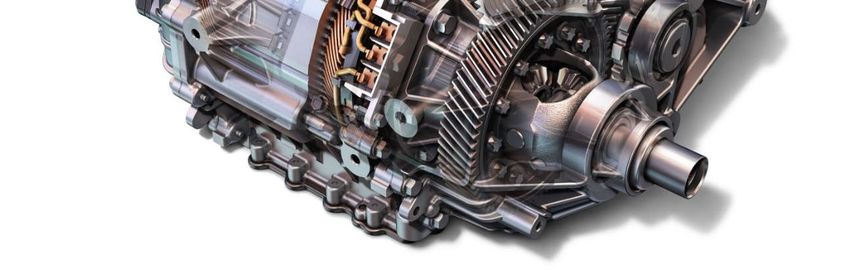
Figure 6. 2017 Chevrolet Bolt BEV Chassis with Powertrain (left); Example of a Flat Skateboard Chassis
Containing Electric Powertrain (right). ........................................................................................ 7
Figure 7. High Voltage Power Electronics Cost Status (2015 EETT target) ................................................. 13
Figure 8. Electric Motor Cost Status (2015 EETT target)............................................................................. 14
Figure 9. Rare Earth Metal Prices Track Oxides Very Closely ..................................................................... 16
Figure 10. Inverter Cost Breakdown for a Potential Pathway to Meeting 2025 Target ............................. 18
Figure 11. Power Electronics R&D Areas .................................................................................................... 19
Figure 12. Electric Motor Types .................................................................................................................. 22
Figure 13. Electric Motor Cost Breakdown for a Potential Pathway to Meeting 2025 Target ................... 23
Figure 14. Electric Motor R&D Areas .......................................................................................................... 24
Figure C-1. 2016 BMW i3 Inverter Assembly Including 12V DC/DC Converter and AC/DC Charger .........C-1
Figure C-2. 2016 BMW i3 Electric Motor (External View [top right and left], Rotor [bottom left], and
Stator with Cooling Channels [bottom right]. ...........................................................................C-3
Figure C-3. 2016 BMW i3 Electric Motor (top), Inverter (middle) and Combined System (bottom)
Operating Efficiency Maps. .......................................................................................................C-4
List of Tables
Table 1. Key EDV Architecture Characteristics.............................................................................................. 3
Table 2. Technical Targets for Electric Traction Drive System ...................................................................... 9
Table 3. Technical Targets for High Voltage Power Electronics.................................................................... 9
Table 4. Technical Targets for Electric Traction Motor ............................................................................... 10
Table 5. Technical Targets for DC/DC Converter ........................................................................................ 11
Table 6. Technical Targets for On-Board Charger ....................................................................................... 11
Table 7. Comparison of Current Status with 2025 Technical Targets for ETDS .......................................... 12
Table 8. Current Status and 2025 Technical Targets for Power Electronics and Electric Motors .............. 12
Table 9. Potential Cost Pathway to Meeting 2025 Power Electronics R&D Cost Target ............................ 18
Table 10. Potential Cost Pathway to Meeting 2025 Electric Motor R&D Cost Target ................................ 23
Table C-1. 2016 BMW i3 Inverter Component Weights ............................................................................C-1
Table C-2. 2016 BMW i3 Inverter Component Volume .............................................................................C-2
Table C-3. 2016 BMW i3 Electric Motor Specifications .............................................................................C-2
vii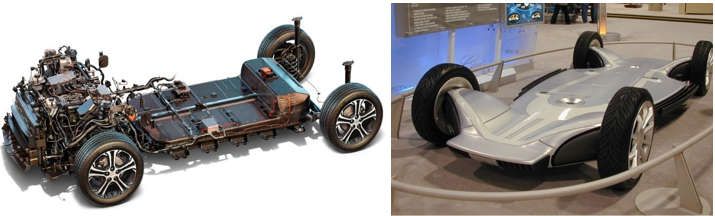
Electrical and Electronics Tech Team Roadmap

Acronyms
AC           alternating current
AIPM         advanced integrated power module
AEMD         advanced electric motor design
BEV          battery electric vehicle
CAV          connected and autonomous vehicle
CUV          crossover utility vehicle
DC           direct current
DCFC         direct current fast charger
DOE          U.S. Department of Energy
EDV          electric drive vehicle
EETT         Electrical and Electronics Technical Team
EMC          electro-magnetic compatibility
EMI          electro-magnetic interference
EREV         extended-range electric vehicle
EESTT        Electrochemical Energy Storage Tech Team
ETDS         electric traction drive system
EVSE         electric vehicle supply equipment
FCEV         fuel cell electric vehicle
GITT         Grid Interaction Tech Team
HEV          hybrid electric vehicle
ICE          internal combustion engine
LDV          light duty vehicle
MaaS         mobility-as-a-service
NdFeB        neodymium iron boron
NVH          noise, vibration and harshness
OBC          on-board charger
OEM          original equipment manufacturer
PEV          plug-in electric vehicle
PHEV         plug-in hybrid electric vehicle
PIM          power inverter module
PM           permanent magnet
R&D          research and development
SUV          sport utility vehicle
USCAR        United States Council for Automotive Research LLC
U.S. DRIVE   United States Driving Research and Innovation for Vehicle efficiency and Energy
             sustainability
VSATT        Vehicle Systems Analysis Tech Team
WBG          wide bandgap
WPT          wireless power transfer
XFC          extreme fast charging

                                             viii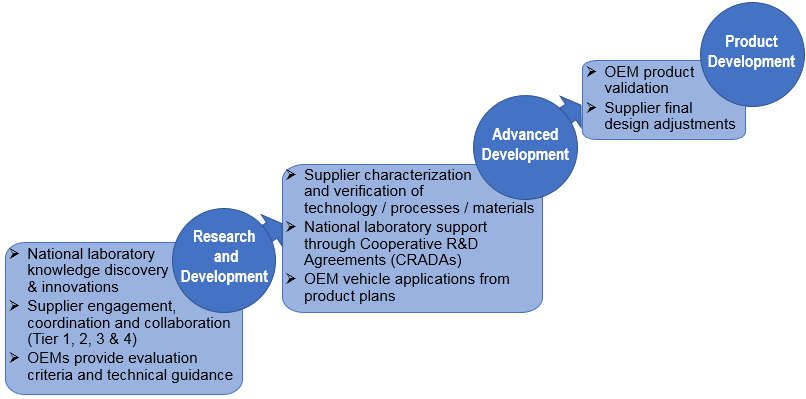
Electrical and Electronics Tech Team Roadmap
Team Mission and Scope
Mission
To support the mass market adoption of electric drive vehicles, the mission of the Electrical and
Electronics Technical Team (EETT) is to accelerate the development of cost-effective and
compact electric traction drive systems (ETDSs) that meet or exceed performance and reliability
requirements of internal combustion engine (ICE)-based vehicles, thereby enabling
electrification across all light-duty vehicle types.
The EETT mission supports U.S. DRIVE’s Vision that “American consumers have a broad range of
affordable personal transportation choices that reduce petroleum consumption and
significantly reduce harmful emissions from the transportation sector.” It also directly supports
U.S. DRIVE’s Mission to “accelerate development of pre-competitive and innovative
technologies to enable a full range of efficient and clean advanced light-duty vehicles, as well as
related energy infrastructure.” This mission is specifically embodied in the following goal:
U.S. DRIVE Partnership Goal (1): Enable reliable hybrid electric, plug-in hybrid and range-
extended electric, and battery electric vehicles with performance, safety, and costs
comparable to or better than advanced conventional vehicle technologies, supported by
charging technologies that can enable the widespread availability of electric charging
infrastructure.
As part of this U.S. DRIVE Partnership goal, EETT has a specific 2025 Partnership Research
Target:
An electric traction drive system at a cost of $6/kW for a 100 kW peak system.
In addition to the U.S. Drive Partnership level target, EETT has a 2025 power density research
target of 33 kW/L for a 100 kW peak system. While achieving this target will require
transformational technology changes to current materials and processes, it is essential for
enabling widespread electrification across all light-duty vehicle platforms.
Scope
The EETT focuses on pre-competitive, early-stage research and development of ETDSs
(consisting of electric motor[s] and inverter[s]), that drive the following electric drive vehicle
(EDV) configurations:
hybrid electric vehicles (HEVs)
plug-in hybrid electric vehicles (PHEVs)
extended range electric vehicles (EREVs)
battery/fuel cell electric vehicles (BEVs and FCEVs)
1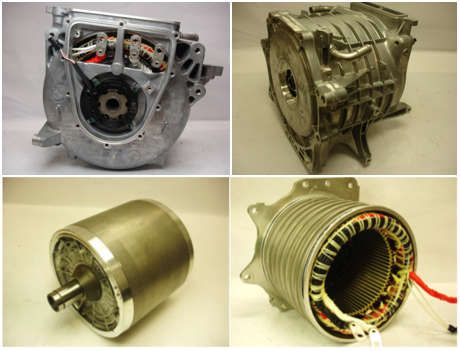
Electrical and Electronics Tech Team Roadmap
Depending on the vehicle type and system architecture, other power electronics besides the
inverter might also be included and are covered by the EETT, such as:
power transfer components (on-board charger and wireless charging components)
bi-directional DC/DC converter
voltage step-down (buck) DC/DC converter
The blue and green boxes shown in Figure 1 illustrate the components within the EETT’s scope.
Figure 1. Components of Generic ETDS
The ETDS is delineated by the bi-directional converter’s DC Bus to the battery and the electric
motor output shaft (all components highlighted in blue in Figure 1). The main power transfer
component is the on-board battery charger (OBC) which is also covered by EETT targets. In case
of wireless power transfer (WPT) or extreme fast charging (XFC) vehicle capability the EETT is
responsible for all related power electronics components on the vehicle as well as interfaces to
the off-board components necessary for their operation. For research related to WPT and XFC,
EETT coordinates efforts with the Grid Interaction Tech Team (GITT) and Vehicle Systems
Analysis Tech Team (VSATT).
The OBC is bounded by the external AC electrical interface to the Electric Vehicle Supply
Equipment (EVSE) and the DC Bus to the battery. The OBC interfaces are governed by the GITT,
VSATT and Electrochemical Energy Storage Tech Team (EESTT). The EETT coordinates OBC
efforts and research goals with those teams to develop reasonable and balanced research goals
and ensure that one system is not optimized at the expense of an interfacing system (e.g., EVSE,
high voltage battery, or gearbox/transmission). Research goals also consider the vehicle
constraints related to electromagnetic compatibility (EMC) and noise, vibration and harshness
(NVH).
2Electrical and Electronics Tech Team Roadmap
The EETT Roadmap focuses on pre-competitive research and development (R&D) to enable
increased vehicle electrification. Ideally, each new and innovative technology will be modular
and scalable to broaden its applications. Most common relevant vehicle architectures are
illustrated in Table 1 below; other uses and applications exist such as electric all-wheel drive for
PHEVs (single motor) and performance EVs with 2 to 4 traction motors. Historically EETT R&D
focused on HEVs, but the focus has shifted to full electric drive vehicles, which include: PHEVs,
EREVs, BEVs and FCEVs. Full EDV system layouts are shown in Figure 2.
Figure 2. EDV Architecture Layouts
Table 1. Key EDV Architecture Characteristics
ETDS Key Parameters PHEV and EREV EV (BEV or FCEV)
EREV Motor A - generator to
charge battery; Full speed range electric
ETDS Usage
Motor B - full range electric traction (fixed gear ratio)
traction.
Number of Electric Motors and Power
2 - traction and generator 1 - traction only
Inverter Modules (PIMs) Required
Peak Mechanical Output Power (kW) 50-125 80-270
3Electrical and Electronics Tech Team Roadmap
Key Challenges to Technology Commercialization and/or
Market Penetration
Market Status
EDV share of annual new vehicle sales (including HEVs) has been hovering around 3 percent
since 2012, as shown by the dashed green line in Figure 3. There was a relatively limited
number of EDV models early on, but that number exceeded 30 at the beginning of 2017 for
plug-in electric vehicles (PEVs); half of which are BEV models. Part of the reason for the low
sales penetration is that EDV models are generally smaller passenger vehicles, while more than
50 percent of the light-duty vehicle (LDV) sales in the U.S. market are light-duty trucks, which
include sport and crossover utility vehicles (SUVs and CUVs respectively). Another detrimental
factor is the lack of PEV availability nationwide; many models are only offered in specific states.
Figure 3. Light Duty Electric Drive Vehicles Monthly Sales Updates
Source: Argonne National Laboratory, Energy Systems
Historically, the EETT focus was on HEV applications and the targets were based on a 55 kW
peak power level. As the number of EDV models offered by the original equipment
manufacturers (OEMs) is increasing and starting to include larger and heavier vehicles (i.e.,
SUVs and CUVs), the ETDS power level requirement is also increasing as shown in Figure 4 (the
error bars show the range of peak power levels). Consumer vehicle performance expectations
are also a contributing factor to the higher power levels. In response, the 2025 EETT peak
power level target was increased to 100 kW. As the vehicle size increases, PHEV models seem
to dominate due to lower incremental costs without compromising the driving range in
comparison to BEVs. Electrifying SUVs and CUVs into PHEVs also provides an opportunity to add
all-wheel drive capability without occupying space between the front and rear axle.
4Electrical and Electronics Tech Team Roadmap
Figure 4. Average Combined ETDS Peak Power for HEVs and PEVs 2010-2016 (bubble size represents relative annual sales and
“2009” includes data from prior years. 2017 data through September.
Source: Argonne National Laboratory, Energy Systems
Key Challenges: Cost and Size
The two main challenges to wider availability of EDV models are incremental cost and size of
both ETDS and energy storage. The cost of energy storage has been significantly reduced since
the first EDV model introductions in 2010, but is still a limiting factor for BEVs due to a large
energy capacity required for adequate driving range. PHEVs and EREVs also incur unique
packaging constraints due to the need for both the electrified powertrain (ETDS and energy
storage) and the conventional ICE powertrain. Therefore, to achieve significant EDV market
penetration, for example 10 percent by 2025 and 35 percent by 2040 as suggested in Figure 5,
ETDS cost and size will need to be reduced even further in addition to continued reduction in
energy storage costs. This will in turn allow for easier integration of ETDS and favorable
economics, resulting in a greater number of both passenger and light truck EDVs.
5Electrical and Electronics Tech Team Roadmap
Figure 5. Projected EDV Sales
Source: 2016 Blomberg New Energy Finance
Future Trends
BEVs seem to be the platform of choice for connected and automated vehicle (CAV) developers
due to the design freedom that a modular skateboard chassis architecture allows (see example
in Figure 6). Many manufacturers aim to launch CAVs in mobility-as-a-service (MaaS)
applications (e.g., car-share, ride-share, ride-hailing) between 2020 and 2025 due to their lower
operating costs. This transforms the vehicle value proposition from performance, fuel savings,
and personal satisfaction to reduced operating cost, increased uptime, and per-mile
monetization potential. Such high-use, taxi-like applications require very high operating times,
where vehicles can accumulate between 50,000 and 80,000 miles annually. Some consumers
may switch transportation modes due to perceived comfort or lower cost; for example, some
short air or train miles traveled could be replaced with MaaS on-road autonomous vehicle
miles. To ensure adequate durability for CAVs in MaaS operation, the 2025 ETDS life expectancy
target was increased from 150,000 to 300,000 miles for 2025.
Automakers that are developing long-range BEVs are taking a modular chassis approach where
the ETDS and energy storage are integrated into the skateboard-like flat chassis. Depending on
the amount of energy storage needed, the chassis can be stretched to accommodate vehicles of
various sizes. While traditional ETDS manufacturing volumes were based on conventional
automotive manufacturing standards of 100,000 annual production units, this change in design,
enabling multi-platform use, increases the EETT 2025 annual manufacturing volume assumption
to 500,000 units.
6Electrical and Electronics Tech Team Roadmap
Figure 6. 2017 Chevrolet Bolt BEV Chassis with Powertrain (left); Example of a Flat Skateboard Chassis Containing
Electric Powertrain (right).
Source: General Motors
Charging needs for future 300+ mile BEVs with larger energy storage will also need to be
addressed differently. In early 2017, 20 to 50 kW DC fast charging (DCFC) met the needs of 100
to 200-mile range BEVs. As BEVs transition to fill long distance travel needs, the refueling times
(now at 30-60 minutes for an 80% charge) will need to be far closer to that of conventional ICE
vehicles. DCFC with 100 to 200 kW power levels will be required for longer range EVs and
charging manufacturers have started to develop charging solutions capable of extreme fast
charging beyond 350 kW to meet consumer expectations of an 80% charge within 15 minutes
or less. Several technology gaps have been identified for XFC R&D including higher voltage
batteries beyond current 400 V systems and electrical vehicle architectures that would take
advantage of such higher voltages (wide bandgap [WBG] devices seem ideally suited for such
applications).
Wireless charging will likely gain market acceptance due to consumer convenience and
potentially lower maintenance requirements since there is no need to physically handle the
charging cord and connect the vehicle to the charger. Wireless charging will also be an enabler
for CAVs due to automated charging capability. In-motion wireless charging offers the
possibility of reducing the energy storage requirement on the vehicle but requires costly
roadway infrastructure upgrades. For CAVs in MaaS applications, XFC will likely be needed to
meet up-time operational requirements and might also necessitate automated charging due to
unmanned operation and to ensure safety.
7Electrical and Electronics Tech Team Roadmap
Technical Targets & Status
Target Definition
The 2025 technical targets for the ETDS are based upon what is needed for EDVs to be
competitive in performance and economics with ICE vehicles. Achieving these aggressive
targets will require major technological breakthroughs through early stage research. The ability
to efficiently package power electronics and electric motors across the range of vehicle types is
essential to achieving high volume production and reduced U.S. petroleum consumption. The
EETT metrics focus on key issues related to component cost and size to enable widespread
acceptance of these vehicles. The metrics are normalized based on a component or system
peak power rating into cost per kilowatt ($/kW) and power density (kW/liter).
Cost
Ultimately, EDVs should cost no more than comparable ICE vehicles. The cost targets allow for a
small price premium, but the cost difference should be no greater than 3 years of fuel cost
savings. As part of the US DRIVE 2025 target-setting process, vehicle level modeling and
simulation in Autonomie was carried out by VSATT and for EETT the result was $6/kW for a 100
kW peak power ETDS. While the 2025 target was derived based on consumer fuel savings
payback expectations, EDV use in MaaS fleet applications will likely shift focus to lifetime cost
and make the EDV business case more favorable.
Power Density
Power density is a very important target because of limited space “under the hood” and on the
vehicle in general. Packaging constraints vary with the different vehicle types: for PHEV
architectures, the ETDS must be added to a conventional ICE vehicle (i.e., a secondary drive
train) as well as a high-voltage battery, DC/DC converter and on-board charger; for BEV
applications, the space constraints are different, primarily driven by the large battery size and a
small vehicle footprint to achieve acceptable driving range (200 miles for 2020 and more than
300 for 2025). For BEV applications, the design freedom enabled by the lack of requirements for
the ICE compartment and driveline tunnel, which manufacturers typically use to expand the
passenger and cargo space, further limit ETDS component packaging to around the battery, in
the chassis alongside steering and suspension, and distant from vehicle crash zones. Increased
power density is required to address these packaging constraints and to enable a skateboard-
like chassis design that allows widespread electrification across all vehicle platforms.
Reliability
EETT’s reliability target was set to the traditional automotive life of 15 years or 150,000 miles.
Longer range EVs (200+ miles) are starting to be tested in MaaS applications due to lower
operating costs compared to ICE vehicles. HEVs and PHEVs are also gaining popularity in MaaS
applications because they can run power accessories at “idle” without running the ICE, thereby
8Electrical and Electronics Tech Team Roadmap
saving on fuel costs. Some of the taxi-like MaaS applications (up to 20 hours per day of
operation) can accumulate between 50,000 to 80,000 miles per year. Several automotive
OEMs, including General Motors, Tesla and Volkswagen and a number of startups (i.e., Faraday
Future and Lucid Motors) have indicated significant interest in EDV use for MaaS, and recent
literature and analysis reports see synergy between electrification and automation. Meeting
the future EETT targets by reducing the costs and size of ETDS components would accelerate
market penetration of EDVs in MaaS applications and thereby significantly increasing energy
efficiency and reducing emissions (greenhouse gas and criteria pollutants) per vehicle mile
traveled. Mileage accumulation and therefore vehicle turnover is a lot faster for MaaS and
therefore presents an opportunity for much faster and greater impact of reducing petroleum
use in the transportation sector. To accommodate the extended use of EDVs, the EETT
reliability requirements have been increased to 300,000 miles or 15 years.
Electric Traction Drive System Targets
The technical targets for 2025 shown in Table 2 are appropriate for all EDV applications.
Historically, when the EETT emphasized HEV applications, the targets were based on a 55 kW
power level. Vehicle mass has been increasing since targets were set and higher power levels
are needed for full EDV applications to meet consumer vehicle performance expectations. The
target includes high-voltage power electronics (one inverter and if needed a boost converter)
and a single traction-drive electric motor.
Table 2. Technical Targets for Electric Traction Drive System
ETDS Targets
Year 2020 2025 Change
Cost ($/kW) 8 6 25% cost reduction
Power Density (kW/L) 4.0 33 88% volume reduction
High-Voltage Power Electronics Technical Targets
An approximate allocation of the targets for the high-voltage power electronics is shown in
Table 3. The values estimate how much can be achieved with improvements to the high-voltage
power electronics and are consistent with the system-level targets. The targets in Table 3 refer
to a single 100 kW PIM and a boost converter if applicable; the DC/DC converter for powering
the auxiliary loads and the on-board charger have their own targets, and are not included in the
table.
Table 3. Technical Targets for High Voltage Power Electronics
Power Electronics Targets
Year 2020 2025 Change
Cost ($/kW) 3.3 2.7 18% cost reduction
Power Density (kW/L) 13.4 100 87% volume reduction
9Electrical and Electronics Tech Team Roadmap
The 2025 power electronics cost and volume targets are driven by the opportunity to replace
silicon switches with WBG devices which can significantly reduce the size of the power modules
while enabling operation at higher temperatures and frequencies. WBG devices are significantly
costlier than silicon equivalents, but enable overall power electronics cost decrease due to the
system cost reductions. Secondary-level targets or more appropriately technical guidelines for
advanced integrated power module (AIPM) design are included in Appendix A.
Electric Traction Motor Technical Targets
Although the technical targets have been established at the system level, an approximate
allocation of the targets between the electric traction motor and the high-voltage power
electronics is useful as guidance for projects that address one or the other. The values in Table
4 estimate how much can be achieved with improvements to the motor and, along with
comparable numbers for the power electronics, are consistent with the system-level targets.
Table 4. Technical Targets for Electric Traction Motor
Electric Motor Targets
Year 2020 2025 Change
Cost ($/kW) 4.7 3.3 30% cost reduction
Power Density (kW/L)1 5.7 50 89% volume reduction
Certain motor designs may have an impact on the weight, volume, and cost of other parts of
the vehicle. Although many vehicle architectures require two electrical machines to optimize
for vehicle efficiency, one as a motor and another as a generator, some of the architectures
make use of a single machine for both purposes for cost and packaging reasons. The targets in
Table 2 and Table 4 refer to a single 100 kW electric machine used for traction drive, specifically
its rotor, rotor shaft, stator with ending externs, housing and cooling but not reduction gearing.
The 2025 electric motor cost and volume targets are driven by the opportunity to reduce
material use with better application of existing or use of new materials to improve motor
performance. Secondary-level targets or more appropriately technical guidelines for advanced
electrical motor design (AEMD) are included in Appendix A.
DC/DC Converter Technical Targets
In addition to running accessories from the high-voltage bus, current PEVs require up to 3 kW of
14 V DC; the power level depends on the vehicle architecture and feature content. At a
minimum, a buck DC/DC converter is required to reduce the nominal 325 V battery voltage to
14 V to power most of the accessories. The DC/DC converter is not part of the propulsion
1
2020 power density target was based on 55 kW peak power at a 325 V nominal DC and resulted in 9.6 L motor
volume; 2025 target is based on 100 kW peak power at a 650 V nominal DC resulting in a 2L motor volume.
10Electrical and Electronics Tech Team Roadmap
system, but is an important part of electrification and increasing vehicle efficiency; therefore, it
is included in the scope of EETT. In addition, some of the technical developments for DC/DC
converters may be transferable to inverter designs. Table 5 shows technical targets for a 2-5 kW
DC/DC converter to reduce the battery voltage from a nominal input voltage of 325 VDC to 14
V. The 2025 cost target is such that it will cost no more than the alternator that it replaces.
Table 5. Technical Targets for DC/DC Converter
DC/DC Converter Targets 2020 2025
Cost, $/kW 1.2 4
Power density, kW/L >3.0 4.6
Efficiency >94% 98%
CAVs, which are planned for market introduction between 2020 and 2025, will most likely
require increased low voltage power for automated driving system components (i.e., cameras,
radar, light detection and ranging, central processing units). It is anticipated that DC/DC
converter power requirements for CAVs will increase up to 5 kW. Future long-range PEVs (300+
miles of all electric range) will be capable of extreme fast charging at power levels higher than
350 kW resulting in much higher battery voltages (i.e., 800 VDC) placing additional
requirements on the DC/DC converter.
On-Board Charger Technical Targets
All PEVs require an OBC, which converts AC input power from the EVSE (part of off-board
charging infrastructure, not located on the vehicle) into DC power for the on-board battery.
Table 6 shows technical targets for the OBC.
Table 6. Technical Targets for On-Board Charger
On-Board Charger Targets 2020 2025
Cost, $/kW 50 35
Specific power, kW/kg 3 4
Power density, kW/L 3.5 4.6
Efficiency 97% 98%
Wireless charging will likely become a more widespread option on future PEVs for consumer
convenience (i.e., not having to plug in the cord to charge the vehicle) and as an enabling
technology for CAVs in fleet use (i.e., automated charging). The vehicle receiver coil of the WPT
system and the supporting power electronics components will be integrated into the OBC;
however, none of these WPT system components are included in the targets presented in
Table 6 since the technology is still in the R&D stage.
11Electrical and Electronics Tech Team Roadmap
Many R&D gaps are currently being addressed to enable XFC beyond 350 kW to meet consumer
expectations of an 80% charge within 15 minutes or less. While EETT members are actively
engaged in closing the early stage research gaps associated with XFC power transfer (i.e., 800 V
WBG electrical vehicle architecture), no specific targets exist since the technology is still in the
R&D stage.
Current Technical Target Status
The 2017 manufacturing cost of a commercial on-road 100 kW ETDS, consisting of a single
electric traction motor and inverter, ranges between $1,600 and $1,800. Of this cost, the
electric motor accounts for approximately $600 to $800 and inverter about $1,000.
The 2015 EETT R&D target for the ETDS was $12/kW which was met for a 100 kW peak power
ETDS based on the U.S. Department of Energy (DOE) Vehicle Technology Office co-sponsored
industry and national laboratory R&D efforts. Table 7 shows comparison of 2025 ETDS technical
targets with current on-road technology status and 2015 EETT R&D technical targets. Significant
cost reductions are required, 50% compared to 2015 EETT R&D target and 67% compared with
current on-road technology, to meet the 2025 EETT R&D target of $6/kW. Significant size
reductions are also required to increase the ETDS power density as the system peak power
remains at 100 kW. To meet the 2025 EETT R&D target, the power density must be increased by
more than 800 percent compared to 2015 EETT R&D technical targets and 450 percent
compared to current on-road technology.
Table 7. Comparison of Current Status with 2025 Technical Targets for ETDS
ETDS Targets On-road 2015 R&D 2025 R&D 2025 vs. 2025 vs.
Status Target Target On-road 2015
Cost, $/kW 18 12 6 -67% -50%
Power density, kW/L 6 3.5 33 +450% +843%
Table 8 presents the same comparison as above for power electronics and electric motors.
Table 8. Current Status and 2025 Technical Targets for Power Electronics and Electric Motors
On-road 2015 R&D 2025 R&D 2025 vs. 2025 vs.
Status Target Target On-road 2015
Power Electronics
Cost, $/kW 10 5 2.7 -67% -34%
Power density, kW/L 18 12 100 +455% +733%
Electric Motors
Cost, $/kW 8 7 3.3 -59% -53%
Power density, kW/L 9 5 50 +455% +900%
12Electrical and Electronics Tech Team Roadmap
Figure 7 represents the 2015 target inverter cost breakdown by major contributing part based
on the technical cost modeling conducted by ORNL assuming high-volume production (100,000
units per year); similar information is presented for electric motor in Figure 8. Inverter cost
assessment is based on information from the Delphi High Temperature Inverter DOE funded
project2. The electric motor information is based on the ORNL High-Power Density Ferrite
Permanent Magnet Motor project3. For the inverter, the power module represents nearly 40%
of the total costs in large part due to the cost of the silicon IGBT switches. For the electric
motor, the stator with copper windings and rotor with magnets each represent nearly 40% of
the total cost. Electric motor cost is almost solely materials based by the amount and cost of
copper wire, steels and permanent magnets.
Figure 7. High Voltage Power Electronics Cost Status (2015 EETT target)
Source: Oak Ridge National Laboratory
2
FY2013 Annual Progress Report for the Advanced Power Electronics and Electric Motors Program
3
2016 U.S. DRIVE Highlights of Technical Accomplishments Overview Report
13Electrical and Electronics Tech Team Roadmap
Figure 8. Electric Motor Cost Status (2015 EETT target)
Source: Oak Ridge National Laboratory
Gaps and Barriers to Reach 2025 Technical Targets
Cost and size are the key barriers to achieving the EETT 2025 ETDS technical R&D targets and
increased EDV market penetration. The cost needs to be cut in half and size reduced by an
order of magnitude (Table 7), and power and reliability need to be doubled (82% peak power
increase to 100 kW and 100% reliability increase to 300,000 miles) to meet the 2025 targets.
According to industry input, the following high-level technology gaps need to be filled to
achieve 2025 cost and size reduction targets:
a) OEM driven:
100kW and greater WBG inverters to double the power
Multi-physics integration of power electronics to cut size in half
Non-rare-earth machines as insurance policy against rare-earth magnet price
volatility
Improved materials (i.e., copper, steel) to cut costs in half and double reliability
b) Supplier driven:
Understanding of system-level trade-offs (i.e., cost/performance impact of material
substitution)
Understanding of standard tests and requirements so they can leverage their
knowledge base to help develop technical solutions
Reduction in the volume of the components is necessary to enable ETDSs to fit within the
increasingly smaller spaces available on the vehicle. Motor volume reduction is limited by the
14Electrical and Electronics Tech Team Roadmap
flux density capabilities of materials used in current electric steels and the electrical
conductivity limitations of copper windings. Power electronics volume is currently driven by
stand-alone sub-components and the available passive components. The potential of WBG
devices to change design constraints has become a critical factor in driving size and efficiency
improvements. This, along with continued power electronics integration and simplification with
the necessary multi-physics improvements is needed for meeting the targets.
Power Electronics
Technical barriers for power electronics are:
WBG device power and voltage levels and availability. The commercially available WBG
devices are not ready for use in automotive qualified 800V+ and 100 kW ETDS.
WBG multi-physics integration designs to enable optimal use. While current power
electronics designs can be tailored to accommodate WBG devices, they do not fully
utilize WBG high voltage, high temperature and frequency capabilities. WBG devices are
more costly than traditional silicon devices, therefore it is important to maximize their
potential through multi-physics integration to reduce the overall system costs.
High temperature and isolation materials. WBG devices themselves are capable of
withstanding high junction temperatures, but the temperature tolerances of
surrounding layers, materials and interfaces need to be increased to achieve the goal of
compact, high-performance WBG-based components.
To address the power electronics barriers, R&D is needed to close the following technical gaps:
Higher power and high voltage WBG device availability
Development of a domestic supply chain
Component optimization for miniaturization and cost reduction. Low inductance
requirements for WBG multi-physics integration indicate a short path which causes
thermal management challenges. Thermo-mechanical reliability is also an important
consideration. High-performance materials with high-temperature capabilities will be
important.
Electric Motors
Electric motor specific barriers are:
Magnet cost and rare-earth element price volatility
Non-rare-earth electric motor performance
Material property optimization (e.g., isolation, conductivity)
Most production ETDS use permanent magnet (PM) motors which contain NdFeB magnets.
These magnets account for 20 to 30 percent of the total electric motor costs in today’s
15Electrical and Electronics Tech Team Roadmap
production systems. This is in large part due to the high prices of heavy rare-earth elements
(neodymium and dysprosium) which are needed to prevent demagnetization at high
temperatures. While the heavy rare-earth prices have come down substantially and remained
stable since the 2011 spike (Figure 9), there is still significant price volatility concern as today’s
designs will drive the vehicles to be commercialized in 4 years. China continues to dominate the
rare earth market, accounting for more than 90 percent of production. The long-term market
demand is strong and the only domestic source of rare earth elements (Mountain Pass mine)
closed after rare earth prices started to decrease. This puts the U.S. permanent magnet motor
market (and others) in a precarious position.
Figure 9. Rare Earth Metal Prices Track Oxides Very Closely
Source: Metal Pages courtesy of Critical Materials Institute
To address the electric motor barriers, R&D is needed to close the following technical gaps:
Reduced rare-earth magnet content and elimination of heavy rare earth elements
Development of non-rare-earth magnets and machine designs optimized for them.
Significant improvements are needed in non-rare-earth magnet motor packaging to
meet volume constraints.
New and improved materials to lower cost and improve performance and reliability.
Examples include silicon steel, ultra-conductive copper, and improved thermal materials
(i.e., improved enamels for higher voltage and motor potting).
Advanced cooling/thermal management techniques to reduce size, cost and improve
reliability.
16Electrical and Electronics Tech Team Roadmap
Strategy to Overcome Barriers and Achieve Technical Targets
The chosen strategy to overcome current barriers and achieve the technical targets is to
conduct R&D with industry input aimed at achieving a significant technology push. DOE national
laboratories are working with the supply base to improve WBG-based power electronics and
non-rare earth or magnet-less electric motors to meet the 2025 ETDS R&D targets. Component
targets and material requirements have been identified and reviewed with suppliers. Supplier-
based solutions have been encouraged as the national laboratories focus on early-stage
research to close the technical gaps in knowledge and on conducting system and component
tradeoffs. This will result in basic technology building blocks to be used as inputs for automotive
OEM advanced development groups. OEMs will provide guidance by reviewing requirement
development and conducting design reviews. Program status is evaluated in relation to the
technical targets on an annual basis.
Power Electronics Strategy
Power electronics technical gaps include: availability of large WBG devices, domestic supply
chain, and optimization for miniaturization and cost reduction. To address these gaps the main
R&D strategy includes WBG device manufacturer engagement, supplier industry engagement,
and component miniaturization to increase vehicle applications to reduce cost through
production scale. WBG device manufacturers can be engaged through DOE and industry co-
sponsored development projects, through national laboratory testing and evaluation, and by
developing and publishing guidelines or requirements for device manufacturers. Supplier
industry engagement could take the form of soliciting their input to advance innovation and in
return provide them technical guidelines to align their R&D investments with EETT goals.
Miniaturization could be achieved by researching board-based power electronics (planar
construction integrating bus structure, capacitor, and module substrate), full utilization of
emerging device capabilities, utilizing ultra-conducting copper as a key enabler, and use of high-
performance computing to accelerate innovation.
Potential R&D pathway for meeting 2020 cost target of $3.3/kW and 13.4 kW/L:
Deconstruction of traditional component boundaries and simplification
Component integration
Potential R&D pathway for meeting 2025 cost target of $2.7/kW and 100 kW/L:
Multi Physics Integration
Additional component integration
Device application
o Characteristics of full automotive operating range
o Optimal operating strategies and in-board device fabrication
17Electrical and Electronics Tech Team Roadmap
The resulting inverter component breakdown cost and percentages showing largest cost
contributors are shown in Table 9 and Figure 10.
Table 9. Potential Cost Pathway to Meeting 2025 Power Electronics R&D Cost Target
Source: Oak Ridge National Laboratory
Inverter Component Cost
Power Module $59
DC Bus Capacitor $38
Control Board $37
Gate Drive $60
Bus Bars/Terminal Block $26
Current Sensors $11
Miscellaneous $39
Total $270
Figure 10. Inverter Cost Breakdown for a Potential Pathway to Meeting 2025 Target
Source: Oak Ridge National Laboratory
Power Electronics R&D Areas
To carry out the power electronics strategy for meeting the 2025 targets, specific research is
needed in many areas to address the underlying issues. Figure 11 presents the power
electronics R&D areas and the following text describes the background and issues to be
addressed for each one.
18Electrical and Electronics Tech Team Roadmap
WBG AIPM
Multi Physics Thermal
Integration Strategy
Chip Set In-Board
Power Module Interconnect Passsives
Integration Devices
2025 Target: Automotive $270, One Liter Inverter
Figure 11. Power Electronics R&D Areas
Multi Physics Integration
Background: Traditional two-dimensional packaging is cost effective and allows for
larger distances between sub components providing for noise and thermal isolation. The
downside of long electrical pathways are higher parasitic resistance and inductance as
well as more material use. It also requires integration of multiple structure types and
results in a complex assembly.
Issues to be addressed: Common structure, simple design, electrical and thermal
isolation, and heat management.
Thermal Strategy
Background: Traditionally a heatsink is mounted to the power module. There have been
a few instances of double-sided cooling based on localized power module heat sink
cooling. The disadvantages of current approaches include: packaging limitations;
reduced cooling effectiveness of capacitors, gate drive, and controllers; limited vehicle
placement, and bulky designs.
Issues to be addressed: Compatibility with common vehicle thermal strategies and
effectiveness without decreasing vehicle system efficiency. Highly conductive thermal
materials that are electrically isolated and cost effective are needed.
19Electrical and Electronics Tech Team Roadmap
Power Module
Background: Traditional packaging typically provides a relatively cost-effective
construction. Disadvantages are: package inductance; material stack ups; and the need
for a large heatsink.
Issues to be addressed: Higher switching frequencies will require lower inductance to
reduce device voltage requirements. Higher temperatures enable downsizing but create
thermo-mechanical issues. Need to address interfaces with the next layer. Thermal
management system needs to be more effective without increased complexity to
increase packaging densities.
Passives
Passive components typically represent one of the largest costs of the power
electronics, and they also account for a major portion of the volume and weight.
Materials that offer improved dielectric properties, and higher temperature capabilities
are needed to reduce the overall volume. For example, Polymer-film capacitors are used
in most EDVs today, but they currently cannot tolerate sufficiently high temperatures
for future applications that will require 150 degrees Celsius (°C). Many current polymer-
film capacitors are typically rated at 85°C, but more-expensive ones are available that
can operate up to 105°C. Ceramic capacitors have excellent performance characteristics,
but cost, reliability, and achieving a benign failure mode remain issues.
Capacitors
Background: Smoothing out voltage and current in a switched power supply is critical.
Consistent performance over the temperature operating range, high energy density, low
equivalent series resistance, and graceful failure are required. Disadvantage of current
capacitor technology are high temperature operation (above 105°C) and limited energy
density.
Issues: Introduction of WBG and need to reduce the length of electrical pathways
requires smaller DC bus capacitor that can be highly integrated with the switching
devices and capable of operating at higher temperatures.
Inductors
Background: Inductors store energy to stabilize output current in power converters for
constant current output during operation. With gate drive and power supply in inverter,
inductors can be much smaller and are less of a focus for inverters compared to
converters where the inductor is the main part of the power stage. Critical factors in
performance are core and copper losses, thermal management, core materials and
aging effects.
20You can also read