Electroencephalography measures of relative power and coherence as reaching skill emerges in infants born preterm - Nature
←
→
Page content transcription
If your browser does not render page correctly, please read the page content below
www.nature.com/scientificreports
OPEN Electroencephalography measures
of relative power and coherence
as reaching skill emerges in infants
born preterm
Ryota Nishiyori1,6*, Ran Xiao2,6, Douglas Vanderbilt3 & Beth A. Smith1,4,5
Electroencephalography (EEG) measures of relative power and coherence are associated with motor
experience in infants with typical development, but these relationships have not been assessed
in infants born preterm. The goal of our study was to investigate the changing patterns of relative
power and coherence in the alpha band during resting state EEG in infants born preterm as they
developed the skill of reaching. We collected monthly longitudinal data from fourteen infants born
preterm between the adjusted ages of 56 and 295 days for a total of 37 sessions of EEG data. Alpha
band power at motor cortices and cross-regional connectivity do not present consistent changing
trends at the group level in infants born preterm. Individual level analysis reveals that infants born
preterm are a heterogeneous group with subtypes of neural function development, some presenting
similar changing trends as observed in the typically developing group while others present atypical
patterns. This may be linked to the variability in developmental outcomes in infants born preterm.
This study was a critical first step to support EEG as a potential tool for identifying and quantifying the
developmental trajectories of neuromotor control in infants born preterm.
Compared to infants born at term, infants born preterm are at risk for impairments in fine and gross motor skills1
and speaking and writing2. Basic neuroscience principles and laboratory data support that early intervention
can positively impact experience-dependent plasticity, thus improving the trajectory of motor development3. A
recent review supports the importance of implementing early interventions, however only a few interventions
have shown positive effects on motor outcomes and only in the short term ( see4 for review). A contributing
factor to the low number of successful interventions and a prominent challenge in the field is our lack of ability
to quantitatively assess impaired neuromotor control during infancy. Establishing a quantitative assessment of
infant neuromotor control would provide a measure to track infants born preterm who are at risk for neuromotor
impairments, thus allowing clinicians to provide early and targeted interventions and assess outcomes.
To date, there are no scales of infant development that can, with high sensitivity and specificity, identify and
quantify impaired neuromotor development within the first months of life. For example, the Alberta Infant Motor
Scale (AIMS), using a cutoff of below the 10th percentile at 4 months of age for infants born at less than 36 weeks
of gestation, yielded a 77.3% sensitivity and 81.7% specificity to predict abnormal from normal classification at
18 months5,6. Prechtl’s General Movements Assessment (GMA), while highly sensitive and specific (98% and
91%) at predicting cerebral p alsy7 (CP), is less accurate in predicting poor neuromotor outcomes more broadly.
When infants born at less than 30 weeks’ gestation showed abnormal movements at 1 month of corrected age,
GMAs produced a sensitivity of 100% and specificity of 42% to predict moderate to severe motor impairment at
2 years of age. When the same infants were tested at 3 months corrected age, sensitivity was 70% and specificity
at 85% to predict moderate to severe motor impairments at 2 years of a ge8. Both the AIMS and GMA, two widely
used assessments, are not highly accurate at predicting later motor impairments, nor do they quantify impaired
neuromotor development early in life.
1
Division of Research on Children, Youth, and Families, Children’s Hospital Los Angeles, Los Angeles, USA. 2School
of Nursing, Duke University, Durham, USA. 3Department of Pediatrics, Division of General Pediatrics, Keck School
of Medicine, University of Southern California, Los Angeles, USA. 4Department of Pediatrics, Keck School of
Medicine, University of Southern California, Los Angeles, USA. 5Developmental Neuroscience and Neurogenetics
Program, The Saban Research Institute, Los Angeles, USA. *These authors contributed equally: Ryota Nishiyori
and Ran Xiao. *email: rnishiyori@chla.usc.edu
Scientific Reports | (2021) 11:3609 | https://doi.org/10.1038/s41598-021-82329-7 1
Vol.:(0123456789)
www.nature.com/scientificreports/
Participant Gender Gestational age Weight (kg) Length (cm)
1 M 23 weeks 2 days 1.79 –
2 M 28 weeks 5 days 1.22 36.83
3 M 24 weeks 4 days 1.59 38.10
4 M 31 weeks 6 days 1.81 –
5 M 31 weeks 1 days 1.79 40.64
6 M 31 weeks 4 days 1.60 38.10
7 F 26 weeks 1 days 0.74 –
8 M 25 weeks 0 days 0.62 –
9 F 30 weeks 5 days 1.33 38.99
10 F 30 weeks 4 days 1.45 38.10
11 F 28 weeks 4 days 1.45 –
12 M 32 weeks 0 days 1.77 41.91
13 F 30 weeks 3 days 1.53 39.37
14 M 24 weeks 2 days 0.65 30.99
Table 1. Participant characteristics at birth. A (−) indicates no data for participant.
Electroencephalography (EEG) shows potential to be used to quantify neuromotor development. Previ-
ous studies have shown that differences in mu rhythm are associated with the acquisition of functional motor
skills and the role of motor experience. Mu rhythms are similar in frequency range with the alpha range but
specifically arise from the motor cortex and were more strongly suppressed in the 7 to 9 Hz range when infants
observed a familiar motor skill compared to an unfamiliar o ne9. Moreover, Xiao and c olleagues10 found that in
the weeks leading up to the onset of crawling, infants exhibited increased resting state power in the alpha band
and spatio-spectral patterns centered upon the central areas, which were not observed in lower bands such as
delta and t heta10. Xiao and c olleagues11 examined infants as young as 1 month and showed that resting state
alpha band power increases with age, with a marked “bump” at 7 months of age. The researchers expanded upon
the relationship between mu rhythm development and the emergence of motor skills, measured by reaching
skill level and motor scores on the Bayley Scales of Infant and Toddler Development, 3rd edition12 (BSID-III).
EEG also provides a way of quantifying the existing functional connections between brain regions (coher-
ence), which has been shown to change as infants learn functional motor skills. Bell and F ox13 examined the
changes in cortical development as a function of crawling experience in 8-month-old infants and showed that the
onset of locomotion is associated with changes in resting state cortical organization. Infants with 1 to 8 weeks of
crawling experience showed greater coherence between frontal-parietal, parietal-occipital, and frontal-occipital
regions compared to same-aged non-crawlers and experienced crawlers (> 9 weeks). Similarly, Corbetta et al.
investigated a similar question, but related to walking e xperience14. The researchers found a similar association
between motor experience and changes in resting state coherence. That is, novice walkers exhibited the highest
levels of coherence compared to same-aged non-walkers and experienced walkers. All infants were 12 months
of age; the emergence of walking occurred at different ages and its emergence was associated with patterns of
cortical reorganizations and changes in brain c onnectivity14. Indeed, these studies have shown that in infants
with typical development (TD), motor experience and the emergence of functional motor skills are reflected in
changes in resting state EEG measures of relative power and coherence.
To date, most research has focused on examining alpha band activities to understand its relationship with
typical neuromotor development. Our previous research has shown that infants with TD exhibit changes in
resting state relative power and coherence within the alpha band as reaching skill e merged11. Our next step was
to examine if infants born preterm showed similar neurodevelopmental patterns. Thus, our objective here was
to investigate the relationship between changes in alpha band activities, via relative power and coherence, and
motor skills in infants born preterm. To characterize the longitudinal development of neural function, we took
monthly measurements of EEG as arm reaching skill developed across the early months of life. We studied the
developmental changes in connections between brain regions and modeled the relationship between changes in
coherence in the alpha band and age, and motor development scores (reaching skill level, fine and gross motor
scores from the BSID-III12 in infants born preterm. Finally, we used linear regression fitting for individual
participants to compare variations across individual developmental trends between infants born preterm (this
sample) and infants with typical development (previous sample).
Results
We collected monthly EEG measurements and synchronous video recordings from fourteen infants born preterm
(adjusted ages between 56 and 295 days), from which we computed various EEG metrics to comprehensively
evaluate characteristics of neuromotor development in infants born preterm. We first calculated power spectral
density to study the spectral and spatial profiles of infant alpha band from the motor cortices. Next, brain con-
nectivity was captured by alpha band coherence of EEG channel pairs placed at different brain regions. For all
EEG metrics, we studied their longitudinal changes along age (i.e., adjusted age) and various motor development
scores (reaching skill level determined by analyzing synchronous videos, raw fine and gross motor scores from
the Bayley Scales of Infant Development-III). Table 1 provides participant characteristics from at birth.
Scientific Reports | (2021) 11:3609 | https://doi.org/10.1038/s41598-021-82329-7 2
Vol:.(1234567890)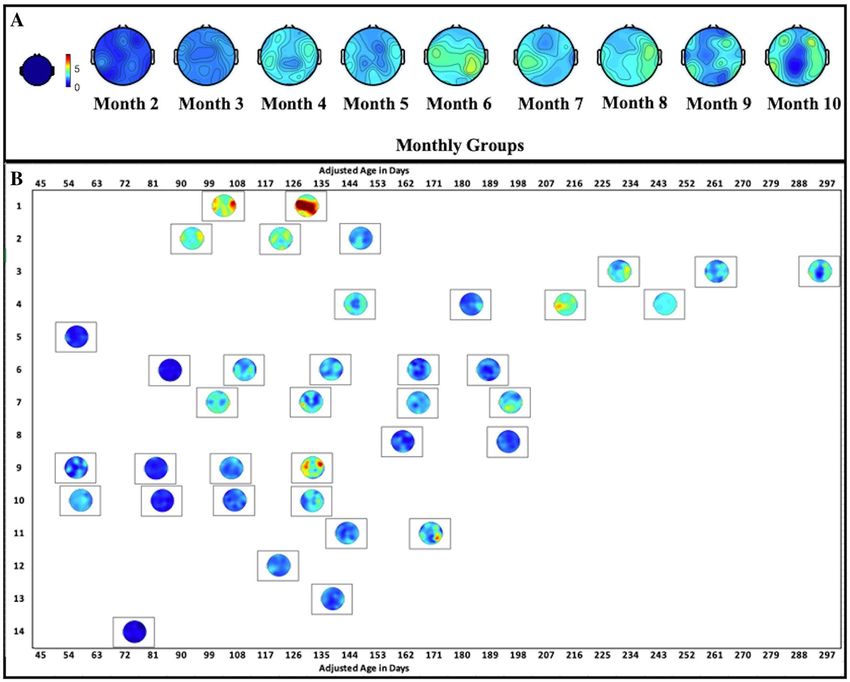
www.nature.com/scientificreports/
Figure 1. Monthly spectral profiles (power spectral densities, PSD) from motor cortices, channels C3, Cz, and
C4. Shaded areas represent standard deviation for each month group (adjusted age). Inset provides a zoom-in
view of spectral profiles in the 6–9 Hz.
EEG spectro‑spatial patterns along monthly age. The spectro-spatial patterns in EEG were first
examined against monthly age to quantitatively evaluate how alpha band power changes along age and cor-
responding progression in cortical patterns. Monthly age was calculated based on the infant’s adjusted age in
days at the visit. We grouped and averaged the spectral profiles with the same monthly age (Month 2 = ages 56
to 83, Month 3 = ages 84 to 111, Month 4 = ages 112 to 139, Month 5 = ages 140 to 167, Month 6 = 168 to 195,
Month 7 = 196 to 223, Month 8 = 224 to 251, Month 9 = 252 to 279, Month 10 = 280 to 307 adjusted days). Spec-
tral profiles (in relative power) of the 0 to 30 Hz range from the motor cortices were grouped by their respective
monthly age. Figure 1 presents monthly spectral profiles in the 2 to 10 Hz range to best emphasize changes in
the frequency range of interest).
Each line represents the average spectral profile across all sessions from one monthly age color coded from
cool to warm with increasing age. The shaded area shows the region with one standard deviation of sessions of
the same monthly age. Based on visual inspection, notable changes can be observed within the 3 to 6 Hz band,
but not in the 6 to 9 Hz (alpha) band. Although lowest spectral profiles can be observed in our youngest groups
(black lines), neither alpha nor lower frequency bands show consistent changing patterns in relative power.
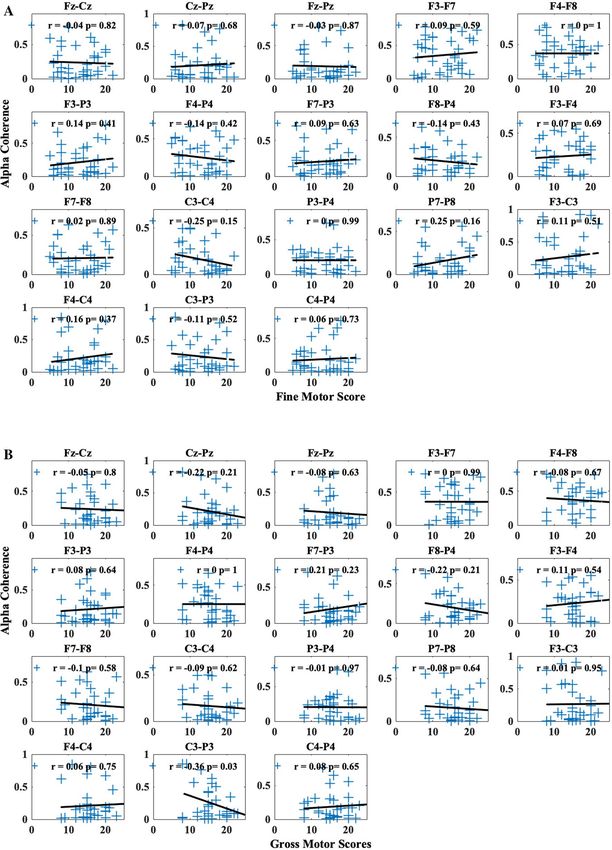
Changes in spatial patterns of alpha band power were visually evaluated through topographic maps grouped
by monthly age in Fig. 2A.
Each plot represents the average alpha topographic map based on one monthly age. The maps present a gen-
eral increasing pattern of cortical activity in alpha band along age, especially between early months (2 and 3) and
later months (4 and after). With increasing age, alpha band power emerges, and the emergence and enlargement
of alpha power can mostly be observed within or near the regions of the motor cortices.
Alpha band power and spatial patterns along age in adjusted days. Besides developmental
changes in alpha band power grouped at the monthly level, the following results present changes in spectro-
spatial patterns of alpha band power at the individual-session level with a daily age resolution. Figure 2B shows
the topographic maps of each individual session plotted against age in adjusted days. Based on visual inspection,
individual level variability in the changing of alpha power can be observed. Most participants with multiple EEG
recordings present general increasing trends (although some are not monotonic) comparing earlier to later ses-
sions. The changes from cooler to warmer colors surrounding the central cortical areas can be seen in a subset of
infants, representing an increase of alpha band power with age, while others show mixed patterns.
A scatter plot of alpha band power from individual sessions against corresponding age in adjusted days is
shown in Fig. 3.
It reveals a potentially increasing trend between alpha band power and age. The Pearson correlation test
showed that these variables were not significantly correlated (r = 0.31, p = 0.06). Furthermore, we conducted a
likelihood ratio test with two LMM models, with and without subject variation as the random effect to assess
the impact of repeated measures from subjects. The test demonstrated that there was no significant impact of
subject variation on the changes of alpha activities along age (χ2 = 3.31, p = 0.07).
Scientific Reports | (2021) 11:3609 | https://doi.org/10.1038/s41598-021-82329-7 3
Vol.:(0123456789)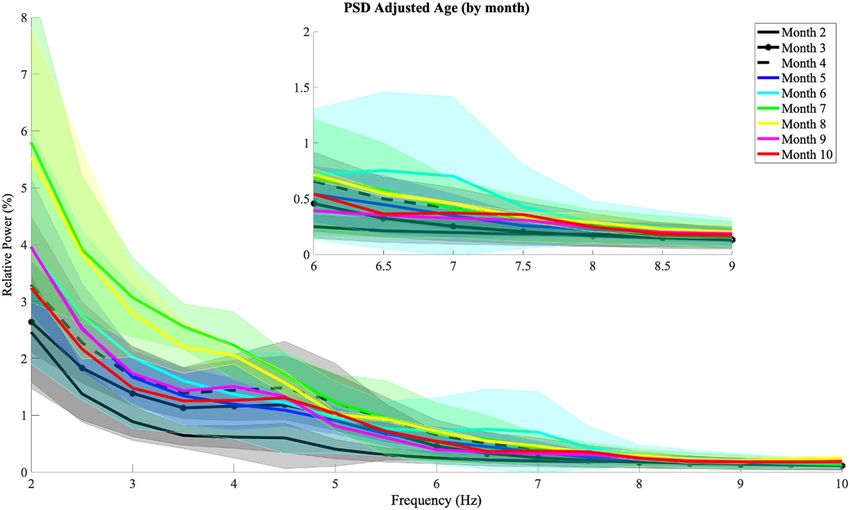
www.nature.com/scientificreports/

                                            Figure 2.  (A) Individual topography maps of alpha band power (6–9 Hz) for all sessions. Topographies of each
                                            infant’s (y-axis) visits are plotted along adjusted age in days (x-axis). (B) Topographies of alpha band power for
                                            each month group (adjusted age). Warmer colors represent a higher relative power.

                                            Figure 3.  Correlation of alpha band power (6–9 Hz) from motor cortices (C3, Cz, and C4) with adjusted age
                                            in days. Each circle represents the alpha band power from an individual session. The bold line shows the least-
                                            squares fitted line along age. The r and p values are the results from the correlation test.

          Scientific Reports |   (2021) 11:3609 |                https://doi.org/10.1038/s41598-021-82329-7                                                   4

Vol:.(1234567890)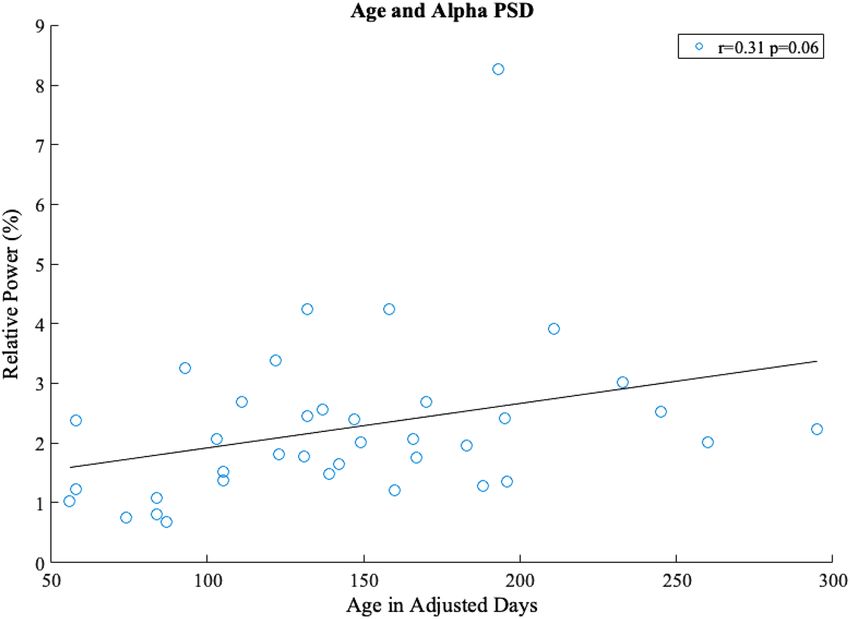
www.nature.com/scientificreports/
PT TD
Participant Gradient Intercept Fitting error Participant Gradient Intercept Fitting error
TD2 2.10E−03 1.78 0.79
PT1 0.12 − 13.94 3.97E−15
TD3 1.27E−02 0.33 1.47
TD4 − 5.38E−03 2.56 0.27
PT2 3.08E−03 1.46 1.38
TD5 − 2.50E−02 8.42 4.44E−15
TD9 − 2.36E−02 5.64 0.58
PT3 3.67E−02 −3.56 8.34E−07
TD11 − 4.75E−03 3.10 0.00
TD12 1.10E−02 1.89 0.75
PT4 − 2.21E−02 5.57 0.64
TD13 7.74E−02 − 7.69 1.99E−15
TD14 − 2.43E−02 7.20 0.99
PT6 − 1.16E−02 5.46 0.55
TD15 1.99E−02 0.12 4.97E−16
TD17 − 8.84E−03 4.72 4.44E−16
PT7 6.60E−03 1.40 1.39
TD18 4.78E−02 − 0.98 0.67
TD20 1.35E−02 1.24 0.76
PT8 8.29E−04 1.68 1.70
TD21 5.14E−02 − 2.18 1.33E−15
TD22 − 4.37E−03 4.58 1.93
PT9 4.49E−03 1.41 0.33
TD23 − 1.86E−02 5.64 1.50
PT10 3.94E−03 0.58 1.69E−07 TD24 3.67E−02 − 1.10 8.88E−16
PT11 3.95E−02 − 1.72 1.45 TD25 − 3.97E−02 7.29 1.60E−15
Variance 1.53E−03 31.09 0.46 Variance 9.53E−04 16.04 0.38
Min − 0.02 − 13.94 3.97E−15 Min − 0.04 − 7.69 0.00
Max 0.12 5.57 1.70 Max 0.08 8.42 1.93
Average 0.02 − 0.17 0.74 Average 0.01 2.36 0.54
Stdev 0.04 5.58 0.68 Stdev 0.03 4.00 0.62
Table 2. Gradience, intercept, and fitting error values from best-fitted line between alpha-motor relative
powers and age at respective visits. Variance, minimum, maximum, average, and standard deviation were
calculated within the subset of infants who had two or more visits shown here.
To further validate the correlation between alpha band power and age, a bootstrapping approach was adopted
to generate a null distribution of correlations between pseudo alpha power with randomly shuffled frequencies
and age, which was compared with the true correlation. Using the two-sided Wilcoxon rank sum test, the cor-
relation between alpha band power and age is not significantly different from random (p = 0.24).
Comparison of variance in developmental heterogeneity. This subsection provides insights into
developmental heterogeneity in in our current sample of infants born preterm and its comparison to our previ-
ously collected data from infants with TD11. Data from participants with at least two EEG recording sessions
in both groups were selected for the analysis, resulting in 10 participants in the preterm group and 18 partici-
pants in the TD group. Linear regression fitting was performed for each participant with various fitting metrics
extracted to capture variations across individual developmental trends. Variances in gradients and intercepts
were first calculated to evaluate cross-participant differences within each group. In addition, developmental
changes within each participant were accounted for by the variance in fitting errors. The variances of three fit-
ting metrics are presented in Table 2. The preterm group shows higher variances in all three metrics compared
with infants with TD.
Brain connectivity along age and motor experience. Brain connectivity was evaluated by calculating
the mean-squared coherence in the alpha band for 18 electrode pairs covering frontal, motor, and parietal brain
regions, chosen a priori based on previous research11. In Fig. 4A, the changes in alpha coherence are plotted
against age in adjusted days.
There is no clear significant pattern of change in coherence as age increases (p > 0.05). Similarly, reaching skill
levels did not show a pattern that would significantly correlate (p > 0.05) with changes in alpha coherence across
the electrode pairs (Fig. 4B). Finally, both fine motor (Fig. 5A) and gross motor (Fig. 5B) scores are scattered
and show no significant trend with any of the electrode pairs.
Table 3 provides the results of the likelihood ratio tests (chi-square and p values) of our predictors and rela-
tionship with changes in alpha coherence.
We adjusted the alpha level to 0.05/18 to address the issue of multiple comparisons. Based on this adjusted
alpha level, the likelihood ratio tests did not detect any significant relationships between our predictors and
coherence values for any of the 18 electrode pairs. Figures 4 and 5 depict the relationship between the predictor
(age, reaching skill level, BSID-III fine and gross motor raw subscale scores) with each of the electrode pairs with
a Pearson correlation value (r) with a least-squares fitted line to represent the changing trend.
Scientific Reports | (2021) 11:3609 | https://doi.org/10.1038/s41598-021-82329-7 5
Vol.:(0123456789)www.nature.com/scientificreports/
Figure 4. Change in mean alpha (6–9 Hz) coherence (A) along adjusted age in days and (B) across reaching
skill levels for each electrode pair. Within each scatter subplot, blue crosses represent mean alpha coherence for
each session and dashed lines represent the least-squares fitted lines. With each bar subplot, bars represent mean
alpha coherence for sessions with the same reaching skill level with standard deviation error bars on top. The r
and p values are the results from the correlation test.
Discussion
The goal of our study was to examine resting state relative power and coherence in the alpha band in infants
born preterm across the time period when reaching was emerging. Neurophysiological metrics (alpha band
power and coherence) from longitudinal resting state EEG recordings in infants born preterm holds important
information on changes in neural function in this high-risk group and profiles their change (or lack of change,
in some cases) in patterns along maturation and motor skill development. The preterm group did not show a
consistent pattern of change as we previously saw in a group of infants with TD. This study was a critical first step
Scientific Reports | (2021) 11:3609 | https://doi.org/10.1038/s41598-021-82329-7 6
Vol:.(1234567890)www.nature.com/scientificreports/
Figure 5. Change in mean alpha coherence along (6–9 Hz) (A) fine motor and (B) gross motor scores from
Bayley Scales of Infant and Toddler Development, 3rd edition for each electrode pair. Within each subplot, blue
crosses represent mean alpha coherence for each session and dashed lines represent the least-squares fitted lines.
The r and p values are the results from the correlation test.
Scientific Reports | (2021) 11:3609 | https://doi.org/10.1038/s41598-021-82329-7 7
Vol.:(0123456789)www.nature.com/scientificreports/
Adjusted Reaching Fine motor Gross motor
age scores scores scores
Electrode pair χ2 p χ2 p χ2 p χ2 p
Fz–Cz 0.37 0.54 0.08 0.78 0.00 0.97 0.04 0.84
Cz–Pz 0.15 0.70 0.01 0.93 0.22 0.64 2.09 0.15
Fz–Pz 0.36 0.55 0.00 1.00 0.16 0.69 0.51 0.48
F3–F7 0.39 0.53 0.44 0.51 0.26 0.61 0.00 0.98
F4–F8 0.29 0.59 0.00 0.96 0.09 0.76 0.09 0.76
F3–P3 1.19 0.28 1.72 0.19 0.60 0.44 0.14 0.71
F4–P4 0.90 0.34 0.68 0.41 0.58 0.45 0.02 0.89
F7–P3 0.23 0.63 0.00 0.97 0.01 0.92 0.02 0.89
F8–P4 1.41 0.24 0.11 0.74 1.36 0.24 2.46 0.12
F3–F4 0.07 0.80 0.47 0.49 0.18 0.67 0.41 0.52
F7–F8 0.29 0.59 0.01 0.90 0.02 0.90 0.38 0.54
C3–C4 2.83 0.09 1.89 0.17 2.37 0.12 0.61 0.43
P3–P4 0.03 0.86 0.19 0.66 0.00 0.99 0.00 0.97
P7–P8 0.65 0.42 0.33 0.56 0.71 0.40 0.41 0.52
F3–C3 0.26 0.61 0.02 0.90 0.01 0.90 0.00 0.99
F4–C4 0.60 0.44 0.58 0.45 0.83 0.36 0.03 0.85
C3–P3 0.98 0.32 0.42 0.52 0.44 0.50 4.50 0.03
C4–P4 0.48 0.49 0.88 0.35 1.07 0.30 0.10 0.75
Table 3. Likelihood ratio tests for changes in mean alpha coherence across adjusted age (days), reaching skill
level, fine motor scores, and gross motor scores, for 18 electrode pairs. Alpha value of 0.05/18 was selected for
the statistical tests.
to support EEG as potential tool for identifying and quantifying the developmental trajectories of neuromotor
control in infants born preterm.
In this study, we evaluated alpha band power longitudinally as reaching was emerging in infants born preterm.
Overall, we did not observe an increasing pattern in alpha band power when spectral profiles were grouped by
monthly age (Fig. 1). Relative power from individual sessions potentially showed a pattern of increase along
adjusted age in days that did not reach statistical significance (Fig. 3). Topographies of alpha band power along
monthly age show a pattern for the emergence of alpha band power, centering around the motor areas (Fig. 2B).
Individual topographies along adjusted age in days reveal diverse changing patterns in alpha band power, with
a subset of the infants born preterm in our sample showing increases in alpha band power and others without
a cohesive changing pattern (Fig. 2A).
We also examined the changes in coherence and their associations with predictors (age, reaching skill level,
fine motor scores, and gross motor scores). Using Pearson correlation, we examined the linear relationship
between changes in coherence and age and motor development scores. Although coherence values from electrode
pairs, such as C3–C4 and C3–P3, showed certain levels of changing trends based on age (r = − 0.28 and − 0.17,
respectively) or various motor development scores (reaching skill level: r = − 0.27 and − 0.12; fine motor: r = 0.25
& − 0.11; gross motor: r = − 0.09 and − 0.36, for each electrode respectively), these relationships did not reach
statistical significance using likelihood ratio tests with LMM for each predictor after adjustment for multiple
comparisons (adjusted age: p = 0.09 and 0.32; reaching skill level: p = 0.17 and 0.52; fine motor: p = 0.12 and 0.50;
gross motor: p = 0.43 and 0.03, respectively) (Table 3).
Overall, our results differ from those seen in a previous study with infants with TD. Our results in the previous
study revealed that infants with TD show an increase in resting state alpha band power during the first 7 months
of age11. In the present study, alpha activities, when grouped by monthly age, showed no marked increase in
relative power. At an individual level, however, a subset of infants showed increase in alpha band relative power,
while others did not. This indicates that some infants born preterm might follow a similar developmental path to
infants with TD, while others do not, and this can potentially be discerned using EEG before motor skill differ-
ences are apparent. Furthermore, our previous study showed that connectivity between frontal-parietal regions
increased as gross motor scores increased and interhemispheric connectivity in motor cortices decreased as fine
motor scores increased in infants with TD11. In the present study, infants born preterm did not exhibit significant
relationships at a group level between changes in alpha coherence and age, reaching skill level, or fine and gross
motor scores. Thus, group-level analyses may not capture the individual differences in infants born preterm.
This is consistent with the variability in developmental outcomes for infants born preterm, some end up with
diagnoses of developmental disabilities while others do not.
Our study focused on the emergence of alpha band power during a time when infants are becoming skilled
at reaching. As such, our objective centered upon the alpha band or mu-rhythm, which has been associated with
the development of functional motor skills in infants with TD15. The infants born preterm in our sample did
not show a clear increasing trend in both reaching skill level and fine and gross motor scores in the BSID-III,
and moreover they did not show changes in the alpha band at a group level. Although the changes in behavior
Scientific Reports | (2021) 11:3609 | https://doi.org/10.1038/s41598-021-82329-7 8
Vol:.(1234567890)www.nature.com/scientificreports/
based on these same scores were reflected at the group level in EEG measures in infants with T D11, this was not
true here in infants born preterm. Infants in our sample, as shown in Table 1, represent the variability typically
seen in this population.
This suggests two possibilities: (1) infants born preterm are a heterogenous group, some of whom look similar
to infants with TD while others do not, and/or (2) changes may be observed in other frequency bands. We took
a bootstrapping approach and demonstrated that infants born preterm did not exhibit a significant alpha-band
specific correlation with age. This further suggests that infants born preterm may show emergence of relative
power at different frequency bands and points in time, unlike the commonly observed changes in alpha-band
power in infants with TD.
In regard to other frequency bands, previous studies have shown that infants born preterm exhibit increase
in power at lower frequency bands, such as delta (0.5 to 4 Hz) or theta (4 to 8 Hz) bands compared to control
or infants born near t erm16,17. Suppiej and colleagues have shown that infants born extremely low gestational
age (ELGA) have higher relative power in the delta (0.5 to 4 Hz) band compared to healthy late preterm infants
born between 34 to 35 weeks of gestational age (control). The study also found that other frequency bands such
as theta and alpha were lower in the ELGA group compared to the control group. Such shift in relative power
bands has been shown in other studies investigating preterm infants and newborn i nfants16,17. Similarly, in our
dataset, we did not see an increase in alpha band power from a sample that includes infants that would fall into
the category of extremely low gestational age, as shown in the aforementioned s tudy17. Thus, future research
should examine more closely the emergence of relative power in frequency bands such as theta, and its relation-
ship to age and motor development scores.
Our study results were able to shed light on the heterogenous group within infants born preterm—patterns
of change similar and dissimilar to infants with TD. While the group of infants born preterm did not show a
significant increase in relative power, a subset of infants born preterm showed an increase in relative power in
the alpha band similar to infants with TD. Further research is warranted in infants born preterm to characterize
the relationships between brain function and motor development in infants born preterm who showed change
in EEG patterns similar and dissimilar to infants with TD. By doing so, we will be able to further develop the
use of EEG as a useful tool to quantify neuromotor development early in life, before differences in motor skill
development can be accurately assessed.
Our study was a limited sample due to the COVID-19 pandemic which ended our data collection. As a result,
we were not able to acquire complete datasets (through skilled reaching) for half of our infants who were already
enrolled. Despite our limited sample size, our data are important as they reflect the variability that is commonly
observed in outcomes for infants born preterm. A subset of the infants in our study showed changes in relative
power and coherence similar to infants with TD while others in our study were not similar. This variability in
the pattern of brain function development is representative in a group of infants born preterm, who may or may
not go onto develop neuromotor impairments. We do not expect different findings even in a larger sample; a
consistent group pattern is not expected to emerge from a group of infants born preterm who appear to have
a multimodal distribution (some preterm infants look like infants with TD while others do not). However, by
utilizing the complete dataset to be collected, a more objective profiling of diverse subtypes of neural function
changing patterns can be achieved with data driven algorithms (such as latent class analysis, and cluster analysis),
which will be one of our future efforts.
The higher variance in gradients, intercepts, and fitting errors indicate that the developmental heterogeneity
is larger in the preterm group, compared to the TD group (see Table 2). The larger heterogeneity supports our
findings that our preterm group shows mixed trajectories leading to no group differences when compared to the
TD group. Our individual-level analyses further supported the increased heterogeneity in the preterm group
compared to the TD group from our previous dataset. The higher variance in our current dataset demonstrates
that the predictors (age, reaching skill level, and fine and gross raw motor scores) used in the previous study
examining infants with TD do not play a clear, consistent role in the present study’s dataset. This suggests that
there was no significant and alpha-band specific correlation with age in our sample. Furthermore, our sample
of infants born preterm represent the variability typically seen in this population. As such, individual analyses
compared against infants with TD provides meaningful insight into future analyses that would improve our
understanding of changes in neural function as infants born preterm learn to motor skills.
EEG has known limitations such as sensitivity to non-neural factors like skull and tissue thickness between
the cerebral cortex and electrodes. Moreover, noise introduced by factors such as hair and the fit of the cap also
introduce artifacts into the data. We adopted a comprehensive data preprocessing pipeline and used relative
power instead of absolute power to normalize the data within individual sessions, thereby mitigating these issues.
Additionally, we employed likelihood ratio tests that consisted of two models, a null and alternative, to test the
effect of subject variation (e.g. repeated measurements). In the null model, the random intercept was removed
and compared to the alternative model, which consisted the random intercept. This test showed that there was
no significant impact due to subject variation (p = 0.07).
EEG referencing is another point of debate. We used cortical reference points for EEG processing similar
to other studies examining infant motor development. This allows us to make direct comparisons between our
results with previous studies, which is an important element as our goal is to better understand the differences
between infants born preterm and term. EEG amplifiers measure potential differences between activities recorded
by two electrodes; thus, the reference electrode is ideally electrophysiologically silent18,19. Commonly used refer-
ences are the ear, linked mastoids, vertex, and neck ring, but unfortunately no site is truly i nactive18,19. Alternative
approaches such as the reference electrode standardization technique (REST) recovers the temporal information
in EEG by standardizing the reference point at i nfinity20. As studies continue to show the impact the choice of
reference point has on the EEG analysis, future research will need to compare and contrast findings that utilize
methods such as R EST20 with our current selection.
Scientific Reports | (2021) 11:3609 | https://doi.org/10.1038/s41598-021-82329-7 9
Vol.:(0123456789)www.nature.com/scientificreports/
In conclusion, our current study showed that some infants born preterm showed developmental patterns of
brain function similar to infants with TD, while others did not. How these findings related to neurodevelop-
mental outcomes is unknown. Future research is warranted into examining different frequency bands in this
population to explore the relationship with emerging arm reaching skill. This study was an important first step
to characterize the neural function of infants born preterm as arm reaching emerges. We hope that future studies
can build off of ours to provide further insight onto determining which infants born preterm go onto develop
neuromotor impairments.
Method
Participants. This study was approved by the Institutional Review Board of the University of Southern Cali-
fornia and all methods were carried out in accordance with relevant guidelines and regulations. Informed con-
sent was obtained from a parent or legal guardian before participation. Infants were recruited from local hospi-
tals in the Greater Los Angeles area of California or word of mouth and were eligible to enroll if their gestational
age at birth was less than 32 weeks. Infants with unstable medical conditions were excluded.
Fourteen infants between the adjusted ages of 56 and 295 days participated in the study. Adjusted age was
calculated by subtracting the number of days between due date and date of birth from the chronological age in
days at the time of the visit. Our goal was to measure infants longitudinally across the time period when arm
reaching was emerging. Monthly visits ranged from 1 to 5 and varied for each infant. Monthly visits started as
early as possible and continued until the infant demonstrated skilled reaching, determined by a research team
member. The total dataset had 7 participants with 3–5 sessions, 3 participants with 2 sessions and 4 participants
with 1 session. Data collection was stopped in March of 2020 due to the COVID-19 pandemic. This resulted in
7 participants with complete datasets (through skilled reaching) and 7 participants with partial datasets. This
resulted in a total of 37 EEG sessions for preprocessing and analysis.
Session overview. At each visit, a wearable sensor (Opal sensor; APDM Inc, Portland, Oregon) was placed
on each arm of the infant using a custom wrist band with an internal pocket. Infants were video recorded for
five minutes of spontaneous movements in supine position. The infants wore these sensors for the remainder
of that day as they went about their typical activities. Sensors were collected by a research team member on a
later date. Next, infants were fitted with an EEG cap based on head measurements taken at the beginning of each
session. After fitting the cap, grommets were filled with water-based gel (Signa Gel, Fairfield, New Jersey, USA)
before electrodes were secured into place. Electrode offset-values were under 20 kΩ using the ActiView acquisi-
tion software (version 7.05, BioSemi, Netherlands). EEG data were recorded using a Biosemi system (BioSemi,
Netherlands) with 32-electrodes at a sampling rate of 2048 Hz with a time-synchronized web camera integrated
using the MotionMonitor software (version 9.18, Innovative Sports Training Inc., Chicago, IL, USA). Addition-
ally, a video camera (Sony Handycam, New York, NY, USA) on a tripod recorded the session from the opposite
side from the web camera. The first three trials were 20-s resting state baseline trials, followed by a minimum
of nine 20-s reaching trials, and followed by three 20-s baseline trials. During baseline trials, a researcher pre-
sented a glowing globe toy beyond the infant’s reach to attract to attract their visual attention and minimize body
movements. During reaching trials, the researcher presented a toy, within reach and at midline, encouraging the
infant to reach for the toy. After a successful reach, the researcher allowed the infant to play with the toy briefly
and then retrieved the toy to present it again. This was repeated throughout the duration of the reaching tri-
als. EEG data during reaching trials are not presented here. The purpose of the present study was to investigate
EEG data during resting state in infants born preterm. Following the EEG session, we administered the BSID-
III12, and took anthropometric measurements (see Table 4). The BSID-III includes the assessment of cognitive,
language, and motor development. This was administered by a research team member and took approximately
25–30 min to complete per visit.
Group months 9 and 10 contained 1 dataset, thus minimum and maximum are the same values. Age are in
days adjusted for premature birth. Fine motor scores (FMS) and gross motor scores (GMS) are raw scores from
the fine and gross motor section of the Bayley Scales of Infant Development—III.
Behavior coding. We used the synchronized video to identify undesired behaviors during the baseline tri-
als, which would allow us to remove the corresponding EEG segments. This allowed us to process EEG data
that reflected a baseline (resting-state) condition. Undesired behaviors included movements that represented
fussiness such as repeated arm, leg, and trunk movements, and movements of the head and body that caused
artifacts in the EEG data. Additionally, research team member assessed the reaching skill level at each session to
assign one of four reaching skill levels for each infant (1 = no reaching; 2 = low skill, moves arm towards toy with
no grasp; 3 = medium skill, moves arm towards toy with indirect path, pre-shaped hand without grasp; 4 = high
skill, moves arm directly towards toy and grasps with pre-shaped hand.
EEG preprocessing. The Biosemi system automatically references each electrode to the common mode
sense (CMS) active electrode, and common mode information exists in the recorded signals. EEG data were
re-referenced to the average of T7 and T8 electrodes based on the international 10–20 system. This re-reference
steps helps complete the systems’ full 80 dB common-mode rejection ratio (CMRR). Next, to remove direct cur-
rent off-set and interference from high frequency components (e.g. powerline noise etc.), we employed a band-
pass infinite impulse filter (0.3–30 Hz) to the re-referenced data. We selected this frequency range to include
infant alpha activities within 6–9 Hz, while reducing effects from other sources. Next, segments with large fluc-
tuations were visually identified and the corresponding times were noted for each session. We then merged these
times with the time segments of the undesired behaviors from the aforementioned behavior coding to construct
Scientific Reports | (2021) 11:3609 | https://doi.org/10.1038/s41598-021-82329-7 10
Vol:.(1234567890)www.nature.com/scientificreports/
Head FMS (raw GMS (raw
Age (days) Weight (kg) Length (cm) Circumference (cm) score) score)
Group (number of sessions) Min Max Min Max Min Max Min Max Min Max Min Max
Month 2 (4) 56 74 4.65 6.1 52 58 36.5 39.5 6 8 8 9
Month 3 (8) 84 111 5.15 6.4 55.5 60 38.5 40.5 5 12 11 16
Month 4 (7) 122 139 5.84 7.83 60 63 39.5 43.5 10 18 13 20
Month 5 (7) 142 167 5.84 8.52 59 65 40.5 44 7 17 14 27
Month 6 (5) 170 195 6.7 8.84 63 69 41 45.5 8 18 16 20
Month 7 (2) 196 211 6.32 8.56 64 70 41.5 46 17 20 22 26
Month 8 (2) 233 245 7.15 9.71 65 72 43 47.25 20 21 17 29
Month 9 (1) 260 260 7.6 7.6 66.5 66.5 44 44 20 20 16 16
Month 10 (1) 295 295 7.7 7.7 69 69 44 44 22 22 23 23
All (37) 56 295 4.65 9.71 52 72 36.5 47.25 5 22 8 29
Table 4. Participant characteristics grouped by month and shown as minimum and maximum values for each
measurement. Group months 9 and 10 contained 1 dataset, thus minimum and maximum are the same values.
Age are in days adjusted for premature birth. Fine motor scores (FMS) and gross motor scores (GMS) are raw
scores from the fine and gross motor section of the Bayley Scales of Infant Development— III.
a table of start and end times for each unwanted segment identified. Using EEGLAB, we removed these segments
from the EEG time series and concatenated the remaining segments for subsequent analyses. After bad segment
rejection, the range of EEG data was between 12.4 and 94.8 s, with a mean duration of 47.6 s and a standard devi-
ation of 22.3 s. Next, Kurtosis indices were calculated for all electrodes. Electrodes with Kurtosis indices beyond
the five standard deviations of all electrodes were noted and rejected. The data from the rejected electrode(s)
were interpolated by the average of surrounding electrodes. Next, we applied a common average reference by re-
referencing each electrode to the average of all electrodes to spatially filter out common-mode artifacts. Finally,
an independent component analysis, using EEGLAB’s runica was used to decompose EEG data into independent
components (IC) from brain sources and unwanted artifacts. Components caused by eye movements, electrocar-
diography, and motion artifacts were visually identified and removed from further analyses. With a total of 32
possible ICA components, a minimum of 10 and a maximum of 29, with an average of 22.38 ± 5.37 components
were rejected. Each IC was closely examined by inspecting the temporal, spectral, and spatial patterns. All pre-
processing steps were performed using the MATLAB-based toolbox EEGLAB v13 s oftware21.
Spectral analysis (relative power in the alpha band). To study changes across time in alpha activities
from infant EEG, we calculated power spectral densities (PSD) using Welch’s method, or “pwelch” function in
MATLAB (ver. 2019a, MathWorks Inc., Natick, MA., USA). For PSD estimation, we chose a 2-s Hann window
with a 50% overlap between segments. This resulted in a frequency resolution of 0.5 Hz to capture the changes
in spectral activities in our EEG data. We then transformed PSDs into relative powers to allow for comparisons
across sessions. To calculate relative power, we divided PSD by the sum PSD from all bins for each frequency
bin within 0 and 30 Hz and each electrode. Alpha band powers from motor cortices were calculated for each
session by averaging activities from electrodes C3, C4, and Cz, and summing the relative powers of all bins
within 6–9 Hz. To provide a qualitative view of changes along age, sessions with the same monthly age were
grouped and their alpha activities from the motor cortices were averaged. Additionally, to examine develop-
mental changes of alpha activities in the spatial domain, we constructed topography plots by registering the
monthly-averaged alpha band powers from each electrode to their geodesic locations on the scalp. These maps
were visually inspected to determine any developmental trends based on age.
Connectivity analysis (coherence). To study the changes in the alpha activities between brain regions,
we evaluated connectivity which was based on the coherence values between electrode pairs. Coherence values
were calculated using the mscohere function in EEGLAB/MATLAB. This function is based on Welch’s method to
SD22.
estimate PSD for each electrode of each electrode pair as well as cross-electrode P
2
PSDE1E2 f
(1)
CohE1E2 f =
PSDE1 f × PSDE2 f
CohE1E2(f) is the magnitude-squared coherence between electrode E1 and E2 at frequency f. PSDE1 and PSDE2
are the corresponding PSD estimations, and PSDE1E2 are the cross-electrode PSD estimation. Hann window with
a length of 2 s and 50% overlap were chosen in the PSD estimation to maintain consistency with our spectral
analysis. Mean alpha coherence was defined as the average of coherences from all bins within 6–9 Hz. A total
of 18 pairs of electrodes were chosen to examine changes in connectivity across the functional brain regions,
including frontal, motor, and parietal cortices (see Table 2 for list of pairs). These pairs were chosen based on
our group’s previous s tudy11 which investigated the same electrode pairs and brain regions.
Scientific Reports | (2021) 11:3609 | https://doi.org/10.1038/s41598-021-82329-7 11
Vol.:(0123456789)www.nature.com/scientificreports/
Comparison of variance in developmental heterogeneity. To demonstrate the difference in vari-
ability between infants with TD and born preterm, participants with more than two visits were identified and
subject to the following analysis. For the TD group, we used the same dataset as our previous study investigating
the neuromotor development of infants with typical d evelopment11. The dataset contains 71 EEG recording ses-
sions from 21 participants between the age of 1 to 7 months. After removing single-session participants, there
were 10 participants left in infants born preterm and 18 participants left in the TD group. Linear fitting of motor
alpha band power against age was performed within each participant across their respective visits. To quantify
the variation of developmental trajectories, we first extracted gradient, intercept, and fitting error for each fitted
line. Then, the variances of these metrics were calculated to evaluate various aspects of the developmental het-
erogeneity in both groups. The gradient represents the rate of change in motor alpha band power as a function of
age, so its variance captures the variation in alpha power progression among individuals. Similarly, variance of
intercepts represents cross-individual variability at baseline time. Fitting error represents the vertical deviations
from each datapoint to the fitted line. Thus, its variance accounts for within-individual developmental fluctua-
tions along age. With these three metrics, we can describe developmental heterogeneity in our sample of infants
born preterm and subsequently compare it with the TD group.
Statistical analyses. Relative power. To test if relative power of the alpha band increased as reaching
skill emerged in infants born preterm, we employed a Pearson correlation test between relative power and age
(p < 0.05). Since there were multiple samples from the same participants, we employed a likelihood ratio test
by constructing two linear mixed-effects model (LMM) to address the non-independency within the grouping
factor (participants). One model with and another without subject variation as a random effect were compared.
This comparison informed us regarding the impact of subject variation in our dataset. A significant difference
in this comparison would indicate that this relationship is not as informative due to repeated measures from the
same participants.
To further validate the relationship between alpha band power and age discovered under a limited sample
size, we took a bootstrapping approach to establish a null distribution of correlations between randomly gener-
ated motor alpha band power and age. Specifically, frequency bins between 0 and 30 Hz were randomly shuffled
100 times. After each shuffle a pseudo-alpha power were calculated and correlated to age, thus producing 100
correlation coefficients. These correlations were then compared to our true correlation between motor alpha
band power and age. This comparison tests the motor alpha-band specific correlation with age in our sample of
infants born preterm against random.
Brain connectivity (coherence). To examine if changes in coherence values had a significant relationship with
age and motor development scores, we used a Pearson correlation test. We tested the correlation of mean alpha
coherence from each of the 18 electrode pairs against age and motor development scores (reaching skill scores,
BSID-III raw fine motor subscale scores, BSID-III raw gross motor subscale score). We included age and three
measures of motor skill as we expected all of them would be related (they are not independent measures) and we
wanted to examine which relationships were stronger. Infants develop at different rates; thus, infants of the same
age are typically different points in terms of their reaching skill and/or overall motor development. If coherence
values are related to neuromotor development, then we would expect a stronger relationship between coher-
ence values and measures of motor skill than we would between coherence values and age. Finally, there were
repeated measures from most of our participants, making simple linear regression not appropriate. Thus, we
employed the LMM to model the relationship between coherence and predictors (age and motor development
scores). Separate LMM models were created for each predictor as they possessed unique intrinsic characteristics
(Eqs. 2–5). A significant difference in these two models would indicate that the predictor plays a role in its rela-
tionship with coherence, whereas a non-significant difference indicates that the predictor does not play a role in
its relationship with coherence.
(2)
Coh ∼ Age + 1|Participant + ε
(3)
Coh ∼ Reaching Skill Level + 1 + Reaching Skill Level|Participant + ε
(4)
Coh ∼ FMS + 1 + FMS|Participant + ε
(5)
Coh ∼ GMS + 1 + GMS|Participant + ε
Coh represents the mean alpha coherence; Age represents adjusted age in days at the time of visit; Reaching
Skill Level, FMS (fine motor scores), and GMS (gross motor scores) denote the motor developmental scores. The
equations were expressed in Wilkinson notation. ε is the error term. (1|Participant) refers to the random inter-
cepts within the grouping factor (participants) to account for repeated measures, which was added in all equa-
tions. For Reaching Skill Level, FMS, and GMS, the random slope terms were also added to account for individual
progression variance of these metrics presented in the grouping factor (participants), as shown in Eqs. (3–5).
To test if predictors presented a significant effect on the changes of coherence, likelihood ratio tests were
performed on two LMM models for each predictor. This was achieved by removing the targeted predictor from
the original model as null models and comparing their goodness of fit to the original equation (Eqs. (2–5)). A
significant difference in these two models would indicate that the predictor plays a role in its relationship with
coherence, whereas a non-significant difference indicates that the predictor does not play a role in its relationship
Scientific Reports | (2021) 11:3609 | https://doi.org/10.1038/s41598-021-82329-7 12
Vol:.(1234567890)www.nature.com/scientificreports/
with coherence. For both Pearson correlation tests and likelihood ratio tests, significance level was set at 0.05 and
was adjusted using the Bonferroni correction for multiple comparisons (i.e. 0.05/18). For predictors, age and fine
and gross motor scores, scatter plots with least-squares fitted lines were created to show the changing trends and
correlation coefficients were calculated to quantify the relationship with mean alpha coherence for each electrode
pair. Due to sparse sample points, bar plots with standard deviation were chosen to present changes in mean
alpha coherence across the different reaching skill levels.
Received: 15 October 2020; Accepted: 19 January 2021
References
1. Saigal, S. & Doyle, L. W. An overview of mortality and sequelae of preterm birth from infancy to adulthood. Lancet 371, 261–269
(2008).
2. Huddy, C. L. J., Johnson, A. & Hope, P. L. Educational and behavioural problems in babies of 32–35 weeks gestation. Arch. Dis.
Child. https://doi.org/10.1136/fn.85.1.f23 (2001).
3. Holt, R. L. & Mikati, M. A. Care for child development: Basic science rationale and effects of interventions. Pediatr. Neurol. 44,
239–253 (2011).
4. Spittle, A. J., Orton, J., Anderson, P., Boyd, R. & Doyle, L. Early developmental intervention programs post hospital discharge to
prevent motor and cognitive impairments in preterm infants. Cochrane Database Syst. Rev. 1, 1–56 (2015).
5. Darrah, J., Piper, M. & Watt, M.-J. Assessment of gross motor skills of at-risk infants: Predictive validity of the Alberta Infant Motor
Scale. Dev. Med. Child. Neurol. 40, 485–491 (1998).
6. Darrah, J., Redfern, L., Maguire, T. O., Beaulne, A. P. & Watt, J. Intra-individual stability of rate of gross motor development in
full-term infants. Early Hum. Dev. 52, 169–179 (1998).
7. Bosanquet, M., Copeland, L., Ware, R. & Boyd, R. A systematic review of tests to predict cerebral palsy in young children. Dev.
Med. Child. Neurol. 55, 418–426 (2013).
8. Spittle, A. J. et al. General movements in very preterm children and neurodevelopment at 2 and 4 years. Pediatrics https://doi.
org/10.1542/peds.2013-0177 (2013).
9. Van Elk, M., van Schie, H. T., Hunnius, S., Vesper, C. & Bekkering, H. You’ll never crawl alone: Neurophysiological evidence for
experience-dependent motor resonance in infancy. Neuroimage 43, 808–814 (2008).
10. Xiao, R. et al. Characterization of infant mu rhythm immediately before crawling: A high-resolution EEG study. Neuroimage 146,
47–57 (2017).
11. Xiao, R., Shida-Tokeshi, J., Vanderbilt, D. L. & Smith, B. A. Electroencephalography power and coherence changes with age and
motor skill development across the first half year of life. PLoS ONE 13, 1–17 (2018).
12. Bayley, N. Bayley Scales of Infant and Toddler Development (Pearson, London, 2006).
13. Bell, M. A. & Fox, N. A. Crawling experience is related to changes in cortical organization during infancy: Evidence from EEG
coherence. Dev. Psychobiol. 29, 551–561 (1996).
14. Corbetta, D., Friedman, D. R. & Bell, M. A. Brain reorganization as a function of walking experience in 12-month-old infants:
Implications for the development of manual laterality. Front. Psychol. 5, 1–10 (2014).
15. Gonzalez, S. L., Reeb-Sutherland, B. C. & Nelson, E. L. Quantifying motor experience in the infant brain: EEG power, coherence,
and mu desynchronization. Front. Psychol. 7, 1–6 (2016).
16. Niemarkt, H. J. et al. Maturational changes in automated EEG spectral power analysis in preterm infants. Pediatr. Res. 70, 529–534
(2011).
17. Suppiej, A. et al. Spectral analysis highlight developmental EEG changes in preterm infants without overt brain damage. Neurosci.
Lett. 649, 112–115 (2017).
18. Pivik, R. T. et al. Guidelines for the recording and quantitative analysis of electroencephalographic activity in research contexts.
Psychophysiology 30, 547–558 (1993).
19. Bringas Vega, M. L., Nunez, P., Riera, J., Zhang, R. & Valdes-Sosa, P. A. Editorial: Through a glass, darkly: The influence of the EEG
reference on inference about brain function and disorders. Psychophysiology https://doi.org/10.3389/fnins.2019.01341 (2019).
20. Yao, D. A method to standardize a reference of scalp EEG recordings to a point at infinity. Physiol. Meas. 22, 693–711 (2001).
21. Delorme, A. & Makeig, S. EEGLAB: An open source toolbox for analysis of single-trial EEG dynamics including independent
component analysis. J. Neurosci. Methods 134, 9–21 (2004).
22. Welch, P. D. The use of fast fourier transform for the estimation of power spectra: A method based on time averaging over short,
modified periodograms. IEEE Trans. Audio Electroacoust. 15, 70–73 (1967).
Acknowledgements
The authors would like to thank the infants and families who participated in our study, and Katy Kelley, Carolina
Panceri, Judy Zhou, and Dana Fine for assisting with recruitment and data collection.
Author contributions
B.S. and D.V. contributed to the conception and design of the work. B.S., D.V., R.N., and R.X. contributed to the
analysis and interpretation of the data. R.N. drafted the work. B.S., D.V., R.N., and R.X. revised the work and
have approved the submitted version.
Funding
Research reported in this publication was supported by the Eunice Kennedy Shriver National Institute of Child
Health & Human Development of the National Institutes of Health under Award Number R03HD096137 (PI:
Smith). The content is solely the responsibility of the authors and does not necessarily represent the official views
of the National Institutes of Health.
Competing interests
The authors declare no competing interests.
Additional information
Correspondence and requests for materials should be addressed to R.N.
Scientific Reports | (2021) 11:3609 | https://doi.org/10.1038/s41598-021-82329-7 13
Vol.:(0123456789)You can also read