1196 Banking of Surplus Emissions Allowances Does the Volume Matter? - DIW Berlin
←
→
Page content transcription
If your browser does not render page correctly, please read the page content below
1196
Discussion
Papers

Deutsches Institut für Wirtschaftsforschung                                       2012

Banking of Surplus Emissions
Allowances
Does the Volume Matter?

Karsten Neuhoff, Anne Schopp, Rodney Boyd, Kateryna Stelmakh and Alexander Vasa
Opinions expressed in this paper are those of the author(s) and do not necessarily reflect views of the institute.

IMPRESSUM

© DIW Berlin, 2012

DIW Berlin
German Institute for Economic Research
Mohrenstr. 58
10117 Berlin

Tel. +49 (30) 897 89-0
Fax +49 (30) 897 89-200
http://www.diw.de

ISSN print edition 1433-0210
ISSN electronic edition 1619-4535

Papers can be downloaded free of charge from the DIW Berlin website:
http://www.diw.de/discussionpapers

Discussion Papers of DIW Berlin are indexed in RePEc and SSRN:
http://ideas.repec.org/s/diw/diwwpp.html
http://www.ssrn.com/link/DIW-Berlin-German-Inst-Econ-Res.html
Banking of surplus emissions allowances
                            – does the volume matter?

                     Karsten Neuhoff1, Anne Schopp1, Rodney Boyd2,
                          Kateryna Stelmakh2, Alexander Vasa2

                                             March 8, 2012

       In the European Emission Trading scheme the supply of allowances exceeds
       emissions – cumulating, according to our estimates, in a surplus of 2.7 billion
       tonnes by 2013/2014. We find that initially the surplus was acquired by power
       companies so as to hedge future carbon costs. As the surplus exceeds this hedging
       demand, additional allowances need to be acquired as speculative investment.
       This requires higher rates of return and implies that expected future carbon prices
       are highly discounted. This could explain the recent drop in carbon prices. The
       analysis shows that the volume of unused allowances matters for the discount
       applied to future carbon prices. We use our supply-demand framework to assess
       currently discussed policy options set-aside, reserve price for auctions and
       adjustments of emission targets.

       Key words: European emission trading scheme; banking; discount rates
       JEL classifications: G18; Q48

1
Deutsches Institut für Wirtschaftsforschung Berlin (DIW), Corresponding author: kneuhoff@diw.de
2
Climate Policy Initiative Berlin (CPI)
Banking of emissions allowances – does the volume matter? March 2012
1. Introduction
The supply of allowances has exceeded emissions in Phase II from 2008 to 2012 in the European
emission trading scheme (EU ETS). We estimate this surplus of allowances will rise to 2.7 billion tonnes
by 2013. Despite the volume of unused allowances, the carbon price has not fallen to zero, and remained
in the order of 10-15 €/tCO2 between 2009 and summer 2011. This is largely because market participants
by then expected a future scarcity of allowances. Accordingly, these participants banked unused
allowances for use in future years. As a result of banking, the current carbon price is often interpreted as
an indicator for the stringency of European emission reduction targets till 2020 and beyond.
In late 2011, the current carbon price for spot and year-ahead contracts fell to below 7 €/t. This has been
interpreted as an indication that market participants have lower expectations about future scarcity in the
EU ETS. Such lower scarcity could result from lower current and projected emissions that are
consequences of recent economic developments, and policy developments such as the EU Energy
Efficiency Directive and EU Renewables Directive.
This paper offers an additional interpretation: the carbon price dropped because the volume of unused
allowances increased beyond the need of market participants to hedge their carbon costs for future power
and industrial production. Therefore additional investors are needed to bank allowances on speculative
basis. They require high returns for such speculative investments and can only secure such returns, if the
allowances prices are highly discounted relative to expected future prices. Thus the carbon price dropped
until it reflected such a high discount.
Whether the drop in carbon prices reflects changing expectations about future carbon prices, or reflects
higher discounts applied to these expectation matters for public and private decision makers. Carbon
allowances are only actively traded for a couple of years, thus the associated carbon prices inform the
strategy and investment choices of companies (Martin, Muûls et al. 2011) and also are used as reference
price for public policy decisions. If future carbon prices are highly discounted, but decision makers do not
consider this discount applied, then the accompanying efforts to decarbonize through low-carbon
investment might be insufficient and inefficient.
In order to pursue our hypothesis that the drop in carbon price is due to increased discount rates applied
to future carbon prices and whether the volume of banking matters, we pursued semi-structured
interviews with power, industry and finance sector actors between November 2011 and January 2012,
and undertook a bottom-up quantification of the supply and demand of allowances in the EU ETS. Based
on this we identified the following main actors, their banking strategy and factors that impact on their
banking strategy:
The power sector banks allowances to hedge power sales, typically selling power one to four
years ahead of production and securing costs for fuels and carbon at the same time. We estimate
for 2012 that the power sector has the flexibility to bank between 0.5 to 1.8 billion emission
allowances. The flexibility results from the portfolio of different generation technologies each
generator owns: if a generator sells, for example, about 15% of production three years ahead of
time, then the generator can either hedge the power production by allocating the production to a
coal plant and thus include a carbon hedge, or allocate the production to a non-fossil plant
without the need to hedge carbon.
Page 2Banking of emissions allowances – does the volume matter? March 2012
Industrial actors likely banked a few hundred million freely allocated allowances that were not
needed to cover their annual emissions. While some companies reported that they directly sold
this surplus, others told they sold all unused allowances not required to cover emissions in the
next few years with an increasing clarity about the volume of free allocation of allowances post
2012.
Banks reported that they do acquire allowances, but do not hold these as speculative
investments. Instead they combine sales of future, forward and option contracts to the same
volume of acquired allowances. As they are not exposed to carbon price risk, their return
expectations are in the order of 5%. The derivative contracts issued by banks are in turn used, for
example, by power companies to hedge their future power sales. The allowances held by banks
therefore do not increase the total volume of allowances banked in the emission trading scheme.
Small-scale speculative investments in allowances to arbitrage price changes over short time
periods have been continuously pursued by market participants. However, interview partners
across the different sectors could not point to actors that have pursued such speculative
investments over longer periods. Some interviewees indicated that industrial players with strong
balance sheets might use the opportunity of low carbon prices (especially at the end of 2011) to
acquire additional allowances. It was frequently reported that financial investors, in principle,
would be prepared to pursue speculative investments in carbon if rates of return exceed 10 or
15%. This is consistent with evidence we find from other commodity markets in which similar
rates of return are required by speculative investors.
Across all sectors, interview partners made a clear distinction between banking of allowances for hedging
purposes and as speculative investment. This implies that once the hedging needs for allowances are
exhausted, the rates of return required and therefore the discounting of future carbon prices increase from
5% to levels exceeding 10-15%.
This step change of discounting of future carbon prices has not been previously identified in the literature.
To the contrary, the literature consistently postulates fixed and relatively low discount rates for carbon
prices. Under this assumption several studies show that banking provides companies with inter-temporal
flexibility in their investment choices and thus decreases overall mitigation costs (see Annex A).
Thus, we answer the question raised with the title of the paper: whether the volume of surplus allowances
matters for discounting of future carbon prices. According to our quantification, the increasing supply of
allowances exceeded the hedging demand by 2011, and could explain the drop in the carbon price at the
end of 2011. However, within the uncertainties of our analysis, it would also be possible that the hedging
demand is only exceeded during 2012 and that the drop in carbon prices during 2011 reflects lower
expectations about future carbon prices. Irrespective of the precise time when the high discounting starts,
in the next few years a high discounting will be applied by actors to future carbon prices. Over the longer-
term, other investors might be attracted to investment in allowances beyond hedging needs at lower
discount rates.
Our analysis has two policy implications:
The scale of policy interventions to reduce the surplus of allowances can be informed by the
analytic framework provided in this paper. According to our calculations, the proposed 1.4 billion
set-aside of allowances (Environment Committee of the European Parliament 2011) would
reduce the volume of unused allowances such that it can be met by hedging needs and allow for
Page 3Banking of emissions allowances – does the volume matter? March 2012
banking at low discount rates. Given uncertainties in emission trajectories and evolving hedging
needs, a smaller set-aside increases the risk of reverting to a situation where speculative
investments are required to meet the volume of unused allowances.
A set-aside on its own only reduces the discounting applied to future carbon prices. Therefore,
the set-aside needs to be combined with a process to review, and if necessary, strengthen
emission targets post 2020. In this process, a clear strategy for the future use of allowances
retained from the market under the set aside needs to be formulated. Furthermore, the recent
experience with quickly changing emission patterns raise concerns how to appropriately design
emission trading schemes to cope with such uncertainties (Grubb 2012) A reserve price for
allowance auctions in Phase IV (from 2020) could avoid the future risk of very low carbon prices.
In the following, Section 2 quantifies the surplus of allowances in the EU ETS. Section 3 examines the
power, industry and finance actors and their required incentives to bank these unused allowances.
Section 4 quantifies the supply-demand balance of allowances. Section 5 applies the supply-demand
balance of allowances to different policy interventions, so as to strengthen the European emission trading
scheme. Section 5 summarizes the main findings of the analysis.
2. The evolution of EU ETS surplus
Since 2008, a surplus of allowances in the EU ETS has accumulated and is expected to increase further
(Figure 1). The surplus results in part from the financial and economic crisis, since industrial production,
energy consumption and therefore carbon emissions fell below expectations at the time the emissions
cap was set. The supply of emissions allowances has consequently exceeded the carbon emissions
covered under the ETS.
Not all allowances are provided for free to the ETS participants, but enter the carbon market through
auctions. Since several auctions of Phase II (2008-2012) and Phase III (2013-2020) allowances take
place between 2011 and 2013, the volume of unused allowances further increases in these years. In
particular, it is estimated that 144 to 350 million unused allowances reserved for new entrants in Phase II
are auctioned in 2012. Also 300 million allowances reserved in Phase III to finance technology will be
supplied into the market in 2012 and 2013. Finally, 120 million Phase III allowances will already be
auctioned in 2012.
Additional supply of allowances derives from the import of international offset credits into the EU ETS. We
estimate that the majority of credits from Clean Development Mechanism (CDM) and Joint
Implementation (JI) projects are imported by 2012/2013. As a result, the import quota of 1.68 billion
tonnes is expected to be achieved by 2013/2014. This estimate of credits is based on project
documentation linked to EU buyers (see Annex B for details on the methodology).
Page 4Banking of emissions allowances – does the volume matter? March 2012
Figure 1: Cumulative surplus of allowances in Phase II and Phase III in EU ETS
Sources: European Parliament and Council (2009); IGES (2011); UNEP Risoe (2011); CITL (2011); European
Commission (2011)
Our analysis suggests that the cumulative surplus of allowances will continue to grow; peaking at 2.7
billion tonnes in 2013 or 2014 before falling slowly at a rate which depends on the future emission
trajectory. After quantifying the volume of allowances not used to cover emissions, we investigate who
buys these unused allowances and their reasons for doing so.
3. The demand for surplus of allowances
A positive carbon price suggests that a demand exists to hold unused emissions allowances for later use
in future years (banking). Comparable to other commodities, there are three main reasons for banking
allowances:
Arbitrage: to buy allowances and simultaneously sell forward, future or option contracts, so as to
avoid exposure to carbon price risk. This requires capital to buy and keep the allowances. In
recent years, front-year contracts for 2011 were traded at about 3-5% discount below 2012
contracts, and contracts for 2012 at 7% premium below 2013 contracts (see Annex C).
Hedging: to hold allowances to meet future needs of carbon as an input to the production
process, and thus avoid the exposure to carbon price risk. In particular the power sector is
reluctant to hold allowances to meet all future demand, as this binds capital. It therefore uses
financial contracts offered by arbitrageurs to hedge ahead. Interviews with power, industry and
finance actors confirmed discounts of future prices are applied in the order of 5% per year.
Speculation: to take an open position in allowances, carrying the carbon price risk in expectation
that the carbon price will rise. Since speculative buyers of allowances carry more risk, they
generally require higher rates of return than hedging buyers. Experiences from other commodity
Page 5Banking of emissions allowances – does the volume matter? March 2012
markets suggest that speculative buyers generally expect returns in the range of 10-15% per
annum (see Annex A).
Thus, if all unused allowances are kept for hedging purposes with return requirements of 5% per year, an
expected price of, for example, 25 €/t for 2020 implies a carbon price of 17 €/t in 2012. However, if
unused allowances exceed hedging demand, the discount could rise significantly, as the marginal buyer
shifts from hedgers to speculators. For example, the carbon price has to appreciate by 10-15% year-on-
year in order to attract speculative investment, and then an expected carbon price of 25 €/t in 2020 infers
a carbon price of 8-10 €/t in 2012.
In the above calculations, we assumed the price of 25 €/t for 2020 to illustrate the impact of discounting,
but this is not based on own modeling. If by 2020 a large volume of unused allowances remains in the
ETS, then we anticipate that there will be continued need for speculative investors. This results in a
continuation of high discounting of future carbon prices. In this case current carbon prices are likely to be
lower.
We have identified three principle actors that bank allowances: power generators, industry and financial
investors. In the following we characterize their different incentives and strategies to bank, and then
quantify the demand for banking unused EU ETS allowances.
Power generators
Power generators are the largest group participating in the ETS. Power generators sell a significant share
of power one to four years ahead of delivery. To manage the price risk, contracts are signed in parallel for
fuel and carbon input required for generating the power.
Until 2012 power generators receive most of their allowances for free and thus did not need to hedge the
carbon required for future power sales. After 2012, power generators no longer receive allowances for
free and therefore need to hedge the price for acquiring these allowances. Many of new EU Member
States are planning to use a provision in the EU ETS Directive (European Commission 2011) that allows
for continued free allocation of allowances to existing power stations. Therefore, we do not assume a
hedging demand by these power generators. As there are smaller shares of power sold on longer-term
basis in new Member States, the overall hedging demand is only reduced from 2.1 to 1.8 billion tonnes in
2012.
Power generators thus hold allowances beyond compliance needs to hedge carbon for future use. They
have some flexibility on the amount of hedging. In the interviews two main factors were reported to have
influenced their choice of hedging volume (see Annex C for further detail):
Carbon price expectations. With higher carbon prices, generators will, assuming all other factors are
unchanged, shift towards less carbon-intensive generation technologies. This reduces the overall demand
for hedging, thus decreasing the demand for allowances and mitigating some of the carbon price
increase. We did not model this effect, as in recent years the carbon price was usually significantly below
the price that would, for example, motivate a shift from coal to gas as base-load generation.
Energy portfolio optimisation. Even with a fixed plan on the future use of the generation portfolio,
power generators have some flexibility for the implementation of their hedging strategy if, as is the case
across major European utilities, they produce with a portfolio of different generation technologies. For
example, should power generators sell 15% of power three years ahead of time, then they can decide
whether to allocate these sales to a carbon-intensive generation asset and thus to acquire the
Page 6Banking of emissions allowances – does the volume matter? March 2012
corresponding carbon hedge, or allocate them to non-fossil generation sources requiring less hedging of
carbon.
Based on the analysis of nine leading European power generators we calculated the ‘hedging corridor’:
the minimum and maximum volume of allowances that can be used for hedging power sales in Europe –
see Figure 3 below. The analysis suggests a potential hedging demand of 0.5 to 1.8 billion allowances in
2012.
In the interviews it was reported, that power companies do not invest in significant amounts of allowances
beyond the hedging need.
Industry actors
Industry actors received 569 million free allowances over what they needed to cover emissions between
2008 and 2010. This raises the question as to whether industrial emitters bank the unused allowances
they acquired, and if so, what banking strategies they applied. In the interviews, the following factors were
reported to have an impact on the banking strategy of companies:
Free allowances. Declining free allowance allocation creates an incentive to retain unused allowances to
reduce future exposure to uncertain carbon prices.
International Financial Reporting Standards (IFRS). IFRS allows firms to place a value on allowances
allocated for free at zero in their books. Profits are then reported in the quarter when allowances are sold
at market prices, or can be attributed to the production process when the zero valued allowances are
used as input. Thus, there is an incentive to hold allowances valued at zero to smooth when necessary
reported profits. However, the scope of using this opportunity might be limited. It was also mentioned, that
were the volume of allowances held exceeds the expected compliance needs, they would have to be
interpreted at speculative investment and valued at market prices.
Cash flow. Revenues declined with the economic downturn. Sales of unused allowances allow for quick
access to cash. Furthermore, where the credit rating of firms deteriorated, the opportunity costs of holding
allowances – measured by costs of borrowing money – increased for the firms, thus further encouraging
sales of unused allowances.
Hacking of registry accounts. In spring of 2011, online accounts of several companies were hacked
and allowances stolen. Companies subsequently implemented more stringent control procedures
including a centralised allowance pool at the EU level, where it was not already implemented. This
reduces the amount of unused allowances that are retained because of transaction costs, and reduces
the number of allowances that need to be retained to cover uncertainties in emission patterns.
Certified Emission Reduction (CER) – EU allowance (EUA) swap. Because of surplus allocation,
industry did not need CERs to cover emissions. However, they could use their import quota for taking
CERs into EU ETS in two ways: (i) By buying CERs that were traded at discounts of up to 3 €/t, using the
CER for compliance purpose, and selling the freely allocated EUA. Such a swap does not impact on the
volume of open banking pursued by industry, and; (ii) By swapping a fixed number, e.g. 10 EUAs against
11 CERs. This increases ownership of allowances, but was reported to be focused on direct compliance
needs. These activities did therefore not directly impact on the demand-supply balance.
Thresholds of stop-loss positions. As companies have become more active in the management of their
carbon assets, they have also started to apply standard risk management procedures. For example a
Page 7Banking of emissions allowances – does the volume matter? March 2012
stop-loss position limits the losses from declining prices of a commodity by requiring that a share of the
commodity will be sold should the price drop below a pre-defined threshold. Thus, some value of the
commodity is secured for the firm while at the same time, forgoing the opportunity to recover losses with
increasing prices.
Companies put different emphases on these factors, and differ in their overall sophistication in and
attitude towards commodity trading. As a result, their banking strategies also vary.
Blunt retention of unused allowances. Small companies are likely to retain the entire volume of unused
allowances to hedge uncertainty in future emissions and to avoid the need to buy additional allowances
for compliance needs.
Instant sale of unused allowances. The annual free allowance allocation is distributed across the
months of the year. Allowances that are not required to cover emissions of the month are sold in one of
the subsequent months. One major actor reported that this strategy has been pursued since Phase I.
Hedging. Companies coordinate their projected emissions with a combination of free allocation of EU
ETS allowances, CERs and other contracts. One company reported that the balancing of contracts of
appropriate maturity, and the clearing of any surplus, is pursued on two-year and five-year horizons. With
the clarification of benchmarks for free allowance allocation during 2011, uncertainties about future
allowance needs, and thus their hedging needs, declined.
Speculation. Some interview partners reported that the low carbon price end of 2011/early 2012 could
also have encouraged industry actors with strong balance sheets to invest in additional allowances for
future use.
The drivers for banking strategies point to a reduction of blunt banking and a shift towards instant sale of
unused allowances. Allowances are thus only retained where they allow for hedging future carbon costs.
As most, or in several instances all, carbon costs are covered for the next few years with the free
allocation under benchmarks, this implies a very small need to retain unused allowances. It is therefore
likely that only a fraction of the 569 million allowances is still held by industry.
Financial actors
Investing in allowances without hedging the price risk is not the usual business model of banks. Given the
historic volatility of the European carbon price, any bank that pursues such speculative investment has to
back the open positions with almost 100% of their own capital as regulated under Basel (European
Parliament and Council 2006). Banks prefer to leverage their own capital rather than backing risky
investments that require almost 100% of their own capital. It was reported in all interviews that banks do
not pursue significant volumes of speculative investment in EU ETS allowances.
Banks therefore primarily engage in the arbitrage of allowances. They buy allowances and simultaneously
sell forward, future or option contracts, so as to avoid exposure to carbon price risk. The main demand for
such financial contracts emerges from the power sector. If power companies use financial contracts as
part of the strategy to hedge carbon price risk of power sales, they do not need to use their own capital to
acquire and bank allowances. The demand from the financial sector to bank allowances for arbitrage
purposes is thus already accounted for in the power and industrial sector analysis.
Alternative financial actors that can pursue speculation are investment funds. Several interview partners
have suggested that funds might have pursued various investment strategies, including investing in
Page 8Banking of emissions allowances – does the volume matter? March 2012
carbon in a portfolio together with other assets that are negatively correlated with carbon, or pursuing
investments in allowances as part of a larger portfolio.
Based on the banking strategies of power, industry and finance actors, we quantify in the following the
demand-supply balance of emission allowances.
4. Quantification of demand-supply balance
In Figure 2 we compare the potential hedging demand against our estimate of allowance surpluses. Over
the last three years, hedging demand from power generators increased in line with the surplus. In
addition, industrial emitters have retained some of the unused allowances they received for free. In the
period 2008-2010 this accounted for 596 million allowances, of which we assume about half will have
been retained till 2011.
Figure 2: Hedging demand and surplus of allowances in Phase II and Phase III of EU ETS
Sources: European Parliament and Council (2009); IGES (2011); UNEP Risoe (2011); CITL (2011); European
Commission (2011); 2010 Annual Reports of 9 European utilities (E-on 2010; EDF 2010; EnBW 2010; ENEL 2010;
GDF Suez 2010; Iberdrola 2010; RWE 2010; Statkraft 2010; Vattenfall 2010), Eurelectric (2009); Eurostat (2011);
Point Carbon (2011); IPCC (2006).
One uncertainty results from the significant share of the volume of unused allowances attributed to
offsets. It was reported that in the early years many of these offsets credits (CERs) were not translated
into EU allowances (EUAs) so as to retain the flexibility for potential sale of CERs to other emission
trading schemes. These CERs might have been accounted for as speculative investment by a variety of
actors. Therefore, our estimate of unused allowances might have been slightly upward bias for the years
prior to 2011. With the falling prospects of global offset markets in 2011, and discussions on more
stringent EU requirements, these companies are reported to have accelerated the translation of CERs
into EU allowances.
According to this quantification, the volume of unused allowances that has accumulated in the EU ETS till
summer 2011 can be accounted for by actors that either retain unused allowances allocated for free, or
acquire new allowances as part of a hedging strategy. After 2011, however, a significant gap emerges
Page 9Banking of emissions allowances – does the volume matter? March 2012
between the volume of unused allowances and the hedging demand by power generators. For all
emission scenarios considered, this gap will remain positive through 2020.
If emissions evolve as projected in the current policy initiatives scenario used by the European
Commission in the impact assessment for the Roadmap 2050, the surplus of allowances exceeds the
maximum estimate of hedging demand by 0.9 billion in 2013. Uncertainties in emission trajectories, about
evolving hedging needs and uncertainties in our calculations need to be considered, and could imply that
this gap increases significantly.
With the framework of the supply-demand balance of allowances in the EU ETS at hand, we discuss next
the implications for policy interventions.
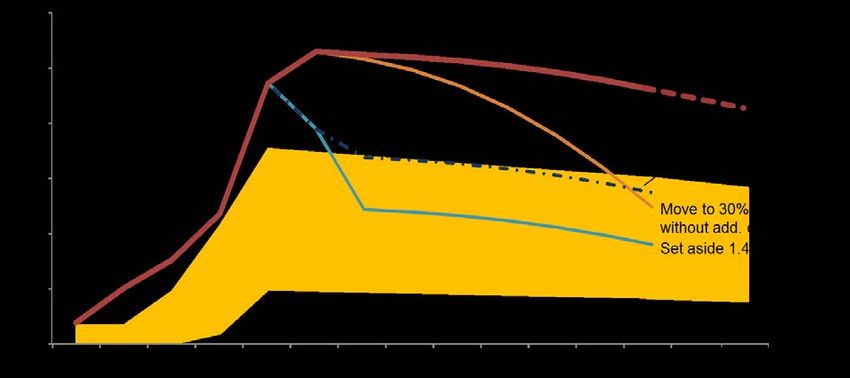
5. Implications for time and scale of policy interventions
Various policy interventions are discussed, so as to strengthen the EU ETS. These policy interventions
differ in their potential impact on surplus and carbon price expectation (Figure 3).
Figure 3: Potential impact of policy proposals on surplus
Sources: European Parliament and Council of the European Union 2009 (2009); IGES (2011); UNEP Risoe (2011);
CITL (2011); European Commission (2011); 2010 Annual Reports of 9 European utilities (E-on 2010; EDF 2010;
EnBW 2010; ENEL 2010; GDF Suez 2010; Iberdrola 2010; RWE 2010; Statkraft 2010; Vattenfall 2010);
Eurelectric (2009); Eurostat (2011); Point Carbon (2011); IPCC (2006).
Strengthening the 2020 target to 30%
Strengthening the 2020 emission reduction target from 20% to 30% would gradually reduce the surplus
under EU ETS by 1.2 billion tonnes. According to our projections therefore in the current policy initiative
scenario only by 2019 the volume of unused allowances will be reduced sufficiently, so that it can be met
by the demand of hedging buyers.
The EU ETS Directive envisaged that in the case of such a move, half of the additional emission
reductions requirements can be satisfied with offset credits. Given the significant volume of additional
CDM credits, this would imply that the total surplus would only be reduced by 0.6 billion tonnes.
Page 10Banking of emissions allowances – does the volume matter? March 2012
Strengthening of the 2020 target alone will not remove the need for speculative investment in allowances,
and therefore imply continued high discounting. To the extent that the tighter target will result in higher
expectations for 2020 prices, these will be translated to today’s prices, but at a high discount rate.
Set-side allowances
The Environmental Committee of the EU Parliament voted in December 2011 for a set aside of 1.4 billion
allowances from EU ETS. This would move the surplus of allowances into the range of hedging demand,
and would thus allow for hedging of allowances at lower return rates. What happens to retained
allowances, however, is crucial for long term carbon price expectations. Thus, questions that remain to be
resolved include:
What level of scarcity of EU allowances is expected post-2020? In other words, is the current
trajectory of the EU ETS cap declining at 1.74% per year compatible with the de-carbonization
roadmap to 2050 and the envisaged policies on energy efficiency and renewable energy?
Is there sufficient clarity on what happens to allowances in the set-aside (e.g.
retirement/cancellation) so as to avoid policy uncertainty about their possible early return to the
market?
Is the flexibility of hedging demand sufficiently large so that emission uncertainties can be
absorbed?
Reserve price in allowance auctions
In Phase III, about half of EU allowances will be auctioned. A reserve price for such auctions could reduce
supply until the cumulative surplus matches hedging demand. Due to the lower discounts applied in
hedging, the carbon price could then increase above the reserve price – assuming expectations about
future scarcity and prices are sufficiently high. This would require that allowances initially not auctioned
due to the reserve price are subsequently not returned to the market.
If the reserve price in the allowance auction reduces the cumulative surplus so that it matches the upper
end of the hedging corridor, then Figure 3 illustrates that the cumulative surplus will in subsequent years
remain at the margin of the hedging corridor. Therefore also carbon prices are likely to remain close to the
reserve price and the reserve price would de-facto prescribe a carbon price trajectory.
Often reserve prices are discussed with an alternative objective – not to prescribe a carbon price
trajectory but to avoid the risk of very low carbon prices. Thus, a reserve price could complement a set-
aside and ensure that if emissions again decline very drastically, the carbon price will not decline below
the reserve price. If a reserve price is implemented only for the Phase IV – but decided and backed by
government commitments in earlier years – it would not only set a minimum price level for Phase IV, but
would also serve as a reference that ‘defines’ a minimum prices for the later years of Phase III of EU ETS.
2030 target and trajectory
The EU ETS Directive outlines a linear reduction factor of the emissions cap by 1.74% per annum to be
continued beyond 2020. Strengthening this target would increase the long-term carbon price expectations
and the reward for banking allowances. However, as long as speculative investors would be required to
cover unused allowances during Phase II, the rates of return required given developments in the EU ETS
and financial markets are likely to be too high for long-term scarcity signals to have a strong impact on
current prices.
Page 11Banking of emissions allowances – does the volume matter? March 2012
The discussion of the policy options also points to benefits of their potential combination. A set-aside
could be combined with a clear process and credible steps towards a formulation of a 2030 vision and
roadmap, and its translation into policies and measures that are also reflected in a consistent emission
cap for 2030.
6. Conclusion
We have quantified how the supply of unused allowances under EU ETS is evolving over time. Despite
the surplus, a positive carbon price remained. Therefore we explore who is banking the allowances for
future use. We interviewed market participants to understand their objectives, strategies and constraints
in doing so, finding that they bank allowances either to hedge the input costs for future production or as a
speculative investment. In the hedging case, the discount applied to future carbon prices typically is in the
order of 5% reflecting opportunity costs of capital needed to acquire and retain the allowances. In the
speculative case, the required rates of return exceed 10-15%.
Our results differ from previous analysis of emission trading schemes which typically assumed that
banking between years is pursued at 3-5% discount rate. We argue that once the surplus of allowances
exceeds the hedging demand and thus discount rates applied to expected future, carbon prices jump. If
such high discount rates are applied, the emission trading scheme no longer meets the expectations
under which public and private actors have set-up and operate the scheme.
The limit to the scale of banking available at low discount rates was not considered in the discussion on
setting EU ETS caps during Phase II and Phase III. To the contrary, there was a strong emphasis on the
value of unlimited banking, reflecting the experience from Phase I of EU ETS, when a regulatory
constraint on banking resulted in a drop of carbon prices to zero at the end of Phase I. As the
understanding of the market constraints on banking was not present and therefore considered in the
design of the cap for Phase II and III of EU ETS, it could justify an intervention to correct for this
shortcoming. Market participants could be reassured that as this understanding is now generally present
that such a one-off intervention would not be repeated.
Our analysis implies, that for emission trading schemes the emission cap has to be formulated carefully,
so as to avoid the accumulation of very large surpluses. The analysis also suggests that an intervention to
reduce the surplus that is accumulating in EU ETS is necessary to avoid that future carbon prices are
highly discounted. The quantitative framework allows for an evaluation of the scale and timing of policy
options currently discussed to strengthen EU ETS.
The analysis did not assess the emissions cap post 2020 and how it impacts on expectations about future
scarcity. We also did not discuss the details of the implementation of any of the policy options, for early
intervention in EU ETS. In particular we did not asses the important question on whether and when
allowances retained with a set-aside or reserve price in the auction are returned to the market. These
would have to be clearly addressed to make these policy interventions effective – perhaps jointly with the
discussions on post 2020 emission caps.
Ultimately the confidence of market participants in EU ETS will be based on their assessment of the
consistency of potential short-term policy interventions and the long-term policy framework.
Page 12Banking of emissions allowances – does the volume matter? March 2012
Annex A. Literature Review
Intertemporal efficiency. Several studies suggest that under market uncertainty and asymmetric
information, allowing banking can lead to efficient outcomes since it provides companies with inter-
temporal flexibility in their investment choices and can decrease their overall mitigation costs (Phaneuf
and Requate 2002; Bosetti, Carraro et al. 2008). Bossetti and others (2008) also argue that banking
creates incentives for early adoption of low-carbon technologies and thus creates positive technology
spillover effects. Ex-post evaluation of banking in the SO2 US Acid Rain program provides evidence of
the efficiency of banking in this scheme. The authors assume – rather than deduce – discount rates
(3.5%) and compare different emission paths and abatement costs (Ellerman and Montero 2005).
Various impact assessments of the EU ETS projected 2020 prices of more than 30 EUR/tCO2. With
prices of 20 EUR/tCO2 in 2008, this implies discount rates of 3-5% (European Commission 2008;
Department of Energy and Climate Change 2009).
Empirical evidence. Another set of papers empirically explores the role of banking in the EU ETS.
Ellerman and Trotignon (2008) look at CITL surrender data on cross-border flows of allowances and find
that some banking occurred within Phase I (2005-2007). Alberola and Chevallier (2009) provide empirical
evidence for the negative impact of the banking restriction during Phase I and Phase II in the EU ETS on
low observed carbon prices.
Commodity markets. Experience from other commodity markets suggests that market participants only
bear the risk of holding a commodity if they are rewarded with a risk premium. Bessembinder (1992)
estimated the annual return investors require for bearing the risk at more than 10% for various
commodity markets. Wang (2001) performs similar calculations – using a slightly different metric to
determine whether speculators are short or long. Based on reported commitments to trade he calculated
investor sentiments. They reflect the aggregate position of hedgers, large and small speculators. Figure
A2 confirms the previous results that bearing the risk is rewarded with an annual premium exceeding 5%
and in most markets exceeding 10%. The example is based on market sentiment of large speculators and
four-week futures. Results for other maturities are similar.
Figure A1: Returns in future markets, 1993-2003
Annual return (%)
20
Annual return when speculators
15 are long
10
5
0
-5
-10
-15
-20
Annual return when speculators
-25 are short
-30
Soymeal
Soybeans
Corn
Agricultural
Cotton
Wheat
World sugar
portfolio
Source: Wang (2001). Note: conditional on large speculators’ sentiment above or below median
Page 13Banking of emissions allowances – does the volume matter? March 2012
Annex B - Building the demand-supply balance of allowances in the EU ETS
The calculations of the demand-supply balance of allowances in the EU ETS derive from the following
components:
EU Emissions Trading Scheme Cap
The emissions cap in Phase II (2008-2012) of the EU ETS is made up of allocations established in the
National Allocation Plans. These amount to 10.6 billion tCO2(equivalent) over the five year period and
thus 2.1 billion tCO2(e) per year.
In 2012, the inclusion of aviation will increase the cap by 10% of annual allocations (215 million tCO2(e)).
From 2013, the cap includes both aviation and new sectors, and decreases by 37 million tCO2(e) each
year until 2025, at which time the reduction in the cap is up for review.
New Entrant Reserve
In anticipation of new participants in the EU ETS, a New Entrant Reserve (NER) was created to meet new
demand for allowances. For the period 2008-2012, member states reserved approximately 5% of the total
allowance cap per year for new entrants (104 million tCO2(e) per year). In the years 2008-2010, only 16%
of the allowances from new entrant reserves were issued because of limited volumes of carbon-intensive
investment occurring in Europe. For our analysis, we assume that this trend will continue in 2011. Thus,
87 million allowances remain per year.
To account for member states that cancel auctioning of the NERs, we assume that 80% of these
remaining allowances are auctioned in 2012 (350 million tCO2(e)). However, this estimate is uncertain.
Tschach Solutions, for example, expect only 144 million allowances to be auctioned before 2013 (ref#).
The European Commission has allocated 300 million allowances from the New Entrant Reserve from the
period 2013-2020 to the European Investment Bank, so as to secure technology funding for carbon
capture and storage (CCS) and renewables. The European Investment Bank envisages selling future
derivative contracts against these allowances in several tranches during 2011-2013, thus effectively
increasing the supply of allowances available for hedging.
From 2013 onwards, allowances to the power sector will predominately be allocated by annual auctions.
Already in 2012, 120 million allowances will be auctioned and therefore 60 million will be subtracted from
the volume to be auctioned in 2013 and 2014 (European Commission 2010).
International credits
The EU ETS cap is also extended by the limitation of carbon credits allowed to be imported from Clean
Development Mechanism (CDM) and Joint Implementation (JI) projects. Accounting for aviation and new
sectors, EU ETS installations are allowed to use up to a total of 1.68 billion CDM and JI credits to cover
their emissions. According to our estimations, this volume will be reached by 2013/2014.
Clean Development Mechanism
For each abated metric tonne of equivalent carbon dioxide, CDM projects receive one Certified Emissions
Reduction (CER - each one equal to one EU ETS allowance). By 2012, CERs issued from all projects
linked to EU buyers are expected to amount to 1.15 billion. Beyond 2012, the use of industrial gas credits
(HFC and N2O) is banned in the EU ETS and is thus excluded from our estimate of issuance available to
EU buyers. The actual issuance of CERs over the period 2000-2010 is based on the public IGES CDM
Page 14Banking of emissions allowances – does the volume matter? March 2012
Project Database (2011), and for the remaining years based on CER volumes listed in project
documentation. We assume that 75% of these latter values are achieved beyond 2012.
A number of assumptions were used to ascertain the amount of CERs available to EU ETS participants
(1.15 billion tonnes). Based upon the published list of CDM project sponsors, EU buyers (including all EU-
27 member states, Norway, Iceland, Liechtenstein and Switzerland) were involved in approximately 70%
of all 3,556 registered CDM projects as of November 2011. In the event that projects have multiple
sponsors, the expected offsets are split evenly among sponsors. For the purposes of this study, projects
that have no specified sponsors are excluded: if they were included as EU projects, the share of EU
involvement in CDM projects would rise from 70% to 90%, thus increasing the availability of allowances
for hedging.
Credits issued prior to 2008 are allocated to the year 2008. To assess the maximum supply of credits
from registered projects, we assume successive renewal of crediting periods (where after the completion
of its first crediting period, a project can apply for a second and third seven-year period), which is
reflected in high issuance volumes after 2012.
The EU offers flexibility for installations to distribute the use of CERs throughout Phase III of EU ETS.
Given delays from an initially slow CER issuing process, and the lower cost of holding CERs (with lower
prices) compared with holding EU ETS allowances, it was anticipated that companies would make
extensive use of this flexibility.
However, with political discussions and uncertainty around eligibility criteria of CDM credits in the EU ETS
(e.g. constraints on credits from industrial gas projects), companies are likely to have changed their
strategy towards early translation of CERs into EU ETS allowances. Of the 3.556 registered CDM
projects, 1,225 (35%) have started issuing CERs. The remainder have had their issuances delayed.
Indian projects wait until CER prices increase to request the issuance of credits as these projects are not
based on forward contracts, and do not have an obligation to deliver. These credits are thus not suitable
for hedging purposes. The study assumes that these projects start issuing regularly from 2011 onwards.
Figure B1: CER credits available for hedging purposes
Sources: IGES (2011)
Page 15Banking of emissions allowances – does the volume matter? March 2012
Joint Implementation
Similarly to the CDM, JI projects allow EU installations to use JI credits for compliance as long as the total
limit of 1.68 billion is not surpassed. Currently, registered JI projects offer 235 million credits (Emission
Reduction Units – ERUs: each allowing EU buyers emissions equal to one tCO2(e)) by the end of 2012,
according to project documentation.
If additional JI project credits become available in the coming years, they will not impact on the scarcity of
EU ETS under the current EU ETS emissions cap, since the import limit of international offset credits will
most likely be reached by 2013/2014.
Assigned Amount Units
Assigned Amount Units are internationally recognized, tradable carbon credit equal to one tCO2(e), which
were provided to all Annex I countries to meet targets under the Kyoto Protocol. No AAU can be used in
the EU ETS. Host governments can convert “headroom” AAUs into credits under Joint Implementation
Track 1, but their import into EU ETS is capped.
Projected EU ETS emissions
EU ETS emissions are based on Community Independent Transaction Log data (CITL 2011) for verified
emissions for the period 2008-2010, and on the European Commission current policy initiative scenario of
the Energy Roadmap 2050 from 2011 onwards (European Commission 2011). This scenario includes
both emission by aviation (0.265 billion emissions in 2012) and new sectors and assumes a carbon price
of 15 €/tCO2 in 2020. Applying the high renewables scenario of the Energy Roadmap, the assumed
carbon price in 2020 increases to 25 €. Under under the Reference scenario the assumed price is 18 €
(European Commission 2011, p.37 Table 37).
Uncertainties in creation of EU ETS demand-supply balance
Emissions up to 2020 are based on the EU Commission current policy initiative scenario. Applying the
reference or the high renewables scenario, the surplus in 2013 would decrease from 913 million tonnes to
884 million tonnes or increase to 974 million tonnes, respectively.
The expected CDM supply available to EU buyers is dependent on issuance success. Before 2011, we
use actual issued credits linked to EU buyers. From the beginning of 2011 onwards, we assume that
issuance success is 75% of the volume claimed in project documentation. If issuance success is
assumed to be 100%, then the supply will increase by 190 million tonnes by 2012, and the import limit will
be reached two years earlier.
The expected volume of JI credits that will be available to EU buyers by 2012 is 235 million. If additional
supply is generated by the projects currently in the pipeline, which are mainly based in Russia, this could
add up to a maximum of 160 million credits by 2012 (corrected for issuance success rate). A higher
issuance of credits would fill the project credit import limit in the EU ETS earlier.
To quantify the allowances held by the industry sector, we compare CITL data on allocated allowances
(excluding CERs) with verified emissions from the years 2008-2010. We use NACE codes, the Eurostat
standard sector classifications, to distinguish between sectors. The surplus of allowances amounts to 569
million excluding project credits. If we instead calculate industry allowances based on the ten categories
(e.g. combustion, steel etc.) distinguished in the CITL, the surplus decreases to 500 million mainly
because industrial producers of power are not allocated to the industry sector under the latter approach.
Page 16Banking of emissions allowances – does the volume matter? March 2012
Annex C - Hedging demand of power sector
Figure C1 depicts the carbon hedging range accounting for shares of fossil and non-fossil generation
assets based on the analysis of nine leading European utilities, and scaled to total European power sales.
Figure C1: Average weighted power hedging strategy in European utilities
billion tCO2
100% 1,0
Power hedged with non-
90% 0,9 fossil fuels generation
80% 0,8
Hedging corridor
70% 0,7 (fossil/non-fossil hedge
possible)
60% 0,6 Power hedged with fossil
50% 0,5 generation
40% 0,4 Min CO2 hedging demand
30% 0,3
20% 0,2 Max CO2 hedging demand
10% 0,1
0% 0,0
1 year ahead 2 years ahead 3 years ahead
Sources: 2010 Annual Reports of 9 European utilities (E-on 2010; EDF 2010; EnBW 2010; ENEL
2010; GDF Suez 2010; Iberdrola 2010; RWE 2010; Statkraft 2010; Vattenfall 2010) Eurelectric
(2009); Eurostat (2011); Point Carbon (2011); IPCC (2006).
Hedging demand
Utilities reduce their risk exposure to volatile power prices, by signing contracts to sell power up to four
years ahead of actual generation: typically 70% one year ahead, 40% two years ahead and 15% three
years ahead (Eurelectric 2009). We estimated power hedging demand for allowances for 9 large
European power generators based on their portfolio mix and power hedging strategies available from
either annual reports or Eurelectric (2009).
Scaling up to the European hedging volumes
To scale up this volume to the European level, we used the weighted average power mix and power
hedging strategies of three years ahead.
Building up hedging corridor
The lower bound of the hedging corridor is determined by using the maximum share of non-fossil fuels in
the power portfolio. Similarly, the upper bound of the hedging strategy is based on the maximum share of
fossil fuels in the power portfolio.
Calculating hedging demand for allowances
Number of emission allowances for hedging needs was estimated based on the the merit order of the
fossil fuels, i.e. the maximum hedging demand for allowances assuming the least, and minimum volume
of hedging demand accounting for the most efficient fossil fuel mix. We assumed 49% efficiency for gas
and 38% for coal to calculate carbon intensities based on the IPCC (2006).
Free EU allowance allocation
Page 17Banking of emissions allowances – does the volume matter? March 2012
The allocation of free allowances for each year of a trading phase is determined prior to the trading
phase. Power generators use these free allowances to hedge their power sales in future years. According
to our interviewees, allowances expected to be issued in a future year are only used to hedge power
sales contracted for that year. Typically, free allowances are sold close to the date of allocation because
of the risk exposure associated to holding IFRS-declared ‘valueless’ assets on the balance sheet. In
principle, however, power generators could use future free allocations, not used for hedging purposes in
the specified year, to hedge emissions in other years, or used by other sectors.
Uncertainties in creating hedging corridor
The estimated hedging corridor assumed all power generators to pursue hedging strategies of three years
ahead. In practice, some of the utilities, in particular smaller ones, may have less sophisticated hedging
strategies (e.g. power sales maximum one year ahead). This would shift down the upper and the lower
bounds of the hedging corridor. If we assume hedging strategies of two years ahead for power generators
in the new Member States (80% sale in the first year and 20% in the second year (Point Carbon 2011))
and the average power mix (67% of fossil and 33% non-fossil fuels(Eurostat 2011)) the potential hedging
demand increases from 1.8 to 2.1 billion allowances in 2012.
In addition to the hedging corridor that results from the choice of assumed fuel mix, companies define
‘bands’ for the share of power to be sold. For example, E-on allows for a 10% band for each of the three
years in its forward power sales. Where power is fossil fuel based, this can further change the carbon
hedging corridor, but is not included in our analysis. We capture hedging demand on an annual basis and
do not account for intra-annual changes in hedging demand.
Power generators reported that energy portfolio optimization and carbon price expectations impact their
hedging strategy.
Figure C2: Carbon price development and potential drivers
Page 18Banking of emissions allowances – does the volume matter? March 2012
70.00 70.00
Euro /
tonne CO2 Euro / MWh
Carbon fuel switch corridor -
60.00 38% and 33% coal efficiency 60.00
50.00 50.00
40.00 40.00
Clean dark spread
(right - axis)
30.00 30.00
20.00 20.00
10.00 Carbon front-year price 10.00
0.00 0.00
05.12.2008
05.01.2009
05.02.2009
05.03.2009
05.04.2009
05.05.2009
05.06.2009
05.07.2009
05.08.2009
05.09.2009
05.10.2009
05.11.2009
05.12.2009
05.01.2010
05.02.2010
05.03.2010
05.04.2010
05.05.2010
05.06.2010
05.07.2010
05.08.2010
05.09.2010
05.10.2010
05.11.2010
05.12.2010
05.01.2011
05.02.2011
05.03.2011
05.04.2011
05.05.2011
05.06.2011
05.07.2011
05.08.2011
05.09.2011
05.10.2011
05.11.2011
05.12.2011
Sources: ICE Futures Europe (2011); EEX (2011); European Central Bank (2011).
First, the energy portfolio of a utility is optimised if they initially sell output based on the lowest cost plant.
Figure C2 depicts the carbon price range in which shifting generation from a representative coal plant to a
representative gas plant becomes profitable (orange corridor - upper bound is the price where coal plant
at 38% efficiency is switched to gas, lower bound for 33%). Due to high oil prices driving gas prices over
the observation period, this price was not reached by the marketed carbon price (red line), indicating a
preference of coal over gas. The profitable level of the clean dark spread (dashed line) also shows that
operation of coal power plants remained profitable during this period, suggesting that utilities are at the
upper end of the hedging corridor as constructed in Figure C1.
Figure C3: Carbon price growth rates
%
10
9
Growth rate of
DEC 12 to DEC 13
8
7
6
5
4
3
2
Growth rate of Growth rate of DEC Growth rate of Growth rate of
1 DEC 08 to DEC 09 09 to DEC 10 DEC 10 to DEC 11 DEC 11 to DEC 12
0
04.01.2008
04.02.2008
04.03.2008
04.04.2008
04.05.2008
04.06.2008
04.07.2008
04.08.2008
04.09.2008
04.10.2008
04.11.2008
04.12.2008
04.01.2009
04.02.2009
04.03.2009
04.04.2009
04.05.2009
04.06.2009
04.07.2009
04.08.2009
04.09.2009
04.10.2009
04.11.2009
04.12.2009
04.01.2010
04.02.2010
04.03.2010
04.04.2010
04.05.2010
04.06.2010
04.07.2010
04.08.2010
04.09.2010
04.10.2010
04.11.2010
04.12.2010
04.01.2011
04.02.2011
04.03.2011
04.04.2011
04.05.2011
04.06.2011
04.07.2011
04.08.2011
04.09.2011
04.10.2011
04.11.2011
04.12.2011
Sources: (Point Carbon 2011)
Page 19Banking of emissions allowances – does the volume matter? March 2012
Second, expectations about increasing carbon prices create an incentive to buy more carbon. Rather than
directly owning allowances, power companies sign contracts on the carbon price with third parties that
hold allowances. Thus power companies avoid the cash requirements, while the third party avoids the risk
from carbon price uncertainty. Figure C3 depicts growth rates of front year contracts from one year to the
next. Thus contracts for 2011 were traded at about 5% discount below 2012 contracts, contracts for 2012
at 7% premium below 2013 contracts.
References
Alberola, E. and J. Chevallier (2009). "European carbon prices and banking restrictions: Evidence from
Phase I (2005-2007)." The Energy Journal, forthcoming.
Bessembinder, H. (1992). "Systematic risk, hedging pressure, and risk premiums in futures markets."
Review of Financial Studies 5(4): 637-667.
Bosetti, V., C. Carraro, et al. (2008). "Banking permits: Economic efficiency and distributional effects."
Fondazione Eni Enrico Mattei Working Papers: 165.
CITL (2011). Community Independent Transaction Log (CITL) data on verified emissions and allocated
allowances.
Department of Energy and Climate Change (2009). Impact Assessment of EU Climate and Energy
package, the revised EU Emissions Trading System Directive and meeting UK non-traded target through
UK carbon budgets.
E-on (2010). Annual report 2010.
EDF (2010). Annual Report 2010.
EEX (2011). EEX data on German baseload power 2012.
Ellerman, A. D. and J. P. Montero (2005). "The efficiency and robustness of allowance banking in the US
Acid Rain Program."
Ellerman, A. D. and R. Trotignon (2008). "Compliance Behavior in the EU-ETS: Cross Border Trading,
Banking and Borrowing."
EnBW (2010). Annual Report 2010.
ENEL (2010). Annual Report 2010.
Environment Committee of the European Parliament (2011). Environment Committee calls for ETS credits
to be set aside, Press release.
Eurelectric (2009). EU ETS Phase 3 Auctioning – Timing and Futures versus Spot.
European Central Bank (2011). USD/ Euro Exchange rate.
European Commission (2008). Impact Assessment. Commission Staff Working Document accompanying
the Package of Implemenation measures for the EU's objectives on climate change and renewable
energy for 2020. SEC(2008) 85/3.
European Commission (2010). Auctioning Regulation (EU) No 1031/2010.
European Commission (2011). "Energy Roadmap 2050 - Impact Assessment."
Page 20You can also read


