Quantifying flexibility markets - TenneT
←
→
Page content transcription
If your browser does not render page correctly, please read the page content below

Quantifying flexibility
markets

Marit van Hout
Paul Koutstaal
Ozge Ozdemir
Ad Seebregts

December 2014
ECN-E--14-039
Acknowledgement

The authors would like to thank TenneT for its support of this project. Our study has
benefitted substantially from the inputs and review of the members of the advisory
committee, Oscar Tessensohn, Erik van der Hoofd and Eppie Pelgrum. In preparing this
study, the authors have also profited significantly from support from Professor
Benjamin Hobbs and Robin Broder Hytowitz from Johns Hopkins University. Any
remaining errors are the sole responsibility of the authors.

This report is registered under ECN project number 5.2879. Contact Paul Koutstaal
[koutstaal@ecn.nl]

Abstract

A model-based approach has been used to determine volumes and prices of flexibility
on the future day-ahead and intraday market, given increasing levels of intermittent
renewables in the electricity generation mix. While the focus is on market
developments in the Netherlands, the analysis has been made with a detailed electricity
market model for the whole of Europe. For this project, the model has been extended
to include various flexibility constraints for different types of power plants such as, for
example, ramping rates and start-up costs. In addition to the analysis of the day-ahead
and intraday market, a number of business cases have been evaluated for different
sources of flexibility such as gas-fired power plants and storage.

‘Although the information contained in this report is derived from reliable sources and reasonable care
has been taken in the compiling of this report, ECN cannot be held responsible by the user for any
errors, inaccuracies and/or omissions contained therein, regardless of the cause, nor can ECN be held
responsible for any damages that may result therefrom. Any use that is made of the information
contained in this report and decisions made by the user on the basis of this information are for the
account and risk of the user. In no event shall ECN, its managers, directors and/or employees have any
liability for indirect, non-material or consequential damages, including loss of profit or revenue and loss
of contracts or orders.’

Contents
      Management summary                              4

1     Introduction                                    11

2     Increasing demand for flexibility               13
2.1   Introduction                                    13
2.2   Scenario assumptions and results                14
2.3   Flexibility on the day-ahead market             17
2.4   Flexibility on the intraday market              21

3     Business cases for flexibility supply in 2023   27
3.1   Introduction                                    27
3.2   Flexibility from generation                     27
3.3   Storage and demand response                     32

4     Discussion                                      39

      Literature                                      41

      Glossary                                        42

Appendices

A.    Load duration curves and load factors           43
B.    COMPETES Unit Commitment model                  46

         ECN-E--14-039                                     3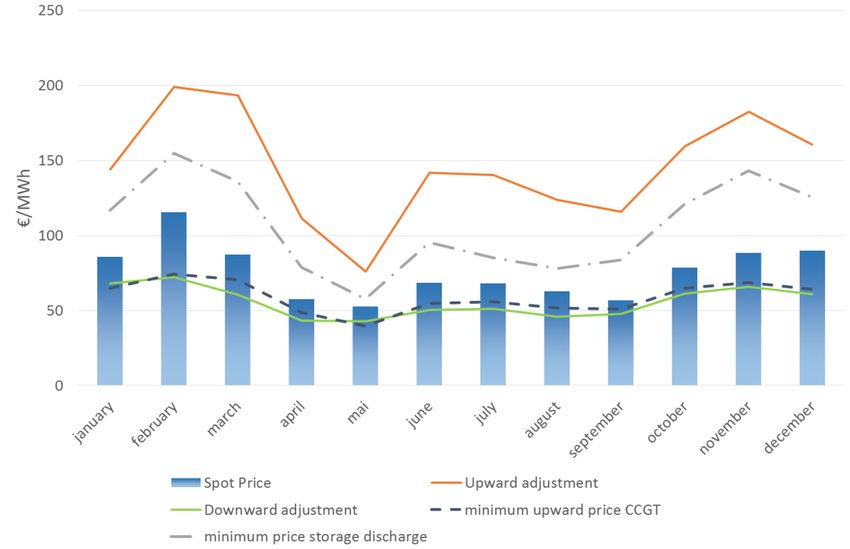
Management summary
                                     Main conclusions

                                     1. Increase in renewables in North-West Europe requires flexible generation to
Gas-fired power plants in the           accommodate variable production
Netherlands will provide             Power generation from intermittent renewable energy resources in North-West Europe
significant amounts of flexibility
                                     is projected to increase significantly in the next ten years. One of the consequences of
in 2023
                                     the growth in renewable electricity generation is more volatility in the production, with
                                     large changes in production from one hour to the other. This volatility will have to be
                                     accommodated by dispatchable conventional generation (or by other flexibility
                                     options). Not all conventional power plants will be able to accommodate those changes
                                     by ramping up or down their production fast enough because of flexibility constraints.
                                     These constraints include start-up costs, ramping up and ramping down rates and
                                     minimum operating levels. Increased flexibility requirements will significantly shift
                                     production towards more flexible gas fired power plants. In the Netherlands, gas-fired
                                     power plants will produce 3,2 TWh more in 2023 because of the constraints on other
                                     technologies. This production replaces not only coal and other less flexible capacity in
                                     the Netherlands, it is for a large part also used to provide flexibility to neighbouring
                                     countries.

                                     The supply of flexibility from both incumbent and from new suppliers will not be
                                     forthcoming without adequate incentives. A well-functioning market will be crucial to
                                     provide the price signals needed to ensure that the flexible assets are available to
                                     accommodate variable production from renewables.

   4
Figure 1: Volatility of annual average prices

€ 120
€ 110
€ 100
 € 90
 € 80
 € 70
 € 60
 € 50
 € 40
 € 30
 € 20
                       2012                     2017                  2023

2. Price volatility rises with increasing shares of renewables in the production mix
With the rising electricity production from renewable energy sources, large variations in
generation from renewables will be accompanied by increased price volatilities. This
becomes apparent especially in 2023, see Figure 1. Price volatility will be an important
driver for flexibility options such as storage and demand side response, options which
can profit from the price differences caused by the variability of wind and solar power
production.

3. The increase in wind generation in the Netherlands will significantly increase
   demand in the intraday and balancing market
Energy companies have to submit balanced portfolios day ahead to the system
operator. Actual generation and consumption however will differ from these submitted
programs. Energy companies can make adjustments within their own portfolio, trade on
the intraday market to correct for these deviations or be exposed to the balancing
mechanism of the system operator. Deviations will significantly increase with the
increasing share of intermittent renewable energy sources because of the uncertainty
with regard to forecasting production 24 hours ahead. This will drive an increased
demand for flexibility on the intraday market, as is show in Figure 2 below.
Apart from the increase in demand for flexibility, Figure 2 also demonstrates which
flexibility sources could cost-optimally provide in this demand for flexibility.

            ECN-E--14-039                                                                   5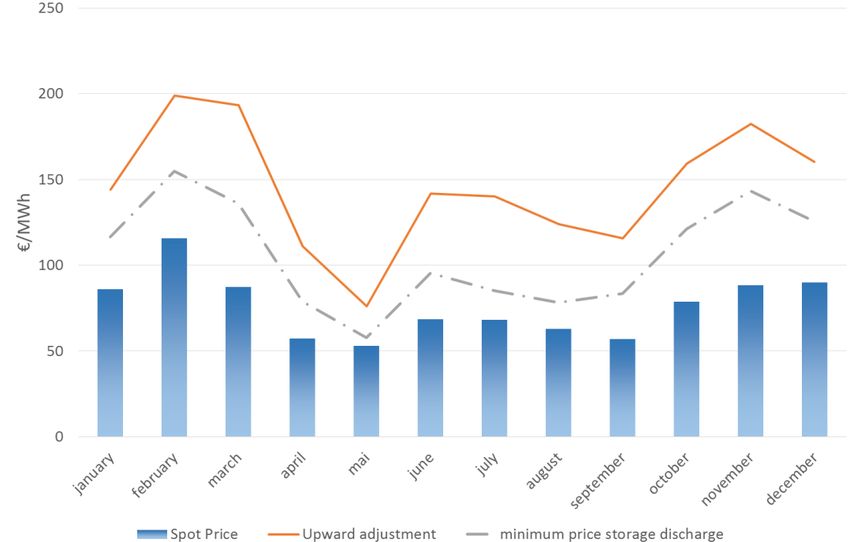
Figure 2: Demand for upward and downward flexibility on the intraday market

                                4. Increased demand on the intraday market will drive up prices, thereby providing
Demand, prices and revenues        additional value for conventional generation
on the intraday market show a   The increasing need for balancing, either within portfolios or on the intraday market,
large increase
                                will not only provide additional demand for ramping up of conventional production, it
                                will also drive up the price on the intraday market for additional power to compensate a
                                shortfall in production from renewables. Figure 3 below shows the monthly prices in
                                2023 for the spot market day-ahead and for the intraday market the price for additional
                                generation and the bid price for ramping down. The monthly prices for ramping up are
                                based on those hours in which there is a demand for additional generation, those for
                                downward adjustment on the hours in which generation needs to be reduced.

                                Both ramping up and down will provide an additional source of revenue for
                                conventional generation, as is shown in Table 1 below. The revenue shown is the
                                revenue earned on the intraday market less the variable costs of electricity production
                                when ramping up. It does not include the fixed costs of generation, therefore profits
                                will be lower.

                                Table 1: Revenue on the intraday market

                                 Mln €                                         2017                           2023

                                 Coal                                            2                             5
                                 Gas CCGT                                        1                             16
                                 Gas CHP                                         6                             6
                                 Gas GT                                          0                             55

                                Demand on the intraday market will provide an incentive for new sources of flexibility.
                                There are several sources for additional supply on the market, such as reduced exports
                                or increasing imports, if there is spare capacity in neighbouring countries. In addition,
                                there will be a shift from offering production on the day-ahead market to the intraday
                                market, because profits on the intraday market will be higher. Finally, high prices on the
                                intraday market will attract new generators and other sources such as demand side

   6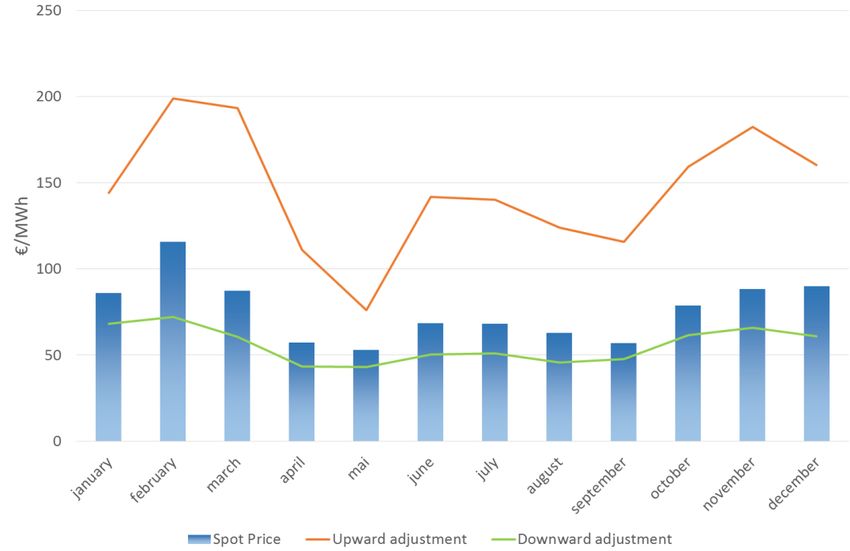
response and storage to enter the market. Without entrants, demand for flexibility will
not be met because of a lack of sufficient supply of flexibility in the system.
Figure 3: Monthly day-ahead and intraday prices
5. Business cases
Taking investment costs into account, gas-fired power plants such as combined cycle The business case for flexibility
gas turbines and open cycle gas turbines will be able to make a profit on the intraday supply on the intraday market
market. While a gas turbine plant is only just profitable, profits for a CCGT plant are from gas-fired power plants
and storage is positive.
about €25 million in 2023. The positive profit for a CCGT plant indicates that there is
room for additional sources of flexibility, especially in those hours in which CCGT
provides flexibility.
While new capacity will bid down prices on the intraday market, they will remain high
enough to allow them to recoup their investment costs, otherwise additional entry
would not occur. Figure 3 shows the monthly minimum upward adjustment prices
including the scarcity rent needed for a CCGT plant in order to have a positive business
case. This minimum price is below the day-ahead spot price, illustrating the profitability
of a CCGT plant.
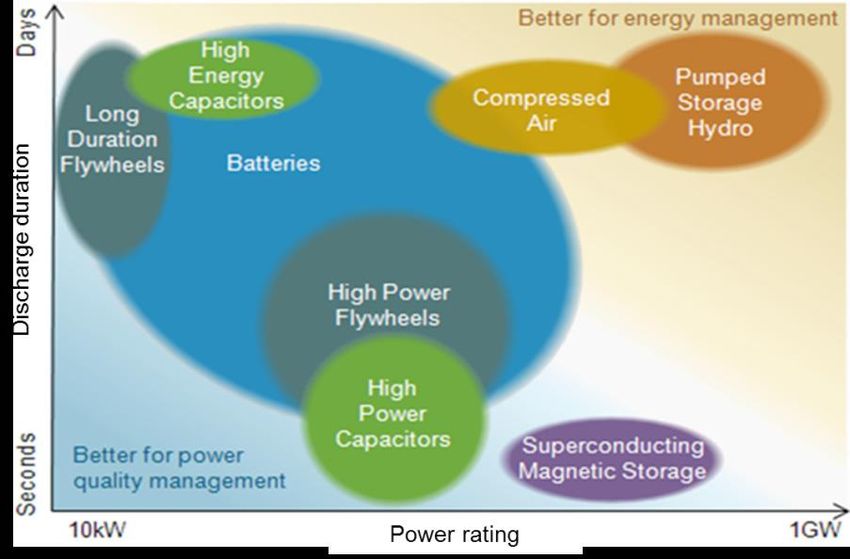
Another option to provide flexibility is storage. The storage technologies which can
provide volumes useful on the intraday market are mainly pumped hydro storage and
Compressed Air Electricity Storage (CAES). Given the focus on balancing in the
Netherlands, a business case for a 300 MW adiabatic CAES has been analysed.
Depending on the investment costs, for which current estimates provide a range of 600
- 1200 €/kWe, the business case is positive, yielding a net profit in 2023 of € 17 - 36 mln.
The increased price volatility is an important driver for the profitability of a CAES
storage facility. The business case will be just positive, given prices equal to the
minimum price for storage shown in Figure 3, assuming high investment costs of 1200
€/kWe.
ECN-E--14-039 7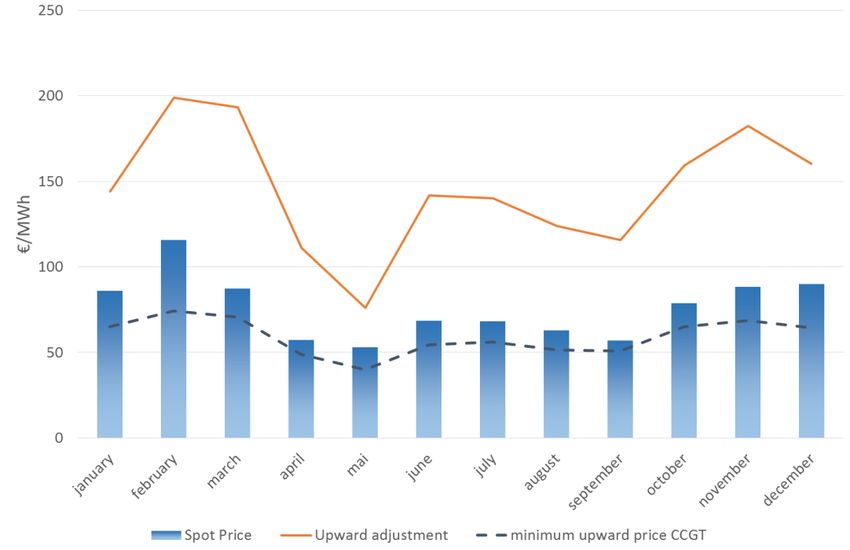
6. An efficient and transparent intraday market will help accommodate increased
Balancing responsibility for all      levels of renewables in a cost-effective way
generators and imbalance
                                   Our analysis has shown that efficient intraday markets will contribute to
prices which reflect full costs
promote the development of
                                   accommodating increasing levels of variable and uncertain renewables in the electricity
intraday markets                   market. These markets will give a price incentive for both flexible generation and other
                                   sources of flexibility such as storage and demand side response to provide the increased
                                   need for flexibility. On this market, the most cost-effective options will be selected to
                                   compensate higher or lower than forecast power production from renewable energy
                                   sources, thereby reducing overall costs of integrating renewables in the electricity
                                   system.

                                   An important requirement for an efficient intraday market is balancing responsibility for
                                   all producers, including renewable energy power generators. Otherwise, renewable
                                   power generators will not have an incentive to trade on the intraday market. Without
                                   balancing responsibility for renewable generators, the intraday market will not develop
                                   and there will be no incentives to develop new sources of flexibility. Furthermore, there
                                   should be an incentive for balancing responsible parties to be active on the intraday
                                   market instead of leaving it to the TSO to balance the market. This requires that they
                                   bear the full costs of balancing incurred by the TSO. If this would not be the case, for
                                   example because part of these costs are socialized or because the price paid for
                                   imbalance is based on average costs instead of marginal costs, it would be less costly to
                                   leave balancing to the TSO and the intraday market would not develop. In essence both
                                   - the responsibility and the incentives - are part of the current balancing regime in the
                                   Netherlands.

                                   Study approach and future issues
                                   In this study, the market for flexibility in the Netherlands has been quantified, focussing
                                   on the intraday and balancing market. The analysis of flexibility on the day-ahead
                                   market also includes the effect of solar-pv electricity generation on the flexibility
                                   requirements, both in the Netherlands and in neighbouring countries. On the intraday
                                   market, we have restricted ourselves to the analysis of demand for flexibility driven by
                                   the wind forecast error, solar-pv has not been taken into account on this market. Future
                                   electricity market developments have been derived using the COMPETES European
                                   electricity market model, which has been adapted for this study to include flexibility
                                   constraints and unit commitment. The analysis is based on assumptions regarding
                                   future developments of fuel prices, interconnections, demand and capacity mix in the
                                   individual European countries and renewable energy generation profiles derived from
                                   various sources such as the IEA’s World Energy Outlook 2013, ENTSO-E scenario’s and
                                   network development plans and from detailed renewable energy data from TSO’s and
                                   other sources.

                                   While developments and interactions with other European countries have been taken
                                   into account, the balancing market has only been analysed for the Netherlands,
                                   reflecting current practice in which system balancing takes place within countries.
                                   However, with further integration of electricity markets, balancing over a larger
                                   geographical area can be expected to reduce overall balancing costs by improving the
                                   exchange of flexibility. This is also illustrated by the important role imports and exports
                                   have in providing flexibility on the day-ahead market as shown in our analysis. It would

   8
therefore be valuable to look at the effects of integrating both intraday and balancing
markets across country borders.
Furthermore, our analysis has been based on hourly data. However, volatility of
renewable power generation is continuous. An analysis based on shorter time periods,
such as 15 minutes, will probably show an increased demand and a higher value for
flexibility.
Finally, while we have looked at large-scale storage at the level of the high voltage
network, local battery storage by households have not been taken into account.
However, the possibility that there will be a considerable deployment of such storage,
especially if the current implicit tax subsidy for solar-pv would be diminished. Such a
deployment would have an impact on the results from our study, diminishing the role of
solar-pv generation on the demand for flexibility on the day-ahead market.
ECN-E--14-039 91
Introduction
Increasing shares of subsidised electricity generation from renewable energy sources
will have a considerable impact on electricity systems. An important effect from
increasing production of renewable energy sources is that the predictability of
production decreases because non-dispatchable generation from wind and solar
depends on inherent uncertain wind and solar predictions. This increases the need for
balancing and therefore short-term flexible resources, including options such as flexible
power plants, storage, demand response etc. In addition, a considerable amount of
dispatchable capacity is needed for those periods in which renewables production is
low. The hours at which this back up capacity will operate are expected to be limited,
therefore prices need to be high enough to allow investors in such peak capacity to
recoup their investments. The electricity market will also be affected. When wind and
solar electricity production is high, production from conventional sources will be limited
and electricity prices will decrease, thereby reducing the income for conventional
power production.
Increasing shares of renewables therefore poses challenges for the performance of the
current electricity market and for the business model of conventional generation.
However, it will also raise new opportunities. Conventional production will be called
upon to provide flexibility to accommodate the variability of wind. This includes, for
example, increased ramping up and down to meet the variability of renewable
production, both in the day-ahead market to meet the expected variability and on
balancing markets to meet forecast errors, and to provide power at peak hours with low
renewables. In order to be able to judge the potential of these new market
opportunities, it is important to have quantitative information on the demand for these
types of services and on the costs of the different options available to provide flexibility
both for short run balancing and longer term back up capacity.
In this study, the main question which we address is how markets for flexibility will
develop with increasing levels of intermittent renewables. Given this main question,
specific questions which will be answered are:
1. What is the size of the market for flexibility in the Netherlands in 2017 and 2023 in
terms of price volatility, volume and value, both in the day-ahead market and in the
intraday balancing market?
ECN-E--14-039 112. What are the costs of different flexibility options such as, for example, flexible
power plants, storage and demand response?
3. Given price volatility, demand for and costs of flexibility options, what are the
business cases for different types of flexibility?
4. How might new or enhanced markets for flexibility perform in terms of liquidity,
risks, number and type of participants etc. and what barriers and market failures
might hamper the development of these markets?
So far, there is limited quantitative research on the effects of increasing levels of
intermittent renewables on demand for flexibility, although there have been many
studies which have looked at the power system impacts of intermittent renewables
(e.g. Sijm 2014, IEA 2014, NREL 2010a and 2010b). In our approach, we will use the
European electricity market model developed at ECN, COMPETES, to determine market
effects of increasing renewable production such as increased demand for flexibility and
prices. Subsequently, we will use these market data to analyse business cases for
different types of flexibility options.
In the next chapter, we will describe our methodology and main assumptions and we
will present the market effects of increasing intermittent renewables production. In
chapter three, different flexibility options are discussed and the business cases for these
options are analysed. It should be noted that no new equilibrium is calculated using the
outcome of these business cases. Chapter 4 concludes with a discussion of the results
and of the future of flexibility markets.
122
Increasing demand for
flexibility
2.1 Introduction
The main question to be answered in this study is how increasing shares of renewable
power production in the Netherlands will affect the need for flexibility within the
electricity system and how markets for flexibility will develop. To address this question,
we will analyse the expected future developments on the electricity market in the
Netherlands and the rest of Europe for the years 2017 and 2023. According to the
Energy Agreement concluded in 2013 in the Netherlands, renewable energy production
in the Netherlands will have to reach a share of 14% in 2020, with a capacity of 6000
MW of wind on shore in 2020 and 4450 MW of wind off shore in 2023. Assuming that
these shares will be realised, the year 2023 will provide a good example of an electricity
market with a substantial share of intermittent renewable power production. The
comparison with 2017, in which year renewable shares are considerably smaller, allows
us to highlight the effects of increasing renewable shares.
In the analysis of flexibility, we will make a distinction between on the hand variability
from wind energy based on the expectations of wind power production on the day
ahead market and on the other hand the increasing demand for balancing in the
intraday and balancing markets because of the forecast error of wind power generation.
On the day ahead market, flexible generation will supply increased ramping up and
down in order to accommodate increased variability of renewable production.
Furthermore, peak generation will be needed to meet high demand levels at moments
of low wind power production.
Because of the forecast error, realized wind production will differ from the forecast
production on the day ahead. Balancing responsible parties will therefore look for
flexibility in the intraday market to balance their programs, given differences in wind
production compared to their submitted programs. In as far as these differences cannot
be met on the intraday market, these will have to be addressed by the TSO, TenneT,
ECN-E--14-039 13who will contract regulating and reserve power in order to ensure system stability. In
our approach, we will not distinguish between the intraday market and the single-buyer
market for regulating and reserve power, instead we will consider the need for
flexibility because of forecast errors as one (intraday) market. In this analysis of the
intraday market, we focus on the forecast error of wind, which is the main intermittent
renewable technology in 2023 in our scenario. However, in other scenarios, with a
higher level of sun-pv, the forecast error from sun-pv would be more significant and
contribute to demand on the intraday market.
2.2 Scenario assumptions and results
Assumptions
To provide a detailed quantitative analysis of future electricity market development, we
have used ECN’s European electricity market model, COMPETES. For this study, the
model has been further developed. This includes a detailed modelling of the power
production within the Netherlands, which now contains all large scale power plants as a
distinct production unit. The model has been adapted in order to be able to model unit
commitment. Furthermore, start-up costs have been added and constraints on ramp
rates for different technologies. This allows us to analyse the impact of increased
variability from I-RES generation on the dispatch of conventional units, given their
flexibility characteristics. For a more detailed overview of the version of COMPETES
used for this study, see the appendix titled ‘The COMPETES Model’.
Future electricity market developments are driven by a number of different factors. The
most important factors are:
Fuel and CO2 prices
Electricity demand
Generation capacity mix
Interconnection capacity
Prices of fossil fuel input for electricity generation, coal and gas are important
determinants of electricity prices. Choosing fossil fuel price scenarios however is
difficult, given the many factors that influence fuel markets and the large uncertainties
with regard to future developments. For the first couple of years, future markets give
some indications about future prices, reflecting current market expectations with
regard to future prices. Therefore for 2017, we use recent forward prices for coal and
gas. For 2023, we use prices based on the World Energy Outlook current policies
scenario. Table 1 gives the prices used in 2017 and 2023.
Table 1: fuel and energy prices
2017 2023
Coal Price [€ct/GJ] 3.3 3.5
Natural gas price [€ct/m] 25.8 30.9
CO2 price [€/ton] 9.0 13.5
14Electricity demand is driven by economic growth. Furthermore, electricity prices and
government policies such as energy efficiency policy will influence demand. Demand is
an input in the model, for the Netherlands expected demand is based on the 2012
reference projection for the Netherlands (PBL/ECN, 2012). For the other European
countries, demand has been based on ENTSO-E SO&AF 2013 (ENTSO-E 2013). Scenario
A is chosen to represent the generation and demand developments up to 2020 for all
EU countries except for Germany and the Netherlands. Since only data for 2013, 2015,
2016 and 2020 are provided in SO&AF scenarios, data for 2017 is linearly interpolated
between 2016 and 2020. In addition, also the end year of the Energy Agreement (2023)
is of interest for the flexibility analysis. Figures for 2023 are derived by linearly
interpolating data between 2020 (Scenario A) and 2030 (Vision 3). Vision 3 is referred to
as the “Green transition” scenario.
This ENTSO-E scenario has also provided the input with regard to the development of
the generation mix for those countries. For the Netherlands, the generation mix is
similar to the Dutch Energy Agreement, which has been adjusted to take into account
1
recent mothballing or selling of 7 new CCGT units (equal to about 3145 MW). CHP is
projected to decrease to about 23-24 TWh in the period 2017-2023, roughly 30% less
than 2010 levels. Renewable energy capacity development is based on the Energy
Agreement, see above. Figure 4 presents an overview of Dutch generation capacity over
the years. In 2023, there 4.4 GW of sun-pv capacity according in our scenario. It should
be noted that this figure is quite uncertain, depending on government policy regarding
sun-pv, it might as well be considerably larger or, with a reduction of the tax credit, end
up at a lower level.
Figure 4: Installed generation capacity Netherlands
45
40
35
30
25
GW
20
15
10
5
0
2012 2017 2023
Nuclear & hydro Coal non-intermittent RES CHP Gas Wind & sun
For Germany, capacity has been derived from recent BNetzA figures (BNetzA, 2014).
The same source has been used to estimate the amount of planned decommissioning in
xxxxxxxxxxxxssssssssxxxxxxxxxxxxxx
1 4 units of RWE/Essent (Moerdijk-2 and 3 Maasbracht units), 2 units of the Nuon Magnum power plant and 1
unit of Eneco/Dong Enecogen power plant.
ECN-E--14-039 15Germany (nuclear and other thermal power plants) and conventional new build for the
coming years. The increase in renewable power has been based on a combination of
SER EA and SO&AF scenario A. I-RES capacity (Wind+Sun) growth is 5.5 GW/year (7.6%
/year) of which 2GW/year is the growth of wind power capacity and 3.5GW/year is the
growth of solar-PV capacity.
Interconnection capacity developments in Europe have been based on the ENTSO-E
SO&AF as well, with some adjustments made to the 2013 data for interconnection in
consultation with TenneT. For the Netherlands, connection capacity increases from
4550 MW in 2012 to 8050 in 2017 and 8750 in 2023.
Hourly renewables production profiles have been based on actual data for 2012,
obtained from both TSO’s and from data available at ECN.
Electricity market results
Based on the assumptions described above, annual generation, import and export flows
and prices have been calculated. Figure 5 below shows the production and gross import
in the Netherlands for 2012, 2017 and 2023. Given the increase in intermittent
renewables capacity, especially wind, production increases significantly over the years.
In 2012 and 2017, the Netherlands is a net importer (17 TWh in 2012 and 20 TWh in
2017), in 2023 it has become a net exporter (26 TWh), which is reflected by an increase
in generation from 2017 to 2023 within the Netherlands.
Figure 5: Generation Netherlands
Average prices decline in 2017 compared to 2012, in 2023 they are significantly higher,
see Table 2. These prices are the price on the wholesale market and do not include
subsidies or transport tariffs. In 2023, there is a limited level of demand curtailment in
the Netherlands (in 10 hours, for a total of 13,4 GWh). In these hours, prices reach the
level of the given VOLL. Two different values have been assumed for the VOLL, a high
value of 3000 €/MWh and a low value which is related to the marginal costs of an
expensive peak unit such as a gas turbine, 200 €/MWh in 2012 and 2017 and 320
16€/MWh in 2023. The average price will depend on these assumptions, therefore with a
high VOLL the average price is higher. The higher prices in 2023 as compared with 2012
and 2017 can be explained by higher fossil fuel prices and relatively lower capacity,
compared with demand, in 2023 as compared with prices and capacity in the earlier
years. The high prices during the curtailment hours will provide a strong incentive for
demand response. This has not been modelled because inelastic demand is assumed.
Table 2: Electricity prices Netherlands
Weighted Average Prices (€/MWh)
High VOLL Low VOLL
2012 47.1 47.1
2017 35.9 35.9
2023 93.9 81.2
2.3 Flexibility on the day-ahead market
Demand for flexibility on the day-ahead market
The increasing share of I-RES, especially from wind in the generation over the years will
increase the demand for flexible generation to accommodate the variability of I-RES
production. A measure for flexibility is the change in dispatchable generation from one
hour to the next hour. Total demand for flexibility can then be defined as the sum of the
change in generation from one hour to the next over a year plus the total curtailment of
demand in a year. The former can be considered as flexibility of demand that can be
already accommodated given the assumed market conditions, while the latter can be
considered as the demand for flexibility that cannot be fulfilled by generation. In table
3, total demand for flexibility is shown. The potential for new entrants is calculated
based on level of curtailment (i.e. unfilled demand). The difference in the level of
curtailment in consecutive hours gives an indication of the demand for flexibility for
potential new (flexible) units. In 2012 and 2017 there is no curtailment of demand, and
the total demand for flexibility only slightly increases (+6%). Between 2023 and 2012
there is an increase in total demand for flexibility of 46%.
Table 3: Total residual demand for flexibility in 2012, 2017 and 2023.
Total demand for flexibility (GWh) 2012 2017 2023
Total demand: 2332 2480 3397
of which potential for new
0 0 4
entrants
Demand for flexibility ramp up: 2332 2480 3393
supplied by generation 2339 2313 2521
supplied by net imports -6 167 872
Demand for flexibility ramp down: -2332 -2480 -3395
ECN-E--14-039 17supplied by generation -2338 -2313 -2521
supplied by net imports 7 -167 -874
Source: COMPETES runs.
The increase in demand for flexibility has strongly been affected by the increase in wind
power production. Table 4 below shows the absolute demand resulting from wind
2
production and the percentage in total demand for flexibility in the respective years .
While in 2012 flexibility demand due to the increase in wind power generation was
limited to only 1 percent, it increases to 20% in 2023.
Table 4: Demand for flexibility due to wind power generation
2012 2017 2023
GWh (% of total flexibility demand) 25 (1%) 125 (5%) 674 (20%)
Supply of flexibility on the day-ahead market
When there is a domestic demand to ramp up, one would expect that imports increase
and/or national production units are ramped up. Either or both of the two effects would
be seen in case the Netherlands was linked with a single country with little or no
variation in demand and production. Since the Dutch power market is already strongly
linked with electricity markets abroad, it can be the case that when there is a domestic
demand to ramp up, neighbouring countries will also show a demand to ramp up (or
down). As we are interested in the supply of flexibility due to domestic demand, one
needs to look at the net effect of imports and exports, and also the net effect of
generation, because in a single hour with a domestic demand to ramp up, certain units
might even be ramped down instead. Figure 6 shows that total domestic demand to
ramp up and down in 2012 is fully supplied by generation. Net imports even seem to
provide a small negative contribution to the supply of flexibility. In future years,
interconnection capacity is becoming more important to provide flexibility since net
imports are positively contributing to the supply of flexibility. Developments that are
likely to increase the importance of interconnection capacity for flexibility are the
increasing scarcity of generation capacity, stronger links between the Netherlands and
surrounding countries, and the increasing volatility due to wind, not only in the
Netherlands, but in the whole of Europe. Figure 7 shows the supply of domestic
flexibility per technology. From this figure it becomes clear that especially Gas CCGT
units are becoming important when providing domestic flexibility in the future in the
day-ahead market. Furthermore, even though around 2.7 GW of gas GT capacity is
decommissioned between 2012 and 2023, the remaining units in 2023 are utilized more
to provide flexibility. On the contrary, base load units such as coal and biomass
standalone that provide a certain share in the supply of flexibility in 2012 are
contributing much less to the demand for flexibility in especially 2023. An important
reason for the diminution of the role of coal fired power plants in providing flexibility is
that they are used mainly to provide baseload in 2023 and therefore much less available
to provide flexibility. Another reason is that the older coal-fired power plants are not
flexible enough, see below.
xxxxxxxxxxxxssssssssxxxxxxxxxxxxxx
2
The share of flexibility demand due to wind power has been calculated by comparing a case in which it was
assumed that wind power generation was flat on a monthly basis with a wind power production based on the
hourly 2012 wind profile.
18In order to better understand the drivers for the provision of flexibility and the role of
different types of power plants in accommodating intermittent renewables, we have
compared the model outcomes for 2023 with the results from an analysis in which
there are no limits on the flexibility of any power plants. Table 5 below shows the
differences per technology type, both absolute and as a percentage of the production
levels for the case without flexibility constraints.
Table 5: Impact of flexibility constraints
Generation technology Change in production Percentage change Increase in turnover
[TWh] [mln €]
Coal -0,3 -1%
Biomass standalone -0,04 -1%
CHP 0,1 0%
CCGT 2,5 6% 101
GT 0,6 21% 3,4
The increase in generation from flexible units such as CCGT and GT in the Netherlands is
larger than the decrease in less flexible generation. This due to the fact that flexible
generation in the Netherlands will also provide flexibility to neighbouring countries,
where generation from coal fired power plants is also decreased. Turnover from this
increased production is € 101 mln for Combined Cycle Gas Turbines in the Netherlands
and € 3,4 mln for gas turbines.
Figure 6: Total supply of domestic flexibility
4000,0
Total supply of domestic flexibility (GWh)
Demand to ramp up(GWh)
3000,0
2000,0
1000,0
From net imports
0,0
2012 2017 2023 From generation
-1000,0
Demand to ramp down
-2000,0
-3000,0
(GWh)
-4000,0
ECN-E--14-039 19Figure 7: Supply of domestic flexibility per technology, day-ahead market
3000,0
Supply of domestic flexibility per technology (GWh)
Demand to ramp up(GWh)
2000,0
1000,0 Decentralized CHP
Res-e
Nuclear
0,0 Gas Other
Gas GT
Gas CHP
-1000,0 Gas CCGT
Demand to ramp down
Coal
-2000,0
(GWh)
-3000,0
2012 2017 2023 2012 2017 2023
Price volatility on the day-ahead market
In addition to an increase in the volume of demand (and supply) for flexibility, there is
also an increase in price volatility as the level of wind power generation differs from
hour to hour. This is shown in Figure 8, which shows annual average prices and standard
deviations for 2012, 2017 and 2023 for the Netherlands. The average price in 2023 is
considerably higher compared with 2012 and 2017, given the higher coal and gas prices
assumed for 2023. Furthermore, there is less capacity relative to demand in Northwest
Europe. The increasing share of wind significantly raises price volatility in 2023. Price
volatility will be an important driver for flexibility options such as storage and demand
side response, options which can profit from the price differences caused by the
variability of wind and solar power production.
20Figure 8: Price volatility Netherlands
€ 120
€ 110
€ 100
€ 90
€ 80
€ 70
€ 60
€ 50
€ 40
€ 30
€ 20
2012 2017 2023
2.4 Flexibility on the intraday market
Demand for flexibility on the intraday market
Increased wind power generation will not only increase expected variability on the day-
ahead market, it will also lead to an increased need for flexibility in order to
accommodate forecast errors on the intraday market. Because of these forecast errors,
wind producers or the balancing responsible party (BRP) which has assumed
responsibility for wind production will need to compensate the errors. Or, alternatively,
the TSO will have to contract reserve power to meet the imbalances. This will generate
3
additional demand for flexibility on the intraday market . Figure 9 presents the forecast
4
errors for 2023, based on the forecasted and realised wind profiles used in this study
for the Netherlands, which are based on actual hourly data for 2012.
xxxxxxxxxxxxssssssssxxxxxxxxxxxxxx
3
As explained above, section 2.1, we do not distinguish between the intraday market and the balancing market.
4
Hourly forecasted and actual realised wind data for the Netherlands were acquired from the Wind energy unit at
ECN.
ECN-E--14-039 21Figure 9: Wind forecast errors, 2023
Table 6 shows the demand for flexibility in GWh on the intraday market due to wind
forecast errors. Demand has been determined by taking the difference between two
model runs, one with forecast and another with realised hourly wind production. It has
been assumed that net import/exports remain fixed at the level based upon the day-
ahead schedules (the forecast wind power generation), while generation within the
Netherlands is allowed to adapt to the changed wind power generation. This gives an
estimate of the increased demand within the Netherlands for flexibility to
accommodate wind forecast errors.
Demand increases significantly with the increasing level of wind generation. Given our
assumption of fixed net import/exports, not all demand for flexibility can be met in
2023 from incumbent sources not committed to exports. This will provide an incentive
for other flexibility sources, such as a shift of capacity from the day-ahead market to the
intraday market accompanied by reduced exports, new generators and other suppliers
such as demand side response and storage to enter the market.
Table 6: Demand for flexibility on the intraday market
GWh 2012 2017 2023
Non-committed incumbents 595 1143 2340
Demand for flexibility ramp up
Additional suppliers 824
Demand for flexibility ramp down -368 -734 -2041
Supply of flexibility on the intraday market
The comparison between the two model runs mentioned above, the one with forecast
and the other with realised hourly wind production, also provides information on the
supply of flexibility on the intraday market. In the variant with realised wind production,
the electricity system will adjust production in order to meet demand at the lowest
possible costs, given the changed wind production as compared with the forecast. This
22adjustment provides an estimate of the most efficient accommodation on the intraday
market of the forecast errors.
Flexibility on the intraday market is mainly supplied by gas units, which are the most
flexible units available to supply flexibility. Some flexibility is supplied by coal fired
power plants, especially by new units which are more flexible than the units in place in
2012. Figure 10 and Figure 11 show the supply of both upward and downward flexibility
for different types of power plants. CCGT and gas turbines provide the major part of
flexibility in 2023. Given the assumption of fixed net import/exports, not all demand for
upward adjustments can be met by those generators which are available for the
intraday market. This will provide an incentive for new sources of flexibility, see below
in the section on the Value of flexibility in the intraday market at low VOLL for a
discussion of these new sources.
Figure 10: Supply of upward flexibility on the intraday market
Figure 11 Supply of downward flexibility on the intraday market
ECN-E--14-039 23Balancing prices in the intraday market at low VOLL
It is to be expected that in those hours where there is an upward demand for flexibility
(generation increase) on the intraday market, prices will be higher price compared to
the day-ahead market, while in those hours where there is a demand for downward
flexibility (generation reduction) price will be lower. On the intraday market, for upward
adjustments capacity will be offered that has not been sold on the day-ahead market
and therefore prices will be higher than on the day-ahead market. For downward
adjustments, suppliers will be prepared to pay the balancing party or the TSO, because
they will already have sold their energy on the day-ahead market (see TenneT 2010 and
Abassy et al. 2011).
Figure 12 and
Figure 13 show the monthly prices in 2017 and 2023 for both upward and downward
adjustment on the intraday market to compensate for wind forecast errors. Note that
the price for upward adjustment is based on those hours in which the realised wind
power production is lower than forecast and therefore there is a demand for additional
generation. Similarly, the price for downward adjustment is based on those hours in
which generation has to be reduced because of higher than forecast wind power
production.
Figure 12: Monthly spot and intraday prices 2017
250
200
150
€/MWh
100
50
0
Spot Price Upward adjustment Downward adjustment
24Figure 13: Monthly spot and intraday prices 2023
2017 and 2023 have the same scale, this clearly indicates the difference in the intraday
market for flexibility between those years. In 2017, there is still more than sufficient
capacity in the market, while 2023 presents a different picture. In 2023, in some
months, e.g. February, March and October till December, prices for upward adjustment
are high compared to the day-ahead price. This results both from the higher generating
costs of the available capacity on the intraday market and from unmet demand, at
which hours price equals VOLL. While this might have an upward effect on the average
monthly price for upward adjustment, it also reflects the need for some additional
capacity to balance wind forecast errors. It is a price signal which provides an incentive
for new generation to enter the market. With entry, prices can be expected to fall,
however there will remain a scarcity rent which reflects the costs of providing flexibility
for balancing needs on the intraday market. We will get back to this in our analysis of
business cases in Chapter 3.
Value of flexibility in the intraday market at low VOLL
Given the volumes and prices on the intraday market, we can determine the value of
the flexibility provided on the intraday market. We have assumed that upward flexibility
is recompensed at the actual market price as realised in the specific hour in which the
flexibility is supplied (based on the assumed low VOLL of €320/MWh). This price is equal
to the variable costs of the marginal production unit at that hour. For downward
adjustment, the value equals the difference between the day-ahead price for the hour
under consideration minus the price on the intraday market. Net revenue equals price
times volume supplied minus the variable production costs in the case of upward
flexibility. Based on these assumptions, Table 7 shows the net revenue realised by
different types of technologies.
ECN-E--14-039 25Table 7: Net revenue on the intraday market per technology
Mln € 2017 2023
Coal 2 5
Gas CCGT 1 16
Gas CHP 6 6
Gas GT 0 55
The large increase in wind power generation from 2017 to 2023 raises the net revenues
on the intraday market, especially for Gas CCGT and gas turbines. In addition to the net
revenues of the incumbent generators, additional upward flexibility could be provided
by new generators or by an increase in net imports in the hours in which demand for
flexibility cannot be met in 2023. Given the assumed low VOLL of €320/MWh, the gross
revenue for unmet demand is € 264 mln.
The price on the intraday market is an important determinant of the value of providing
flexibility on this market. As we have seen above, this price can be high in specific
months because of unmet demand in which hours the price reaches the VOLL. In
practice, such price levels will provide an incentive for new providers of flexibility to
enter the market. There are several sources for additional supply on the market. If there
is spare capacity in neighbouring countries, net exports can be reduced compared to
the planned exports on the day-ahead market, which will allow incumbent producers to
generate more for the national intraday market. In addition, there will be a shift of
production from the day-ahead market to the intraday market, because profits on the
intraday market will be higher. Arbitrage then will reduce the price differences between
the two markets (although they will not disappear completely, for example because of
different risk profiles for the two markets and because of a higher scarcity rent on the
intraday market). Finally, high prices on the intraday (and through arbitrage also higher
prices on the day-ahead market) can make it attractive for new generators and other
sources such as demand side response and storage to enter the market (see the next
chapter).
The effect of new sources of supply on the intraday market will be to reduce unmet
demand and to decrease the price on the intraday market, especially in those hours in
which originally not all demand for ramping up could be met. However, while new
entrants on the intraday market will bid down prices, they will remain high enough to
allow entrants to recoup their investment costs, otherwise additional entry would not
occur.
263
Business cases for flexibility
supply in 2023
3.1 Introduction
In the previous chapter, we have analysed the increased demand for flexibility given
rising shares of intermittent renewables, both on the day ahead and on the intraday
market. In this chapter, we will look at the business case for different types of power
plants and for other flexibility options such as storage and demand response. We will
focus on the intraday market, because this is the most significant market as regards
demand for flexibility. Two different types of flexibility will be considered, flexibility
which can be supplied by generation which either increases or decreases its production
and flexibility from other options. Other options include storage, demand response and
increased interconnection. In this study we focus on storage and demand response.
For downward adjustment, another option is to curtail wind power production. This will
especially become an option when wind production is very high relative to demand. A
business case analysis of wind curtailment in itself does not make much sense, because
it will depend to a strong extent on the costs of other options for downward
adjustment. However, in an analysis of the optimal mix of flexibility options, wind
curtailment would definitely have a role to play.
3.2 Flexibility from generation
Conventional dispatchable generation can be used to provide the flexibility needed on
the intraday market to meet unexpected changes in wind production compared to the
forecasts in the day-ahead market. This requires sufficient flexibility in terms of ramp
rates and minimum load levels, depending on the magnitude and the timing of the
change in wind production as compared with predicted wind power production. The
ECN-E--14-039 27shorter the time period in which flexibility is needed and the larger the absolute volume
change is, the more flexible the dispatchable generator has to be. The accuracy of the
prediction in the last hours before gate closure is also important. The more in advance
and the more accurate the prediction of wind power production is within the day, the
more options there will be to acquire the needed decrease or increase in power
production to compensate for the difference between forecasted and realised wind.
Given demand and prices on the intraday market as established in the previous chapter,
we will analyse the profitability of conventional generation in providing the flexibility
demanded in this market. We will analyse the possible role CCGT and GT power plants,
taking into account flexibility constraints for the different types of generation
considered.
In our analysis, we concentrate on the intraday market. It should be realized that in
practice, investments and generation decisions will take into account all markets on
which these assets can be used, from longer term forward markets and day-ahead
markets to intraday markets and the provision of ancillary services. Concentrating on
the intraday market as defined in this study allows us to analyse the additional
opportunities which demand for flexibility can provide using the results from the model
presented in chapter 2 as an input. However, we will take into account that a plant will
also produce on the day-ahead market and therefore investment costs do not have to
be covered solely on the intraday market.
Costs and benefits
Whether an investment will be profitable or not depends on the costs and benefits of
the project. Here, we will consider the profitability of investing in a conventional power
plant to provide flexibility on the intraday market to accommodate wind power
production. Table 8 gives an overview of the main costs and benefits which are incurred
by an investor.
Table 8: Costs and benefits investments in conventional power plants
Costs Benefits
Investment costs Revenues
Fixed operation & maintenance costs Residual value investments
Variable costs
The major costs are the investment cost, which include capital costs for the capital
expended during the construction time, and the variable costs. These consist of fuel
costs and CO2 emission allowances costs and the variable operation and maintenance
costs associated with the operation of the power plant. In addition, there will be fixed
0&M costs which have to be made independent from the level of power production
within the plant.
Revenues are realised by the sale of the produced power on the intraday market we
have analysed in the former chapter. In addition, there can be a residual value which
remains at the end of the operational lifetime of the investment.
In evaluating business cases, the costs and benefits over the whole lifetime should be
taken into account. As we focus on a specific year, 2023, we will calculate the annuity of
28fixed and investment costs over the whole lifetime, allocate these costs to both the day-
ahead and the intraday market based on production volumes and use the share of
annual fixed costs attributed to the intraday market to evaluate the business case for
the years under consideration.
Data input
Table 9 provides an overview of our main assumptions with regard to the fixed costs for
the generation technologies considered here. These assumptions are based on a recent
overview of the costs of power plants by Brouwer (2014), in which values have been
derived for the different cost components based on a range of studies. Brouwer
provides data for different future years, which include cost reductions based on average
reduction in investment costs for different technologies. We have used the cost
estimates for 2020. The investment costs include capital costs and has taken residual
value into account.
Parameters such as lifetimes and discount rates are similar to those used in the 2010
edition of the IEA’s Projected costs of generating electricity study (IEA 2010). Typical
capacities of a single plant are based on those constructed recently and on data from
the literature.
Table 9: Data input and parameters conventional power plants
CCGT GT
Investment costs €661/kWe €355/kWe
Lifetime 30 years 30 years
Capacity 435 MWe 150 MWe
Fixed O&M €14/kWe €9/kWe
Discount rate 10% 10%
Annual fixed costs €37 mln €7 mln
Gas turbines have lower investment costs and will in general have a smaller capacity
than CCGT power plants. In contrast, the efficiency of GTs are lower than those of a
CCGT plant (ca. 60% for a CCGT versus 38% for a GT) and therefore fuel costs will be
substantially higher. Consequently, a CCGT plant will be preferable if it is to be expected
that a sufficient number of operating hours can be made, given the flexibility
constraints of a CCGT plant.
Results
Table 10 provides the results of the business case results for CCGT and GT plants, based
on the input data and on demand and prices on the intraday market. The annual fixed
costs have been adjusted to account for the fact that these plants will also operate on
the day-ahead market. Based on the modelling results for the day-ahead and the
intraday market, annual fixed costs have been allocated to either the day-ahead or
intraday market based on the production volume in those markets.
ECN-E--14-039 29Table 10: Business case gas-fired power plants
CCGT GT
[435 MW] [150]
Ramp up (GWh) 880 342
Ramp up as % of max. annual
23% 26%
output
Ramp down (GWh) 587 337
Net revenue (mln €) 34 1
Part of annual fixed costs 8,9 1
intraday market (mln €)
Profit (mln €) 25,4 0
Internal rate of return (%) 47% 1%
The volumes provided on the intraday market are based on demand and supply on the
intraday market analysed in the former chapter, taking into account flexibility
constraints and marginal production costs of new CCGT and GT plants. Revenues for
ramping down on the intraday market have been included as well, which would
implicitly entail that the plant would operate on the day-ahead market as well.
However, given our focus on the intraday market, although we adjusted the annual
fixed costs, we did not include revenues from generation on the day-ahead market in
our business case. Therefore, the only revenues included are those earned on the
intraday market. If the day-ahead market would have been taken into account as well,
total revenues would have been higher, however fixed annual costs would also be
higher.
For the CCGT plant, the intraday market provides an opportunity to operate profitably,
with a profit of €25,4 mln. For the gas turbine, profit is more or less zero. Assuming
constant net revenues over the whole lifetime of a plant, the internal rate of return for
the CCGT plant is high, 47% while for the GT it is 1%. This difference reflects the
operating hours of both plants on the day-ahead market, where GT have a much lower
load factor. Consequently, the annual fixed costs of the GT have to be covered to a
larger extend on the intraday market than those of the CCGT plant.
The CCGT plant’s operations are constrained by its flexibility constraints; without those
limits, it would have been able to ramp up for almost 200 GWh more. Flexibility
constraints also limit the ramp down which can be delivered by the CCGT, by ca. 350
GWh.
Demand on the intraday market for ramping up is high, resulting in periods with high
prices, which will incite additional flexibility providers to enter the market. This will bid
down the price of flexibility up till the point where entrants will no longer be able to
recoup their fixed costs. In equilibrium, prices on the intraday market will therefore
include a scarcity rent in peak demand hours up and above the marginal costs of
generation, otherwise new generators would not enter the market. As an indication of
this scarcity rent, we have calculated the average monthly prices on the intraday market
at which the business case for both types of plants is just positive, or, in other words, at
which price both technologies can just recoup their investment costs. This is displayed
in Figure 14, which shows the monthly average spot price, the price on the intraday
market and the minimum prices required for CCGT and GT to break even.
30Figure 14: Minimum monthly upward adjustment prices CCGT and GT
Prices for upward flexibility on the intraday market can be considerably lower while still
allowing a CCGT-plant to break-even on the intraday market. For a CCGT plant, the
minimum break-even price is below the spot price on the day-ahead market. For the gas
turbine, the minimum price is more or less equal to the upward adjustment price, given
its zero profit at that price.
Discussion and conclusions
Based on our analysis of the intraday market in 2023, there is a positive business case
for both a CCGT power plant or in GT generation. The main driver for the business case
is the increased demand for flexibility to balance the programmes submitted by
balancing responsible parties. This demand is driven by the forecast error of wind
production 24 hours in advance of real time. In addition, energy companies will want to
reserve capacity for intraday not to be exposed to high and uncertain intraday prices.
In equilibrium, the price on the intraday market will include a scarcity rent, in the hours
of peak demand, which is needed for generators to recoup their fixed investment costs.
This will also hold for the day ahead market. More generally, it is to be expected that
prices on the day-ahead market and the intraday market will tend to converge up to a
certain level because generators will have the choice at which market they want to bid
in their production. While intraday markets can be expected to have a higher price, due
to the higher scarcity of capacity intraday, a too large difference will incite generators to
bid more on the intraday market and less on the day-ahead market, thereby driving
down prices on the intraday market
Flexibility constraints on CCGT power plants to some extent limit their use to provide
flexibility. It is to be expected that this will increase with larger levels of renewables and
therefore larger production swings from hour to hour.
ECN-E--14-039 31You can also read