The Benefits of Protective Advanced Clean Car Standards in Colorado - An Examination of Cost Savings, Greenhouse Gas Emission Reductions, and ...
←
→
Page content transcription
If your browser does not render page correctly, please read the page content below
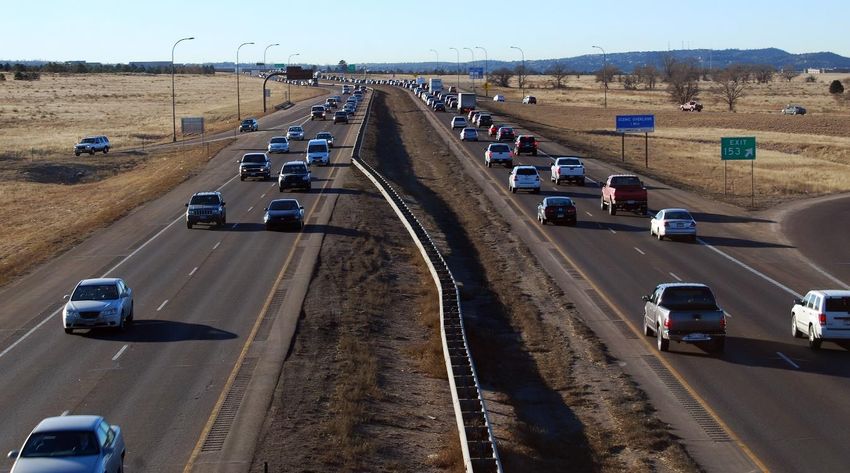
The Benefits of Protective Advanced
Clean Car Standards in Colorado
An Examination of Cost Savings, Greenhouse Gas
Emission Reductions, and Health Benefits

Author
Richard Rykowski

May 2018

Photo credit: U.S. Air Force /Don Branum
About the author:
Richard Rykowski holds B.S. and M.S. degrees in Chemical Engineering from the University of
Michigan. He worked for the U.S. Environmental Protection Agency on the development of fuel and
emission standards for over 32 years and retired in 2011. He helped develop EPA’s RVP, reformulated
gasoline, and ultra-low sulfur standards for gasoline and diesel fuel. He also helped develop standards
for particulate emissions from light and heavy-duty diesel vehicles and off-road diesel equipment, as
well as greenhouse gas emission standards for light-duty vehicles. He was also a key architect in the
development of EPA’s OMEGA Model. He received EPA’s Engineer of the Year Award, as well as several
Gold and Silver Medals for Meritorious Service.

This report was prepared with support from Environmental Defense Fund, a non-profit, non-
governmental, non-partisan environmental advocacy group with over two million members. Guided by
science and economics, Environmental Defense Fund is committed to practical and lasting solutions to
the most serious environmental problems. For more information, please visit www.edf.org.

                                                                                                       1
Contents
Executive Summary ..............................................................................................................................................3
Cost savings to Colorado consumers .........................................................................................................3
Lower greenhouse gas and other air pollutants in Colorado ................................................................5
Health benefits in Colorado ............................................................................................................................5
Long-term automotive technology innovation and emissions reductions ........................................6
Introduction .............................................................................................................................................................7
Background .............................................................................................................................................................7
Greenhouse gas emission control scenarios ............................................................................................. 10
Development of a Colorado-specific vehicle fleet ..................................................................................... 12
Modified vehicle fleet prior to Colorado adoption of Clean Car Program ....................................... 13
Colorado ZEV sales needed to comply with the Advanced Clean Car Program ........................... 14
Vehicle sales in Advanced Clean Car States and outside this region ......................................... 15
Vehicle compliance costs under a Colorado Advanced Clean Car Program ............................. 15
Vehicle compliance costs using EPA technology assessments ....................................................... 16
ZEV costs ...................................................................................................................................................... 18
Vehicle compliance costs using recent, lower cost data .................................................................... 20
Lifetime fuel savings and payback periods ................................................................................................. 23
Greenhouse gas emission impacts ............................................................................................................... 25
Criteria emissions .............................................................................................................................................. 29
Health impacts..................................................................................................................................................... 33
2Executive Summary
Colorado can achieve a wide range of economic, environmental, and health benefits by adopting the
Advanced Clean Car Program already in place in 10 other states. Doing so in 2018 is particularly timely
given that federal government is threatening to roll back the greenhouse gas (GHG) emissions
standards that are scheduled to become more stringent each year through 2025 and that gasoline prices
are rising and at 4-year highs for Colorado drivers.
In 2010 and 2012, the Environmental Protection Agency (EPA) adopted standards to reduce
greenhouse gas (GHG) emissions from cars and trucks built in model years (MYs) 2012–2025. EPA
projected that the combined National Program for MYs 2012-2025 would save families more than
$1.7 trillion dollars and reduce GHG emissions by 6 billion metric tons over the lifetime of the vehicles
sold in MYs 2012-2025.1 Although these standards were the result of an unprecedented consensus-
building negotiation among the federal government, state governments, automakers, labor,
environmental groups, and consumer groups, reports have indicated that EPA Administrator Scott
Pruitt will soon take action to significantly relax the 2021-2025 GHG standards, with the most likely
outcome being a proposal to freeze the level of the current 2020 standards until at least 2025. If
Administrator Pruitt pursues this course of action, states like Colorado will face significant impacts,
including both substantial increases in GHG and criteria pollutant emissions (e.g., fine particulate,
ozone precursors) and significantly higher fuel costs for consumers due to less efficient vehicles that use
more fuel.
Should EPA act to relax its GHG standards, an alternative exists for individual states like Colorado. The
Clean Air Act allows the State of California to adopt separate vehicle emissions standards, and also
permits other states to adopt California’s vehicle standards. So far, 9 other states across the country
have taken advantage of this approach and adopted California’s Advanced Clean Car Program.
Accordingly, Colorado could preserve the benefits now at risk due to Administrator Pruitt’s threatened
regulatory roll back by adopting the California vehicle standards (which are currently the same as EPA’s
current greenhouse gas and criteria pollution standards) along with the California zero-emission vehicle
(ZEV) program (referred to, collectively, as the Advanced Clean Car Program).
This report analyzes the costs and benefits to Colorado and its residents if Colorado adopts the
Advanced Clean Car Program, compared to a scenario where the EPA standards are frozen at 2020
levels and Colorado takes no action. We summarize our key findings below.
Cost savings to Colorado consumers
The net costs to consumers in Colorado to implement the Advanced Clean Car Program would be
negative – meaning that the program would not only reduce pollution, but also lead to cost savings for
Coloradans. This paper uses EPA’s OMEGA automotive technology optimization model, and two sets of
vehicle technology cost assumptions, to evaluate the impacts of Colorado’s potential action on the
owner of a Model Year 2025 vehicle. The first set of vehicle technology cost assumptions is based on
those that EPA used in its original January 2017 Final Determination that reaffirmed the 2022-2025
GHG standards.2 The second, lower, set of vehicle technology cost assumptions is based on updated
1USEPA Regulatory Announcement, EPA-420-F-12-051, August 2012.
2USEPA Final Determination on the Appropriateness of the Model Year 2022-2025 Light-Duty Vehicle Greenhouse Gas
Emissions Standards under the Midterm Evaluation, U.S. EPA, EPA-420-R-17-001, January 2017.
3cost estimates based on information developed by the International Council for Clean Transportation
(ICCT) and electric battery costs published in Bloomberg.
This paper also utilizes two projections of future fuel prices. Both come from the 2016 Annual Energy
Outlook (2016AEO) developed by the Energy Information Administration (EIA), which is part of the
U.S. Department of Energy: 1) the reference case, which they considered to be their best estimate of
future fuel prices, and 2) the high crude oil price case, which is as described. Gasoline prices have risen
by over 50 cents per gallon over the last 18 months, to a 4-year high, and are already at the level
projected for 2025 in EIA’s reference case. In this executive summary, we present fuel savings using
future fuel price projections that are the arithmetic average of the AEO2016 reference and high crude
oil price cases. In the body of the report, we present fuel savings for the reference and high crude oil
price cases separately.
Table ES-1 shows, for the Colorado Advanced Clean Car Program, key economic metrics relative to a
baseline where the EPA GHG standards are frozen at 2020 levels. These metrics include average initial
vehicle cost increases (with the range reflecting the two sets of technology cost assumptions described
above), lifetime consumer fuel savings due to lower vehicle fuel consumption (using the average fuel
price projections from the two AEO2016 cases described above and a discount rate of 3%), the payback
period for consumers who purchase a new vehicle with cash (the payback period represents the “break
even” point, and the vehicle will continue to achieve fuel savings until it is retired from the fleet), and
net consumer lifetime savings (as the lifetime fuel savings far exceeds the average vehicle cost increase).
Table ES-1 also accounts for Colorado and Federal tax credits for electric vehicles, which further
accelerate consumer payback periods should Colorado adopt the Advanced Clean Car Program.
Table ES-1: Key Consumer Economic Metrics for MY 2025
Vehicles Under the Colorado Advanced Clean Car Program
Average Lifetime Payback Net Consumer
Vehicle Cost Fuel Savings (years) Savings
No ZEV Tax Credit $1,503-1,779 4.9-6.0 $2,452-2,771
CO ZEV Tax Credit $1,054-1,330 $4,231-4,274 3.3-4.3 $2,901-3,220
CO + US ZEV Tax Credits $382-647 1.2-2.0 $3,584-3,892
As Table ES-1 shows, adopting the Advanced Clean Car Program offers Colorado consumers the lowest
average up front vehicle cost increase and shortest payback period when considering available Colorado
and Federal ZEV tax credits. Taking fuel savings and currently available tax credits into account,
consumers purchasing vehicles outright would see payback periods as short as 1.2-2.0 years, and every
dollar invested in new technology will ultimately save 6 to 11 more dollars in future fuel savings. But,
even when all tax credits are excluded from the analysis, the lifetime fuel savings still exceed the higher
up front cost by more than a 2-to-1 factor.
While the analysis reflected in Table ES-1 assumes that consumers purchase their vehicles with cash, it
is important to highlight that the 60% of consumers that purchase new vehicles with loans will have a
positive cash flow immediately as the monthly fuel savings due to more efficient vehicles, will exceed
the increase in the monthly loan payment due to more expensive vehicle technology.
The final column in Table ES-1 shows that, under a Colorado Advanced Clean Car Program, the net
consumer lifetime savings (lifetime fuel savings minus incremental average vehicle cost) will vary from
4$2,452-3,892. Assuming total new vehicle sales in Colorado of 285,000 vehicles per year in 2025, this
means that Coloradans would save $700 million to $1.1 billion, depending on the tax credits, over the
lifetimes of the MY 2025 vehicles. These savings would grow in the post-2025 timeframe if Colorado
adoption of the Advanced Clean Car Program continued to promote automotive technology innovation
that would entail lower technology costs and greater technology effectiveness over time.
Lower greenhouse gas and other air pollutants in Colorado
Should Colorado adopt the Advanced Clean Car Program, GHG emissions (carbon dioxide equivalent
(CO2e)) would decrease by 2.4 million metric tons in 2030 and by 4.3-4.4 million metric tons in 2040.
Roughly 90% of these emission reductions would be within the confines of Colorado.
Table ES-2 presents the impacts of the Colorado Advanced Clean Car Program on emissions of criteria
pollutants within the confines of Colorado, assessing these benefits both with and without anticipated
California Tier 4 emission standards for criteria air pollutants. The parentheses show that Colorado
emissions for each of these pollutants would be lower under the Colorado Advanced Clean Car Program.
Table ES-2: Criteria Emissions Impacts in Colorado Relative to Relaxed EPA GHG
Standards (U.S. tons per year)
VOC NOx PM2.5 SOx
Without Benefit of California Tier 4 Emission Standards
2030 (586) (216) (36) (89)
2040 (1247) (834) (97) (159)
With Benefit of California Tier 4 Emission Standards
2030 (687) (308) (45) (89)
2040 (1960) (1590) (153) (159)
Because the net cost of adopting the Colorado Advanced Clean Car Program is negative, i.e., the lifetime
consumer fuel savings exceed the incremental vehicle technology costs, the cost per ton of achieving
these emission reductions are also negative.
Health benefits in Colorado
We used EPA’s COBRA model in conjunction with the emission reductions shown in Table ES-2 to
estimate the monetized value of health impacts of a Colorado Advanced Clean Car Program. In 2030,
the annual value of health benefits of adopting the Advanced Clean Car Program ranged from
$6-13 million, increasing to $16-37 million in 2040. All of these health impacts are due to changes in
ambient PM levels and do not include any value associated with reduced ozone or GHG which would, of
course, enhance these benefits.
5Long-term automotive technology innovation and emissions reductions
While the analysis in this report primarily focuses on the 2025 timeframe, the benefits of the Colorado
Advanced Clean Car Program would extend beyond near term cost savings and emission benefits. The
ZEV component of the Advanced Clean Car Program is the single greatest driver of ongoing innovation
in electric vehicle technology and is essential if Colorado and the rest of the country are to reach long-
term climate and air quality goals. Battery electric vehicles hold the most promise of any vehicle
technology to reduce long-term GHG emissions, especially when the electricity is supplied by renewable
resources. They also hold great promise in reducing emissions and improving air quality in urban and
suburban areas. In the process, they also bring new investment in technology and infrastructure. And
adopting the Advanced Clean Car Program in Colorado would increase consumer choice for vehicles, as
experience in other states shows that a wider range of electric vehicles are offered in states that adopt
such programs.
6Introduction
This report examines the vehicle cost, fuel savings, and emission consequences in Colorado of EPA
weakening its current greenhouse gas (GHG) standards for cars and light trucks for the 2021 model
year (MY) and beyond. EPA recently announced that it was rescinding its January 2017 Final
Determination that the 2022-2025 GHG standards were feasible and appropriate and that it was
considering modifications to the 2021 standard, as well.3 While EPA has not yet taken final action
weakening the 2021-2025 standards, for the purposes of this analysis and consistent with recent
reporting, we assume that the relaxation of the GHG standards will be significant, potentially
maintaining the 2020 standards indefinitely.
The remainder of this report lays out an action which Colorado could take in response to such a
weakening of federal standards and estimates the state-specific impacts of this action on vehicle costs,
consumer fuel savings, and emissions of GHG and criteria pollutants. The report also estimates health
impacts associated with this action. The methodology underpinning this analysis is consistent with
previous analyses conducted by EPA in these areas, such as those used in its Proposed4 and Final
Determinations5 regarding the 2022-2025 GHG standards for cars and light trucks. We also build on
these analyses by assessing the potential to further reduce compliance costs by considering future
technological advancement in both GHG control technology and vehicle electrification.
Background
The U.S. currently has a “one-vehicle” program for regulating GHG emissions. While both EPA and the
state of California have their own regulatory programs for light-duty vehicles, California and federal
standards are currently aligned. The only exception pertains to the Zero Emission Vehicle (ZEV)
Program, which has no federal corollary. Thus, in addition to complying with the GHG standards,
vehicle manufacturers must demonstrate compliance with the California ZEV Program in California
and in the nine other states that have adopted the California Advanced Clean Car Program.6 Because
Section 177 of the Clean Air Act permits other states to adopt the California vehicle emission control
program, these states are commonly referred to as the Section 177 states. Here, we will refer to
California and the other nine states as the “Advanced Clean Car States.”
As described above, Administrator Pruitt recently revoked EPA’s previous determination that the MY
2022-2025 standards remained appropriate, indicating in a new Final Determination his view that
these standards were no longer feasible.7 EPA has indicated that it will review the level of the 2021
standards, as well as the 2022-2025 standards and, as indicated in recent press reports, EPA could
decide to hold the MY 2021 and later GHG standards constant at their 2020 levels.
Table 1 shows EPA’s most recent projection of the average CO2 emissions from cars and light trucks
under its GHG standards for the 2020-2025 MYs. These standards apply to emissions over two EPA
3 82 Fed. Reg. 39,551.
4
Proposed Determination on the Appropriateness of the Model Year 2022-2025 Light-Duty Vehicle Greenhouse Gas
Emissions Standards under the Midterm Evaluation, U.S. EPA, EPA-420-R-16-020 November 2016.
5
Final Determination on the Appropriateness of the Model Year 2022-2025 Light-Duty Vehicle Greenhouse Gas Emissions
Standards under the Midterm Evaluation, U.S. EPA, EPA-420-R-17-001 January 2017.
6 The nine states which have opted into the California vehicle program are: Connecticut, Maine, Maryland, Massachusetts, New
Jersey, New York, Rhode Island, Vermont, and Oregon.
7 82 Fed. Reg. 14,671
7test cycles—one focusing on city driving and one focusing on highway driving—and also vary depending
on the vehicle’s footprint, which is measured in square feet and is the product of a vehicle’s wheelbase
and its track width (in lay terms, the area defined by the centers of the four tires touching the ground).
Since vehicles have widely varying sizes and their relative sales vary from year to year, the sales-
weighted, fleet-average footprint varies from year to year. Thus, the applicable GHG standard for the
average vehicle will vary and can only be known with certainty after the fact.
Table 1: Projected Fleet-Wide CO2 Emissions Under the Current EPA GHG
Standards (g/mi)
Model Year Cars Light Trucks Light-Duty Fleet
2020 187 266 226
2021 177 246 211
2022 169 234 201
2023 162 223 191
2024 154 212 182
2025 147 202 173
California has already determined that the 2022-25 standards are appropriate8, and so, should
Administrator Pruitt now weaken the standards as he has indicated, this would return the U.S. to a two-
vehicle GHG program with the California standards applicable in 10 states and the weaker federal
program applicable elsewhere. This potential for a two-vehicle GHG program in 2021 and beyond is the
backdrop for the analysis conducted in this report.
To assess the potential benefits of Colorado adopting the Advanced Clean Car Program, we assume EPA
relaxes its current GHG standards by effectively holding the 2020 GHG standards constant indefinitely.
As Table 1 shows, under EPA’s existing standards, the fleet average CO2 emission level for the 2025 MY
is 53 g/mi lower than that for the 2020 MY. Weakening the standards by holding the 2020 standard
constant would increase CO2 emissions from light-duty vehicles by 31% in 2025. Should EPA take a less
extreme approach to weakening the standards, the lost greenhouse gas benefits would be lower, but still
substantial.
In addition to addressing GHG emissions, the Advanced Clean Car Program also includes standards for
criteria air pollutants, including volatile organic compounds (VOC), nitrogen oxides (NOx), and fine
particulate matter (PM2.5). California is in the process of developing strengthened “Tier 4” emission
standards for VOC, NOx, and PM2.5 emissions. Adopting the Advanced Clean Car Program would
likewise encompass California’s criteria emission standards applicable to cars and light trucks. Thus, in
addition to having a cleaner motor vehicle fleet with respect to GHG emissions, vehicles sold in
Colorado would also have lower VOC, NOx and PM2.5 emissions. Adopting the Advanced Clean Car
Program would provide Coloradans with significant climate and health benefits.
The other aspect of the Advanced Clean Car Program is the California ZEV program. The California ZEV
program consists primarily of a set of minimum “ZEV” sales requirements. The ZEV sales requirements
for 2018 MY and beyond are shown in Table 2.
8California's Advanced Clean Cars Midterm Review Summary Report for the Technical Analysis of the Light Duty Vehicle
Standards, California EPA, Air Resources Board, January 18, 2017,
https://www.arb.ca.gov/msprog/acc/mtr/acc_mtr_finalreport_full.pdf.
8Table 2: California ZEV Program
Model Year Total ZEV Credit Required Max. Compliance Using
PHEV
2018 4.50% 2.50%
2019 7.00% 3.00%
2020 9.50% 3.50%
2021 12.00% 4.00%
2022 14.50% 4.50%
2023 17.00% 5.00%
2024 19.50% 5.50%
2025 and beyond 22.00% 6.00%
Table 2 shows that the ZEV credit requirement is 9.5% for the 2020 MY, increasing to 22% for 2025
and beyond. When assessing these percentages, it is important to underscore that a single electrified
vehicle can generate more than one ZEV credit. For example, a battery powered vehicle with no gasoline
engine (BEV) and a 200 mile range on a single charge generates 3.36 ZEV credits. A plug-in hybrid
electric vehicle (or PHEV, a vehicle with both an electric battery/motor and a gasoline engine) capable
of 40 miles of electric-only operation on a single charge generates 1.07 ZEV credits. In addition to
setting minimum ZEV credit levels for ZEVs, the California ZEV program also limits the number of ZEV
credits which can be generated by PHEVs. The last column of Table 2 shows these caps on ZEV credits
from PHEV sales. This cap effectively requires manufacturers to sell a minimum number of BEVs in
meeting the overall ZEV credit requirement.
Under the current “one-vehicle,” national GHG emission program, manufacturers must comply with the
GHG emission standards shown in Table 1 across their entire national sales and comply with the ZEV
credit requirements with their sales in California and the other nine Advanced Clean Car States.
9Greenhouse gas emission control scenarios
Table 3 describes the three GHG emission control scenarios considered in this analysis. Each scenario
affects three relevant areas of the country: 1) California and those states which have adopted the
Advanced Clean Car Program (GHG and ZEV standards), 2) the remaining states other than Colorado,
and 3) Colorado. Since Colorado currently is not one of the states which has adopted the Advanced
Clean Car Program, without any action on Colorado’s part, the GHG standards in Colorado would be
those that apply in the remaining states.
One advantage for Colorado associated with adopting the Advanced Clean Car Program is that this
program already exists. Mechanisms also exist for certifying vehicles and tracking their sales in the
Advanced Clean Car States. For criteria pollutants, California handles vehicle certification.
Manufacturers usually opt to provide California with their vehicle sales for California and all 177 states
combined. Colorado would need to ensure that only California certified vehicles were sold in the state, if
they so desired. Thirteen states other than California are already doing this, the first starting in 1993.
California likewise handles the certification of ZEVs for compliance with the ZEV program. Advanced
Clean Car States have to keep track of ZEV sales and submit them to California. Compliance with the
ZEV program requirements is determined using sales broken down into three regions: 1) California, 2)
eastern Advanced Clean Car S tates, and 3) western Advanced Clean Car States. Colorado would
presumably join the western Advanced Clean Car States region which currently only consists of Oregon.
Thus, compliance is addressed centrally and not done by individual Advanced Clean Car States.
Regarding the California GHG standards, there is currently no separate compliance process.
Compliance with EPA’s national GHG standards is considered to provide compliance with California’s
GHG requirements. Should EPA relax its standards and California retain its standards, this mutual
compliance arrangement will no longer exist. We anticipate that the separate Advanced Clean Car
Program GHG compliance process would be similar to that for either the criteria emissions or ZEV
Program, requiring minimal effort on the part of Advanced Clean Car States.
The focus of this analysis is to assess the emissions and health impacts of Colorado adopting the
Advanced Clean Car Program.
Table 3: 2025 Scenarios
Advanced Clean Remaining States Colorado
Car States other than Colorado
Current Standards Table 1 GHG Table 1 GHG Table 1 GHG
standards plus ZEV standards standards
program
Potential Relaxed Table 1 GHG 2020 MY GHG 2020 MY GHG
Scenario standards plus ZEV Standards in Table 1 Standards in Table 1
program
Colorado Clean Car Table 1 GHG 2020 MY GHG Table 1 GHG
Program standards plus ZEV Standards in Table 1 standards plus ZEV
program program
The first scenario in Table 3 shows the GHG and Advanced Clean Car State standards currently in place.
As mentioned above, Colorado is part of the large group of states where manufacturers simply have to
comply with the national GHG standards shown in Table 1. The second scenario shows the impacts of
10EPA weakening the federal standards in Colorado, assuming Colorado does not adopt the Advanced
Clean Car Program. The third scenario shows how adopting the Advanced Clean Car Program would
protect Colorado against a weakening of the federal standards. There are lead-time requirements
associated with a state adopting the Advanced Clean Car Program. It is unlikely that Colorado could
adopt the Advanced Clean Car Program in time for it to be effective for the 2021 MY. Thus, we assume
here that, if Colorado would decide to adopt the Advanced Clean Car Program, it would be effective with
the 2022 MY.
To evaluate the costs and benefits of the three scenarios described in Table 3, we must first develop a
Colorado-specific vehicle fleet, including an estimate of current ZEV sales in the state of Colorado. The
next section describes how we modified the composition of the new vehicle fleet as projected by EPA to
account for current ZEV sales in Colorado.
11Development of a Colorado-specific vehicle fleet
In support of EPA’s Proposed Determination, the agency developed a description of the 2015 model
year (MY) light-duty vehicle fleet, including sales by vehicle model. EPA used this 2015 baseline fleet to
project the 2025 MY fleet, assuming the characteristics of each vehicle model remained the same.
However, sales across manufacturers, cars and light trucks, and vehicle categories (e.g., compact cars
and small multi-purpose vehicles (MPVs)) were adjusted using private and governmental sources
(including, for example, the Annual Energy Outlook published by the Department of Energy and a long-
range vehicle sales forecast purchased from IHS-Polk Automotive).9
EPA modified this 2025 fleet further to account for the requirements of California’s ZEV program
applicable in Advanced Clean Car States. As described in Table 2 above, in 2025, California requires
that manufacturers generate ZEV credits equivalent to 22% of their 2025 sales, with at most 6% of these
credits coming from PHEVs. The ZEV credits assigned to each BEV or PHEV sold are a function of the
all-electric range of the vehicle. Several manufacturers are presently marketing ZEVs in the U.S.
However, the level of these sales in 2015 is inadequate to meet the California ZEV program
requirements for 2025. EPA projected that the additional ZEVs needing to be sold in 2025 would have
an all-electric range which achieves the greatest number of ZEV credits per vehicle: essentially 200
miles for BEVs (3.36 ZEV credits per vehicle) and 40 miles for PHEVs (1.07 ZEV credits per vehicle).
EPA also assumed that manufacturers would maximize the generation of ZEV credits from PHEVs (6%
as shown in Table 2) and generate their remaining ZEV credits from BEV sales.
EPA’s projection of the 2025 fleet starts from the number of BEVs and PHEVs sold in 2015. Using the
all-electric range of each of these current BEVs and PHEVs and estimates of the fraction of each
manufacturer’s EVs sold in Advanced Clean Car States, EPA determined the number of ZEV credits that
these vehicles would generate in the 2025 reference fleet. EPA then estimated how many additional
PHEVs and BEVs would need to be sold to meet the ZEV program requirements in the Advanced Clean
Car States. EPA then added these PHEVs and ZEVs to its 2025 reference fleet, reducing sales of non-EV
(internal combustion engine or ICE) vehicles in those vehicle categories technically capable of being
converted to BEV or PHEV designs. With respect to specific manufacturers, EPA proportionately
reduced ICE vehicles capable of electrification so that the sales of each manufacturer in 2025 remained
at the same level before and after accounting for the ZEV program.
We made two changes to the 2025 EPA reference fleet to assess the impact of Colorado adopting the
Advanced Clean Car Program. First, ZEV sales significantly increased in Colorado in the 2017 MY due to
an increase in the Colorado tax credit available to ZEV purchasers. As this change occurred after 2015, it
is not reflected in either EPA’s 2015 baseline or 2025 reference fleets. Thus, our first adjustment was to
reflect these increased sales of ZEVs in Colorado in 2017 to the 2025 reference fleet for Colorado.
Second, we projected the number of additional PHEVs and BEVs which would need to be sold by each
manufacturer to comply with the ZEV program’s requirement, notwithstanding the fact that the ZEV
program does not require each participating state to individually meet these targets. Each of these
modifications is described further below.
9Chapter 1, Proposed Determination on the Appropriateness of the Model Year 2022-2025 Light-Duty Vehicle Greenhouse
Gas Emissions Standards under the Midterm Evaluation: Technical Support Document, U.S. EPA, EPA-420-R-16-021
November 2016; The data and process used by EPA to develop the 2015 baseline fleet and 2025 reference fleet are described in
the Draft Technical Assessment Report: Midterm Evaluation of Light-Duty Vehicle Greenhouse Gas Emission Standards and
Corporate Average Fuel Economy Standards for Model Years 2022-2025 (TAR) published in July 2016.
12Modified vehicle fleet prior to Colorado adoption of Clean Car Program
Table 4 shows ZEV sales data for the state of Colorado in 2015 and 2016 which were provided by state
personnel. This data was provided for each manufacturer, but only fleet-wide totals are shown below.
Table 4: ZEV Sales in Colorado
BEV PHEV Total
Provided by State Personnel
2015 1,278 486 1,774
2016 --- --- 2,711
AAM website
2015 1,277 621 1,898
2016 1,571 1,140 2,711
2016 (8 months) 895 670 1,565
2017 (8 months) 1,882 827 2,709
2017 (estimated) 3,303 1,407 4,693
Ratio: 2017/2015 2.587 2.266 ---
Projection Used in this Study
2017 (estimated) 3,585 790 4,376
The state did not have data for 2017, when sales were expected to increase significantly due to the
increase in state-funded credits for ZEV purchases. To estimate Colorado sales by manufacturer in
2017, we used the fleet-wide sales estimates for BEVs and PHEVs for Colorado from the Alliance of
Automobile Manufacturers (AAM),10 which are also shown in Table 4. The AAM and Colorado state
data match very closely for EVs sold in 2015 and total BEV and PHEV sales in 2016. The reason for the
different estimate for PHEVs in 2015 could not be determined. However, this difference has no
substantive impact on our analysis.
The AAM tool allows sales to be estimated by month and included data for 8 months of 2017 (i.e.,
through August of that year). To estimate total sales in 2017, we assumed that the ratio of total to 8-
month sales in 2016 and 2017 were the same and scaled the 2017 8-month totals accordingly. We then
applied the ratio of 2017 to 2015 sales from the AAM data to 2015 sales data from Colorado staff to
derive estimated 2017 sales, which are shown in the last section of Table 4.11
These figures include one further manufacturer-specific adjustment. In 2015, GM sales consisted
entirely of PHEVs. However, by 2017, GM had introduced the Bolt BEV. To approximate this model
introduction, we assumed that GM PHEV sales were the same in 2017 as 2015 and that any growth in
2017 sales were due to the Bolt.
We added these additional 2017 vehicle sales to EPA’s 2025 reference fleet by increasing the sales of
PHEVs and BEVs already present in the baseline fleet. There were a few cases where a manufacturer
had sold PHEVs or BEVs in 2017 but sold no such vehicles in 2015 and therefore had no PHEVs or
BEVs in the 2015 EPA baseline fleet. In these cases, we allocated the additional 2017 ZEV sales to
PHEVs or BEVs models added by EPA to represent new ZEVs needed to meet CA ZEV program
10 https://autoalliance.org/energy-environment/zev-sales-dashboard/
11
Since the time of this analysis, the AAM database has been updated to include all 2017 sales. They indicate that our
projection of 2017 PHEV sales was slightly low and our projection of BEV sales was somewhat high. The differences are very
small relative to the number of PHEVs and BEVs which would needed to be added to Colorado sales under the Clean Car
Program. Thus, these differences would not affect the results of this analysis in any significant way.
13requirements. At this point in the process, we did not project any further increase in ZEV sales in
Colorado absent adoption of the ZEV program. This is consistent with EPA’s modeling in support of its
review of the 2025 standards, where all vehicle technology in the reference case is held at the level
found in the 2015 fleet (i.e., the most recent historical, or verifiable fleet).
Colorado ZEV sales needed to comply with the Advanced Clean Car
Program
EPA used two steps to estimate the additional ZEV sales in the Advanced Clean Car States needed to
comply with the Advanced Clean Car Program in 2025.12 First, EPA determined each manufacturer’s
ZEV sales in these states which were already present in its 2025 reference fleet. As mentioned above, for
each model year after 2015, EPA developed projections of each vehicle model’s sales using growth
factors for total vehicle sales, changes in car/truck sales ratio and shifts in vehicle preferences (for
example, compact cars versus small multi-purpose vehicles (MPVs)).13 These growth factors applied
equally to ZEVs and gasoline or diesel-powered vehicles. EPA made the same adjustments to ZEV
model sales as were made to gasoline or diesel power vehicle sales.
Second, EPA determined the number of additional ZEVs manufacturers needed to sell to comply with
the ZEV program in the Advanced Clean Car States. As mentioned above, EPA assumed that
manufacturers would maximize PHEV credits subject to the California program’s constraints (6% ZEV
credits attributable to PHEVs). EPA assumed these PHEVs would have an all-electric range of at least
40 miles, and so each would generate 1.07 ZEV credits. EPA assumed the remaining required ZEV
credits (16%) would be satisfied by the sale of BEVs with a 200 mile range, each of which would
generate 3.36 ZEV credits per 200-mile BEV sold.
EPA subtracted the 2025 projected sales of PHEVs and BEVs in the Advanced Clean Car States (step 1)
from the required levels (step 2) to determine the number of additional ZEVs needed to meet the
program requirement. EPA added these additional ZEV sales to specific manufacturers’ 2025 fleets by
adding new ZEV vehicle models.
We used this process to determine the number of additional ZEV sales that would be needed in
Colorado to comply with the ZEV element of the Advanced Clean Car Program. In the process of
determining compliance with the ZEV program in the Advanced Clean Car States, EPA obtained data on
the breakdown of each manufacturer’s U.S. sales inside of and outside of the Advanced Clean Car
States. As Colorado is currently outside of the Advanced Clean Car States, we assumed that Colorado’s
sales by manufacturer matched that developed by EPA for the non-Advanced Clean Car States. We
estimated total vehicle sales in Colorado by multiplying sales outside of the Advanced Clean Car States
by the ratio of Colorado’s population (5,540,545) to that of the non-Advanced Clean Car States
(91,450,417)14. This resulted in 2015 estimated vehicle sales in Colorado of 287,000 and 2025 sales of
285,000. We then applied the ZEV percentage requirements to each manufacturer’s 2025 sales in
Colorado and subtracted the Colorado ZEV sales shown in Table 4 (extrapolated to 2025). The result
was that an additional 11,001 BEVs and 14,558 PHEVs would need to be sold in Colorado in 2025
12 EPA’s documentation in its Draft Technical Assessment Report and its Proposed Determination provide a more detailed
description of this process.
13 EPA developed these projections based on a combination of private and governmental data, including, for example, the
Annual Energy Outlook published by the Department of Energy.
14 "Annual Estimates of the Resident Population for the United States, Regions, States, and Puerto Rico: April 1, 2010 to July 1,
2016" (XLSX). United States Census Bureau. Retrieved 8 June 2017. We related Colorado’s population to the non-Advanced
Clean Car States population as we already had available the split of each manufacturer’s sales in the Advanced Clean Car States
and non-Advanced Clean Car States areas.
14should the state adopt the Advanced Clean Car Program. Numerous manufacturers have announced
plans to introduce PHEVs and BEVs in the next few years. California’s midterm review of the 2022-
2025 GHG standards mentioned above contains an extensive analysis of current and future ZEV
technology, sales and cost. It appears that consumers will have a wide range of vehicles to choose from
when considering the purchase of a ZEV.
We allocated these sales to the new ZEV models EPA added to the fleet to simulate manufacturers’
compliance with the ZEV program in the Advanced Clean Car States. We spread these ZEV model sales
across manufacturers proportionately and also proportionately reduced the sales of ICE vehicles that
EPA identified as convertible to ZEV such that total manufacturer sales remained constant. Finally, we
shifted projected Colorado vehicle sales to the Advanced Clean Car States sales fleet.
Vehicle sales in Advanced Clean Car States and outside this region
When EPA evaluated the costs of various GHG scenarios for the final rule establishing the 2017-2025
standards and for the Proposed Determination reviewing the feasibility of the 2022-2025 standards,
EPA always modeled a single national fleet of vehicle sales. All vehicles, whether sold in the Advanced
Clean Car States or outside of this region, were assumed to meet the same GHG standards. The only
difference between vehicles in the two regions was that those sold in the Advanced Clean Car States also
met the requirements of the ZEV program. Effectively, the Advanced Clean Car Program increased the
number of ZEVs sold across the entire U.S. to a smaller degree than it did in the Advanced Clean Car
States. As the Advanced Clean Car Program had already been established prior to the 2017 and later
GHG standards, the ZEVs needed to meet the program’s requirements in the Advanced Clean Car States
were added to the 2025 vehicle fleet prior to the evaluation of the cost of the GHG standards.
For the purposes of our analysis, we assume that EPA will relax its GHG standards and California will
retain its GHG standards. Thus, manufacturers will be complying with two distinct sets of GHG
standards in the two regions of the U.S. This requires that EPA’s OMEGA model be run separately for
the two regions. This constitutes the primary difference between the costs developed by EPA with the
OMEGA model and those developed here.
We separated total U.S. sales into sales in the two regions using the breakdowns of each manufacturer’s
sales in the two regions. These data were the same sales splits that EPA used to determine the number
of ZEVs to add to the fleet to enable compliance with the Advanced Clean Car Program in the Proposed
Determination. As described above, they were also used here to determine the number of additional
ZEV sales needed in Colorado should Colorado adopt the Advanced Clean Cars Program.
As the sales split for each manufacturer applied to total car plus light truck sales, we applied them to
total sales. Thus, the breakdown of each manufacturer’s sales by model inside and outside of the
Advanced Clean Car States region is the same. The percentage of each manufacturer’s U.S. sales in the
Advanced Clean Car States differs. As Colorado is not currently one of the Advanced Clean Car States,
its breakdown of sales by manufacturer and model reflect that of the non-Advanced Clean Car States.
Under the scenario where Colorado does not opt into the Advanced Clean Car Program, Colorado sales
remain with those of the non-Advanced Clean Car States. Under the scenario where Colorado opts into
the Advanced Clean Car Program, Colorado sales in their entirety move out of the non-Advanced Clean
Car States region and into the Advanced Clean Car States region.
Vehicle compliance costs under a Colorado Advanced Clean Car Program
We next estimated the costs of each scenario identified in Table 3 above. For the first two scenarios, we
15developed vehicle cost estimates for the 2025 model years, as was done by EPA in the Proposed
Determination. All of the inputs needed to determine costs in 2030 are present in the EPA digital files
used to develop the input files for the OMEGA model. The difference between technology costs in 2025
and 2030 in terms of real dollars are due to further “learning”. For most technologies, the effect of
learning over these five years is small: 5% or less. For PHEVs and BEVs, however, projected costs in
2030 are significantly lower than in 2025. Thus, for the Colorado Advanced Clean Car Program, as it
would significantly increase the number of PHEVs and BEVs in the Colorado fleet, we developed PHEV
and BEV cost estimates for 2030. We substituted these 2030 PHEV and BEV costs for the 2025 costs.
For all three GHG scenarios, vehicle costs for all other control technologies (e.g., direction injection,
turbochargers, 8-speed transmissions, etc.) are those for 2025.
We developed two cost estimates using different estimates of the costs of various technologies. The first
uses EPA’s methodology from the Proposed Determination. The second uses more recent information
showing GHG reducing technology is associated with both lower cost and increased emission reduction
potential.
Vehicle compliance costs using EPA technology assessments
This set of compliance cost estimates relies entirely on the cost and effectiveness projections for
technology developed by EPA for the Proposed Determination. We evaluated EPA’s current GHG
standards using the single U.S. new vehicle sales fleet and with the two regional fleets discussed above.
The evaluation using U.S. sales is consistent with and comparable to EPA’s analysis in the Proposed
Determination. The separate evaluation of compliance costs for vehicles sold in the Advanced Clean Car
States and the remaining U.S. is helpful as it provides a basis for comparison.
The relaxed EPA scenario was also assessed using EPA’s OMEGA model. The only changes made to the
EPA input files to the model were to reflect the two regional fleets and the relaxation of GHG standards
for non-Advanced Clean Car States. Colorado is part of these non-Advanced Clean Car States in this
second scenario.
Estimating vehicle costs for the Colorado Advanced Clean Car Program is slightly more complicated.
Once the ZEVs needed to comply with the Advanced Clean Car Program are in the vehicle fleet, the
remaining cost to bring the entire Advanced Clean Car States fleet (including Colorado) into compliance
with the California GHG standards can be determined using the OMEGA model. However, the cost of
the additional ZEVs needed to comply with the Advanced Clean Car Program must be determined
outside of the OMEGA model. EPA’s OMEGA model is not designed to estimate the cost of a sales
requirement for a specific GHG control technology, like that required by the Advanced Clean Car
Program. Thus, we estimated these costs using EPA’s estimates of the cost per vehicle of PHEV and
BEV technology. These costs were developed and made available to the OMEGA model should a
manufacturer require this technology in order to meet the GHG standards.
As mentioned above, we will project the fuel savings resulting from the GHG standards using two sets of
fuel price projections. The OMEGA model utilizes fuel prices when projecting which technologies
manufacturers could use to meet the requisite GHG standards. We only used EIA’s fuel price
projections from the reference case of their 2016 AEO in our OMEGA model runs. We could have
duplicated these runs with EIA’s high fuel price projections. However, this would have had extremely
small effects on the technology added and the resulting vehicle cost. The reason for this is that the
technology being added by OMEGA is almost entirely applied to gasoline vehicles. Since a change in
gasoline price affects all the cost effectiveness of these technologies in the same way, there is little effect
16on the decision to add one technology versus another. We confirmed this by reviewing the results of
EPA modeling, performed for the Proposed and Final Determinations, using the exact same sets of
price projections being considered here: the AEO2016 reference case and the AEO2016 high fuel price
case. EPA evaluated the costs of both fuel price projections. The average vehicle cost to comply with the
2021 GHG standards was $25 higher with the high fuel price projections. The average vehicle cost to
comply with the 2025 GHG standards was $34 higher with the high fuel price projections. Thus, the
cost of complying with the 2025 GHG standards compared to the 2021 GHG standards was only $9
higher with the high fuel price projections. The higher compliance costs with higher gasoline prices was
likely due to a slight increase in the application of EV technology for manufacturers with the highest
average compliance costs. Even this small change is unlikely in our modeling of Colorado due to the
ZEV portion of the Advanced Clean Car program.
The results of the OMEGA modeling for the three scenarios are shown in Table 5. The costs applicable
to Colorado vehicles are highlighted in bold. The reader should note that all costs are incremental to
technology already being utilized in the 2015 MY new vehicle fleet.
Table 5: Additional Vehicle Costs Relative to the 2015 Fleet Under Various GHG Control
Scenarios ($2015 per vehicle)
Non-Advanced Advanced Clean All Vehicles Sold in U.S.
Clean Car States Car States
2025 EPA GHG Standards Modeled as a Single Fleet (from EPA’s Final and Proposed
Determinations)
No. of Vehicles Sold N/A N/A 16.4 million
Total Compliance N/A N/A $22.6 billion
Cost
Cost per vehicle N/A N/A $1378
2025 EPA GHG Standards Modeled as Two Vehicle Fleets
No. of Vehicles Sold 11.6 million 4.8 million 16.4 million
Total Compliance $17.4 billion $4.9 billion $22.3 billion
Cost
Cost per vehicle $1496 $1,024 $1,358
Non-Advanced Clean Car States Fleet Meets 2020 EPA GHG Standards, No Action by Colorado
No. of Vehicles Sold 11.6 million 4.8 million 16.4 million
Total Compliance $4.4 billion $4.9 billion $9.3 billion
Cost
Cost per vehicle $377 $1,024 $566
Non-Advanced Clean Car States Fleet Meets 2020 EPA GHG Standards, Colorado Adopts
Advanced Clean Car Program (Costs do not include the cost of additional ZEVs)
No. of Vehicles Sold 11.3 million 5.1 million 16.4 million
Total Compliance $4.3 billion $5.2 billion $9.5 billion
Cost
Cost per vehicle $377 $1,028 $578
The first two sections of Table 5 show the costs to meet EPA’s existing MY 2025 standards modeled
using two different analytical approaches. The first section estimates compliance costs for the entire
17country as whole, while the second estimates compliance costs separately for the Advanced Clean Car
States and non-Advanced Clean Car States. The results of these two approaches are very similar, with
only minor differences based on the scope of allowable credit trading and the approach to accounting
for upstream GHG emissions attributable to ZEVs. Our modeling also includes the additional ZEVs sold
in Colorado between 2015 and 2017.
The “two-vehicle” run of the model also shows, perhaps counterintuitively, higher per-vehicle costs in
the non-Advanced Clean Car States as compared to the Advanced Clean Car States. This is because the
ZEVs needed to meet the requirements in the Advanced Clean Car States have zero GHG emissions
(and very low GHG emissions even in EPA’s previous analysis), which allows the ICE vehicles in the
Advanced Clean Car States to have higher GHG emission levels than those in the other states and still
meet the standards. Neither our analysis nor the EPA analysis incorporates the cost of the ZEVs needed
to meet the Advanced Clean Car Program as this program pre-dates the EPA GHG program and is not
likely to change under any of the scenarios evaluated here. However, for states such as Colorado, which
might be considering adopting the Advanced Clean Car Program, the cost of these ZEVs is relevant and
our analysis considers and incorporates these ZEV costs below.
The third section of Table 5 shows the vehicle compliance costs if EPA should weaken its 2025
standards to the level of its current 2020 standards. Compliance costs outside of the Advanced Clean
Car States decrease to $377 per vehicle, while costs in the Advanced Clean Car States remain the same,
as the current GHG standards would continue to apply.
The fourth and last section in Table 5 presents the vehicle compliance costs for the Colorado Advanced
Clean Car Program. The cost per new Colorado vehicle is $1,028 per vehicle. This is slightly more than
the cost for the Advanced Clean Car States fleet prior to the addition of Colorado—a difference
attributable to the manufacturer mix of vehicles sold in Colorado.
The costs shown in this last section do not include the cost of producing the additional ZEV sales
associated with meeting the Advanced Clean Car Program in Colorado, which we estimate and discuss
in more detail below.
ZEV costs
The Market file15 used in the OMEGA model contains the cost of adding each technology package to
every vehicle in the file. For the ZEV-capable ICE vehicles, these packages include both BEV and PHEV
technologies. Using the lists of technology packages in the OMEGA Technology file, we determined
which specific packages converted the ICE vehicle to a 200-mile BEV or a 40 mile PHEV. We then
selected the cost of these packages from the Market file and applied those costs to the number of ZEVs
Colorado would need to comply with the ZEV program. (The costs in the Market file consider the
technology already on 2015 vehicles, so current technology costs are not double counted.) As shown in
the first column of Table 6, the average per vehicle cost of converting these ICE vehicles to ZEVs is
$12,585, which represents a sale-weighted average of the cost of converting vehicles to PHEV and BEV
technology. Averaged across all Colorado vehicle sales, this represents an increase per vehicle cost of
$1129. Together with the $1,087 cost of reducing GHG emissions from the rest of the Colorado new
15 The Market file contains a detailed description of each vehicle model present in the baseline fleet (here 2015 MY). This
includes the model’s manufacturer, vehicle class, engine, transmission, CO2 emission level, technology present on the vehicle.
It also contains factors which indicate the degree that each technology package reduces CO2 emissions from that vehicle model
and the cost of that technology for that model.
18vehicle fleet (from Table 5), this represents a total increase in vehicle cost of $2,216 relative to a 2015
vehicle.
Table 6: Colorado ZEV Costs Using EPA Cost Methodology (Relative to 2015
Vehicles)
Without CO ZEV With CO ZEV Tax With CO+Federal ZEV Tax
Tax Credit Credit Credits
$ per ZEV
EPA ZEV Cost $12,585 $7,585 $85
(2025)
EPA ZEV Cost $10,285 $5,285 $(2,215)
(2030)
Cost of ZEVs per Average Vehicle in Colorado
EPA ZEV Cost $1,129 $680 $(3)
(2025)
EPA ZEV Cost $920 $472 $(201)
(2030)
Colorado currently provides a $5,000 state tax credit for ZEV purchases. The middle column of Table 6
shows the ZEV cost after applying this credit, which reduces the cost per ZEV by $5,000 and reduces
average cost across all new vehicles in Colorado from $1,129 to $680. The federal government currently
provides a $7,500 tax credit for ZEV purchases. The effect of both of these credits is shown in the last
column of Table 6. As can be seen, the two tax credits combined offset the full additional cost of a ZEV
in 2025 over a conventional vehicle using EPA’s cost methodology.
Compliance costs generally decrease over time under EPA’s cost methodology due to continued
“learning” in manufacturing. For more fully mature, conventional technologies, costs in 2030 would be
only 5% lower on average, so we did not rerun the OMEGA model to capture these cost decreases.
However, EPA projects that BEV and PHEV costs will decrease more substantially, and so we used the
EPA learning methodology to develop BEV and PHEV costs in 2030.16 These costs are also shown in
Table 6.
Using EPA’s learning curves, the cost of a ZEV in Colorado (a mix of BEV200 and PHEV40 vehicles)
would decrease from $12,585 to $10,285 by the year 2030. Averaged across all Colorado sales, the cost
would decrease from $1129 per vehicle to $920 per vehicle. With the Colorado ZEV tax credit, the ZEV
cost averaged across all new vehicle sales in Colorado would decrease from $680 to $472. With both tax
credits, the ZEV cost averaged across all new vehicle sales in Colorado would decrease from a net
savings of $3 to a net savings of $201 per vehicle sold.
Table 7 shows the impact of the various GHG scenarios on the average cost of a Colorado vehicle
considering both the impact on ICE vehicles from Table 5 and ZEVs from Table 6.
16EPA did not publish compliance costs for 2030 in their Proposed Determination modeling. However, they developed and
published all of the necessary information to do so. Thus, we believe that it is appropriate to refer to these costs as EPA costs.
19Table 7: Total Vehicle Compliance Costs for a Colorado Advanced Clean Car Program
(Relative to a 2015 Vehicle) – EPA Costs
Without CO ZEV Tax With CO ZEV Tax With CO and federal ZEV
Credit Credit Tax Credits
EPA ZEV Cost (2025) $2,157 $1,708 $1,025
EPA ZEV Cost (2030) $1,948 $1,500 $827
If fuel savings are not considered, a Colorado Advanced Clean Car Program would increase average new
vehicle compliance costs, absent ZEV tax credits and relative to the weaker 2020 standards. 17 However,
considering both Colorado and federal tax credits, the vehicle costs for the Advanced Clean Car
Program would fall to well below the cost of the current EPA 2025 standards (of $1,496).
Table 8 shows the same compliance costs relative to the EPA 2020 standards. These figures show the
additional cost of a Colorado decision to opt into the Advanced Clean Car Program. These costs will also
be used below to compare to fuel savings of the Colorado Advanced Clean Car Program.
Table 8: Total Vehicle Compliance Costs for a Colorado Advanced Clean Car
Program (Relative to EPA 2020 Standards)– EPA Costs
Without CO ZEV With CO ZEV Credit With CO and federal
Credit ZEV Credits
EPA ZEV Cost $1,779 $1,330 $647
(2025)
EPA ZEV Cost $1,570 $1,132 $449
(2030)
Vehicle compliance costs using recent, lower cost data
The International Council on Clean Transportation (ICCT) recently surveyed progress in the
development of several technologies which improve the fuel efficiency of light-duty vehicles.18 These
technologies included gasoline direct injection, cooled exhaust gas recirculation (EGR), cylinder
deactivation, naturally aspirated Atkinson high compression ratio engines, turbocharged Atkinson (or
Miller cycle) engines, electrically boosted turbocharging, weight reduction, diesel engines and electric
vehicles. Some of these technologies play a large role in EPA’s analyses supporting the Final
Determination (“FD”). Others play a more minor role, at least with respect to EPA’s projections of cost
and effectiveness.
The projected cost of EV battery technology in the 2025 timeframe has decreased even more since this
ICCT study.19 A recent technology review published by Bloomberg Technology projected battery costs of
$100 per kW-hr in 2025, 16% less than those projected in the above ICCT study for 2025.20
The conventional technological advances projected by ICCT apply in 2025 and, consistent with the
above analysis, we assume will remain unchanged in 2030. The ICCT ZEV cost projections are time
17 The small difference is due to differences in ZEV sales in Colorado and non-Advanced Clean Car States absent the Advanced
Clean Car Program.
18 Lutsey, Nic, Dan Meszler, Aaron Isenstadt, John German and Josh Miller, “Efficiency Technology and Cost Assessment for
U.S. 2020-2025 Light-Duty Vehicles”, ICCT, March 2017.
19 Chediak, Mark, The Latest Case for Electric Cars: The Cheapest Batteries Ever, Bloomberg Technology,
https://www.bloomberg.com/news/articles/2017-12-05/latest-bull-case-for-electric-cars-the-cheapest-batteries-ever.
20 These costs are at the level of direct manufacturing costs. Indirect costs were estimated using EPA’s methodology.
20You can also read